Volume 101 | Issue 2
Article 7
Spring 2011
Understanding the Antecedents of the
“School-to-Jail” Link: The Relationship Between Race and
School Discipline
Michael Rocque
Raymond Paternoster
Follow this and additional works at:
http://scholarlycommons.law.northwestern.edu/jclc
Part of the
Criminal Law Commons
This Criminology is brought to you for free and open access by Northwestern University School of Law Scholarly Commons. It has been accepted for inclusion in Journal of Criminal Law and Criminology by an authorized administrator of Northwestern University School of Law Scholarly Commons.
Recommended Citation
Michael Rocque and Raymond Paternoster,Understanding the Antecedents of the “School-to-Jail” Link: The Relationship Between Race and School Discipline, 101 J. Crim. L. & Criminology 633 (2013).
633
CRIMINOLOGY
UNDERSTANDING THE ANTECEDENTS OF
THE “SCHOOL-TO-JAIL” LINK: THE
RELATIONSHIP BETWEEN RACE AND
SCHOOL DISCIPLINE
MICHAEL ROCQUE
*& RAYMOND PATERNOSTER
**One of the strongest findings in the juvenile delinquency literature is the relationship between a lack of school success, school disengagement, and involvement in the criminal justice system. This link has been deemed the “school-to-jail pipeline.” To date, research has not clarified the antecedents or origins of this school failure and disengagement, although it is known that it occurs at relatively young ages. This study examines one possible source: racial bias in school discipline experienced during the elementary school years. Using a multi-level analysis, we examine whether African-American elementary school students are more likely to receive disciplinary infractions while controlling for individual-level, classroom-level, and school-level factors. Our findings, robust across several models, show that African-American children receive more disciplinary infractions than children from other racial categories. Classroom factors, school factors, and student behavior are not sufficient to account for this finding. We also find that school-level characteristics (e.g., percentage of black students) are related to overall discipline levels, consistent with a racial threat hypothesis. These findings have important implications for the school-to-jail literature and may point to one explanation for why minority
*School of Criminology and Criminal Justice, Northeastern University. This research
was supported, in part, by Grant No. R305F050051 from the Institute of Education Sciences, U.S. Department of Education. Opinions expressed are those of the authors and do not necessarily reflect the positions and policies of the sponsor. The authors would like to thank Chad Posick, Brian Johnson, Glenn Pierce, and three anonymous reviewers for their helpful comments and insights.
students fare less well and are more likely to disengage from schools at a younger age than whites.
I.INTRODUCTION
By virtually any measure, African-American youth fare worse in school than whites. For example, black students show less interest and effort in school activities than whites and have lower grades. They are more likely to be held back, more likely to be in lower academic tracks, more likely to be in special education, more likely to drop out before graduating, and less likely to go to college.1 In addition, compared with whites, blacks have higher rates of crime and incarceration as adolescents and young adults.2 These are not unrelated facts. For example, Lochner and Moretti concluded that “schooling reduces criminal activity,”3 and the connection between black academic failure and crime has been the subject of much research and debate.4
Research is increasingly beginning to examine the connections between school failure and later contact with the criminal justice system for minorities. Various explanations for this “school-to-jail” (which some have
1
See JAY R.CAMPBELL ET AL.,U.S.DEPT OF EDUC.,TRENDS IN ACADEMIC PROGRESS: THREE DECADES OF STUDENT PERFORMANCE (2000), available at
http://nces.ed.gov/naep/pdf/main1999/2000469.pdf; Adam Gamoran, American Schooling
and Educational Inequality: A Forecast for the 21st Century, 34 SOC.EDUC. 135 (2001);
Larry V. Hedges & Amy Nowell, Changes in the Black-White Gap in Achievement Test
Scores, 72 SOC.EDUC. 111 (1999); Roslyn Arlin Mickelson, Subverting Swann: First- and
Second-Generation Segregation in the Charlotte-Mecklenburg Schools, 38 AM.EDUC.RES.
J. 215 (2001); Roslyn Arlin Mickelson, When Are Racial Disparities in Education the Result
of Racial Discrimination? A Social Science Perspective, 105 TCHRS.C.REC. 1052 (2003);
James M. Patton, The Disproportionate Representation of African Americans in Special
Education: Looking Behind the Curtain for Understanding and Solutions, 32 J.SPECIAL
EDUC. 25 (1998).
2Michael J. Leiber, Disproportionate Minority Confinement (DMC) of Youth: An
Analysis of State and Federal Efforts to Address the Issue, 48 CRIME &DELINQ. 3 (2001).
3Lance Lochner & Enrico Moretti, The Effect of Education on Crime: Evidence from
Prison Inmates, Arrests, and Self-Reports, 94 AM.ECON.REV. 155, 183 (2004).
4The magnitude of the relationship between education and crime, moreover, may not be trivial. Lochner and Moretti estimated that a one percent increase in the high school completion rate for men would save as much as $1.4 billion annually in reduced costs from crime for society. Id. at 183–84. This social saving is above and beyond any private benefit accruing to individuals from greater educational attainment. See generally Spencer Holland,
PROJECT 2000: An Educational Mentoring and Academic Support Model for Inner-City
African American Boys, 65 J.NEGRO EDUC. 315 (1996); Lance Lochner, Education, Work,
and Crime: A Human Capital Approach, 45 INT'L ECON.REV. 811 (2004); Antonio Merlo &
Kenneth I. Wolpin, The Transition from School to Jail: Youth Crime and High School Completion Among Black Males (Penn. Inst. Econ. Res., Paper No. 08-033), available at
deemed the “school-to-prison pipeline”) trajectory for blacks have been offered.5 Among these are accounts noting racial differences in socioeconomic background,6 the family life of black children, including their lack of cultural capital,7 and the existence of an oppositional subculture and identity among young blacks, wherein academic success is dismissed and ridiculed as being “too white.”8 Another possibility is that the school itself is partially to blame for the academic problems of black students, because it creates a hostile learning environment, which may be formed very early in children's educational lives—in elementary school. In other words, school disengagement and the academic troubles of young blacks could be due to feelings of racial hostility or disparate treatment by teachers, particularly disciplinary treatment,9
What I observed at Rosa Parks during more than three years of fieldwork in the school, heard from the boy himself and his teachers, from his teachers, from his mother, made it clear that just as children were tracked into futures as doctors, scientists, engineers, word processors, and fast-food workers, there were also tracks for some children, predominately African American and male, that led to prison. This book tells the story of the making of these bad boys, not by members of the criminal
and it is this racial hostility that in part leads students to disengage from school and ultimately find crime more economically attractive than legitimate labor. These explanations would theoretically link school disengagement and later involvement in the criminal justice system by a common theme of hostility toward white authority, which has its origin in the school and the coercive response of the school in reacting to this conflict with punishment. Ferguson has expressed this possibility perhaps most clearly in her account of life inside one West Coast elementary school:
5
See CATHERINE Y.KIM ET AL.,THE SCHOOL-TO-PRISON PIPELINE:STRUCTURING LEGAL
REFORM (2010); Kelly Welch & Allison Ann Payne, Racial Threat and Punitive School Discipline, 57 SOC.PROBS. 25 (2010).
6Oscar A. Barbarin et al., Family Practices and School Performance of African
American Children, in AFRICAN AMERICAN FAMILY LIFE: ECOLOGICAL AND CULTURAL
DIVERSITY 227, 238 (Vonnie C. McLoyd et al. eds., 2005); Rebecca Donovan, Path Analysis
of a Theoretical Model of Persistence in Higher Education Among Low-Income Black Youth,
21 RES. HIGHER EDUC. 243 (1984); Timothy Z. Keith & Mark J. Benson, Effects of
Manipulable Influences on High School Grades Across Five Ethnic Groups, 86 J.EDUC.
RES.85 (1992).
7See generally P
RUDENCE L. CARTER, KEEPIN’ IT REAL: SCHOOL SUCCESS BEYOND
BLACK AND WHITE (2005); Barbarin, supra note 6. 8See E
LIJAH ANDERSON,CODE OF THE STREET:DECENCY,VIOLENCE, AND THE MORAL
LIFE OF THE INNER CITY (1999); Signithia Fordham & John U. Ogbu, Black Students’ School
Success: Coping with the ‘Burden of Acting White,’ 18 URB.REV. 176 (1986).
9Brenda L. Townsend, The Disproportionate Discipline of African American Learners:
justice system on street corners, or in shopping malls, or video arcades, but in school
and by school, through punishment.10
Ferguson’s thesis in her qualitative work and the thesis of our own work, presented here quantitatively, is that because of a conflict of racial cultures and the existence of stereotypes, black youth are singled out for punishment in school, independent of their actual behavior. While we do not test the entire sequelae in this Article, we argue that this phenomenon is part of what begins the process of school disengagement for minority youth, which ultimately will land them in jail in disproportionate numbers.
Psychological research has indicated that youths are likely to disengage from school and academic pursuits if they perceive negative information about themselves or their racial group within the school environment. Steele, for example, has argued that when students perceive that racial stereotypes are being employed by teachers, they are more likely to perform poorly, which eventually leads them to detach themselves from the educational process.11 One particularly virulent outcome of racial stereotyping is racial discrimination.12 Ogbu has called this the “Pygmalion” problem;13 white expectations of blacks are internalized, leading to a sort of self-fulfilling prophecy. A stereotype by teachers that black students are academically deficient and hostile to the teachers’ goals could easily lead teachers to see black students as “troublemakers” or menaces.14
10 A
NN ARNETT FERGUSON, BAD BOYS: PUBLIC SCHOOLS IN THE MAKING OF BLACK
MASCULINITY 2 (2000) (emphasis added).
With this mindset, teachers may respond more punitively to the conduct of black students than toward identical behavior by white students. An appeal to a modified version of racial threat theory provides one possible reason for this disparate treatment in the school. While racial threat theory has traditionally implied that racial minorities pose a political and economic threat to whites, it is reasonable to also expect that whites will resort to more coercive means when minorities pose a cultural threat. Both because minority students are less likely to buy into a predominately white school culture with its emphasis on academic achievement and at least the appearance of docility (due to their own cultural values that
11 See generally Claude Steele, A Threat in the Air: How Stereotypes Shape Intellectual
Identity and Performance, 52 AM.PSYCHOL. 613 (1997); Claude Steele & Joshua Aronson,
Stereotype Threat and the Intellectual Test Performance of African Americans, 69 J.
PERSONALITY &SOC.PSYCHOL. 797 (1995).
12 See generally Charles R. Lawrence III, The Id, the Ego, and Equal Protection:
Reckoning with Unconscious Racism, 19 STAN.L.REV. 317 (1987) (arguing that racially
offensive behavior does not have to be overt). 13 J
OHN U.OGBU,BLACK AMERICAN STUDENTS IN AN AFFLUENT SUBURB:ASTUDY OF
ACADEMIC DISENGAGEMENT 77–84 (2003). 14 Ferguson,
emphasize detachment and aloofness) and because teachers are likely to believe that minority youth do not buy into white school culture (because of stereotypes), teachers in the school are more likely to resort to formal punishment against minority children than against their white counterparts. This is particularly true when minorities threaten the status of white teachers in the school. In Ferguson’s words, “school labeling practices and the exercise of rules operate as part of a hidden curriculum to marginalize and isolate black male youth in disciplinary spaces and brand them as criminally inclined.”15
This racial stereotyping and subsequent disparate treatment has implications for minority students. There is evidence that racial discrimination directed against black students is related to a host of negative developmental consequences, including diminished academic success and disengagement from school.16 This educational disengagement in turn would make it difficult for black youth to secure legitimate employment, making a life of crime more attractive or more convenient—what we call the school-to-jail link.17
Much of this research on racial discrimination in school is based upon analyses that fail to control for important variables, particularly student behavior, or have failed to simultaneously consider both individual student-and school-level factors, both of which are important in explaining disciplinary practices.18
HIGH SCHOOL (1991); Aryn M. Dotterer, Susan M. McHale & Ann C. Crouter, Sociocultural Factors and School Engagement Among African American Youth: The Roles of Racial
Discrimination, Racial Socialization, and Ethnic Identity, 13 APPLIED DEVELOPMENTAL SCI.
61 (2009); Chance W. Lewis et al., African American Male Discipline Patterns and School District Response Resulting Impact on Academic Achievement: Implications for Urban
Educators and Policy Makers, 1 J.AFRICAN AM.MALES EDUC. 10 (2010); Patricia Phelan et.
al., Navigating the Psychosocial Pressures of Adolescence: The Voices and Experiences of
High School Youth, 31 AM.EDUC.RES.J.415 (1994); Ciara Smalls et al., Racial Ideological
Beliefs and Racial Discrimination Experiences as Predictors of Academic Engagement
Among African American Adolescents, 33 J.BLACK PSYCHOL. 299 (2007); Carol A. Wong et
al., The Influence of Ethnic Discrimination and Ethnic Identification on African American
Adolescents’ School and Socioemotional Adjustment, 71 J.PERSONALITY 1197 (2001).
17
See KIM ET AL.,supra note 5, at 113.
18 Some of the studies that have failed to simultaneously examine both individual and contextual (school) factors include: Virginia Costenbader & Samia Markson, School
Suspension: A Study with Secondary School Students, 36 J. SCH. PSYCHOL. 59 (1998);
Jeremy J. Lietz & Mary K. Gregory, Pupil Race and Sex Determinants of Office and
Exceptional Educational Referrals, 3 EDUC.RES.Q. 61 (1978); Russell J. Skiba et al., Office
Referrals and Suspension: Disciplinary Intervention in Middle Schools, 20 EDUC. &
clarify why racial disparity exists with respect to school discipline, regardless of the measures used, perhaps jumping to discrimination-oriented conclusions. In this Article, we hope to contribute to this literature by examining the perhaps more inferentially difficult question as to whether or not teachers actually do discriminate against black students in the imposition of school discipline, and whether any disparate treatment is manifested at a more aggregate level and at a relatively young age (elementary school). We are thus able to address only the first part or one of the antecedents of the school-to-jail link. However, we argue that this is likely to be the most important component of the process—to the extent that the school-to-jail link can be addressed early on, the chances for dissolving the link might increase.
With data from a large number of elementary students who attended different schools within a large school district, we try to determine whether teachers are more likely to discipline black students after taking into account other possible contributory factors, including their conduct, their performance in school, and their attitudes or demeanor. By focusing on the treatment of elementary school students, we push back the window to the early years of school experience. This is a period of developmental importance, with implications for the entire life course. School scholars have long noted that racial differences in school performance, even such later-appearing events as dropping out of school, appear very early in the educational lives of students, as early as the first grade.19 Discriminatory treatment by teachers in the early elementary school years, as students are getting introduced to the school context, may have particularly important developmental consequences later in life.20
In addition to analyzing the relationship between race and school discipline at the individual level, we ask whether the racial composition of the school’s student body is related to the use of disciplinary measures by teachers. This is an explicit attempt to model the contextual effect on individual outcomes. We try, therefore, to get some understanding of the school racial climate, or the cultural context within which individual teacher-to-student relationships occur—a cultural climate that is surely
Racial and Gender Disproportionality in School Discipline, 34 URB. REV. 317 (2002)
[hereinafter Skiba et al., The Color of Discipline]. 19
See Doris R. Entwisle et al., First Grade and Educational Attainment by Age 22: A
New Story, 110 AM.J.SOC. 1458 (2005) [hereinafter Entwisle et al., First Grade]; Doris R.
Entwisle et al., The First-Grade Transition in Life Course Perspective, in HANDBOOK OF THE
LIFE COURSE 229 (Jeylan T. Mortimer & Michael J. Shanahan eds., 2003) [hereinafter Entwisle et al., First-Grade Transition].
20 See generally Entwisle et al., First Grade, supra note 19; Entwisle et al., First-Grade
Transition, supra note 19; Robert Haveman et al., Childhood Events and Circumstances
racially influenced. Racial threat theory has long argued that when the proportion of the black population increases beyond a particular threshold within a given environment, the white population feels threatened by the black population, especially if the white group views minorities as economic or political threats.21 Whites who perceive blacks as a threat to their position of dominance are hypothesized by racial threat theory to respond to the perceived menace with the use of punitive legal policies. This argument can easily be extended to the school context to the extent that it is possible for racial minorities to constitute a cultural threat to whites, as well as a political and economic threat.22
II.PRIOR LITERATURE
For example, school discipline can be understood within the context of racial threat theory because teachers (especially white teachers), with their culture of academic success and need for control over the school environment, may easily perceive black students as a source of trouble or a threat to their ability to control the cultural context of what goes on within the school. With a multi-level analysis, we examine the possibility that the level of school discipline in a school is related to the proportion of black students in the school. If the proportion of black students in a school is correlated with its use of discipline, then we have important contextual information (though clearly not strong confirmation) that helps one to understand the relationship between race and teachers’ use of discipline at the individual level. While our data does not allow us to investigate the perceptions of those authorities that use discipline, we can assess whether school composition affects punishment behaviors, independent of other causally important factors. In doing so, we contribute information about some of the processes antecedent to the construction of the school-to-jail pipeline.
Prior studies examining the distribution of discipline in schools have consistently found that racial/ethnic minority students are more likely to be disciplined than students from majority groups.23
21 See Welch & Payne, supra note
One of the earliest studies to examine this question was completed in 1975 by the Children’s Defense Fund, which found that African-American students were much more likely
5, at 29–30; see also Steward J. D’Alessio et al., The
Effect of Racial Threat on Interracial and Intraracial Crimes, 31 SOC.SCI.RES. 392 (2002).
22 See F
ERGUSON, supra note 10, at 20–21; Townsend, supra note 9, at 383–84. 23 R
USSELL SKIBA &M.KAREGA RAUSCH,THE RELATIONSHIP BETWEEN ACHIEVEMENT, DISCIPLINE, AND RACE:AN ANALYSIS OF FACTORS PREDICTING ISTEPSCORES 2–3(2004),
available at http://www.iub.edu/~safeschl/ChildrenLeftBehind/materials.html; Pamela
Fenning & Jennifer Rose, Overrepresentation of African American Students in Exclusionary
than whites to receive school suspensions.24 This study sparked further, more sociologically-oriented research on the issue of racial disparities in school discipline. The majority of studies in this area have focused on the middle and high school years.25 The findings from this body of work have nearly universally shown that minority students, especially African Americans, are more likely than whites to be the targets of school punishments such as referral to the office or suspension. Observational and ethnographic studies have confirmed these findings.26
While less prevalent, the studies that have examined racial disparity in elementary school punishment have complemented the high school studies.27
Studies have found, for example, that students who are perceived to undervalue education and lack motivation are overrepresented as recipients of school discipline.
One problem with this early round of research on race and school discipline, however, is that the studies failed to control for important variables to determine whether the observed racial disparities were due to other factors such as the attitudes or actual behaviors of the students. More recent work has made strides in this direction.
28
24 Skiba et al.,
The Color of Discipline, supra note
This may be related to racial disparities in school discipline. However, it is important to assess to what extent, if any, racial differences in behavior, rather than attitudes or perceptions of teachers, cause these disparities in discipline. Certain research has indicated that at least part of the racial disparities in official statistics can be attributed to
18, at 333. 25 See A
ARON KUPCHIK,HOMEROOM SECURITY:SCHOOL DISCIPLINE IN AN AGE OF FEAR
(2010); MASS.ADVOC.CENTER,THE WAY OUT:STUDENT EXCLUSION PRACTICES IN BOSTON
MIDDLE SCHOOLS (1986); Costenbader & Markson, supra note 18; Joy Kaufman et al.,
Patterns in Office Referral Data by Grade, Race/Ethnicity, and Gender, 12 J. POSITIVE
BEHAV. INTERVENTION 44 (2010); Aaron Kupchik, Things Are Tough All Over: Race, Ethnicity, Class and School Discipline, 11 PUNISHMENT &SOC'Y INT'L J.PENOLOGY 291
(2009); Joe D. Nichols et al., A Darker Shade Of Gray: A Year-End Analysis of Discipline
and Suspension Data, 32 EQUITY &EXCELLENCE IN EDUC. 43 (1999); Skiba et al., The Color
of Discipline, supra note 18.
26 See Edward W. Morris, “Tuck in That Shirt!” Race, Class, Gender, and Discipline in
an Urban School, 48 SOC.PERSP. 25 (2005); Edward W. Morris, “Ladies” or “Loudies”?
Perceptions and Experiences of Black Girls in Classrooms, 38 YOUTH &SOC'Y 490 (2007);
see also Kupchik, supra note 25. 27
See Costenbader & Markson, supra note 18; Dotterer, McHale & Crouter, supra note
16; see also Shi-Chang Wu et al., Student Suspension: A Critical Reappraisal, 14 URB.REV.
245 (1982); Maurice C. Taylor & Gerald A. Foster, Bad Boys and School Suspensions:
Public Policy Implications for Black Males, 56 SOC.INQUIRY 498 (1986); Josh Kinsler,
Racial Disparities in School Discipline: Racism or Rational Choice? (2006) (unpublished manuscript) (on file with author).
28 Tamera B. Murdock et al., Middle-Grade Predictors of Students’ Motivation and
differences in participation in delinquency.29 Even so, there is evidence that a nontrivial amount of racial disparity in punishment with respect to the criminal justice system is due to discrimination or bias.30 Given the connection between school discipline and other negative outcomes,31
Despite the importance of the question of whether racial disparities in school discipline are a function of differences in behavior or treatment by teachers, few studies regarding racial disparity in school discipline have attempted to litigate between these competing explanations. Certain work has examined the types of sanctions received by different student racial groups to infer whether there are differences in behavior.
fleshing out the causes of racial disparities in discipline should be an increasing research priority.
32
Although these studies have not been able to directly examine actual student behavior, they have concluded that blacks are not disproportionately involved in serious infractions. Additionally, some work has argued that minorities are more likely to be given extreme forms of punishment, despite not being involved in more serious acts.33 In fact, recent research has indicated that racial disparities in punishment are exacerbated at more punitive measures of discipline.34
Other studies have examined multiple data sources to answer the crucial question of the cause of racial disparities in discipline.35
29 See generally Michael J. Hindelang et al., Correlates of Delinquency: The Illusion of
Discrepancy Between Self-Report and Official Measures, 44 AM.SOC.REV. 995 (1979).
Horner and colleagues found that even among those rated most unruly by their peers, black students were more likely to be disciplined. However, their focus was on peer rejection/acceptance not the causes of racial disparity in punishment. Other studies have used limited data to examine whether race
30 Becky Pettit & Bruce Western, Mass Imprisonment and the Life Course: Race and
Class Inequality in U.S. Incarceration, 69 AM.SOC.REV. 151, 153 (2004).
31 Christine Bowditch, Getting Rid of Troublemakers: High School Disciplinary
Procedures and the Production of Drop-Outs, 40 SOC.PROBS. 493 (1993).
32 See generally Skiba et al, The Color of Discipline, supra note 18. See also Anna C.
McFadden et al., A Study of Race and Gender Bias in the Discipline of Handicapped School
Children, 24 URB.REV. 239 (1992); Steven R. Shaw & Jeffrey B. Braden, Race and Gender
Bias in the Administration of Corporal Discipline, 19 SCH.PSYCHOL.REV. 278 (1990).
33 Skiba et al,
The Color of Discipline, supra note 18, at 331–32; Welch & Payne, supra
note 5, at 26–29. 34
See Welch & Payne, supra note 5, at 37.
35 See generally Dotterer, McHale & Crouter, supra note 16; Costenbader & Markson,
supra note 18. See also Stacy B. Horner et. al, The Relation of Student Behavior, Peer
Status, Race, and Gender to Decisions About School Discipline Using CHAID Decision
Trees and Regression Modeling, 48 J.SCH.PSYCHOL. 135 (2010); John D. McCarthy & Dean
R. Hoge, The Social Construction of School Discipline: Racial Disadvantage Out of
is associated with punishment independent of behavior.36
While many more recent studies have found that African-American students are more likely to be disciplined in school even controlling for possible confounding factors, it is not clear what role the school context plays.
These studies continue to show that race is significantly associated with being disciplined.
37
The school disciplinary environment is important both directly, because it is a possible source of spuriousness in the relationship between race and school discipline, and indirectly, because it serves as the context for understanding any observed racial disparity. Several studies have noted that official discipline policies and practices are not uniform across schools.38 The importance of this is that differences in disciplinary policies at the school level may largely drive racial disparities in school discipline observed at the individual level. If minorities are concentrated in schools with harsher disciplinary policies, then unless school context is controlled, minorities will mistakenly appear to be discriminated against at the individual level. Wu and colleagues did incorporate school-level variables in their study, but not in a multi-level contemporaneous fashion.39 Nonetheless, and important for our purposes, school-level characteristics, such as teacher attitudes, school suspension practices, and school governance, were significantly associated with a student’s likelihood of being disciplined. One recent study has examined this issue. Welch and Payne investigated whether school racial context explains use of punishment.40
36 See generally Dotterer, McHale & Crouter, supra note
They found that in the aggregate, school racial composition was related to use of punitive discipline. However, their measure of student behavior was student-reported delinquency, thus possibly failing to capture legal behavior that is eligible for punishment. In addition, Welch and Payne did not include multi-level (e.g., HLM) models. Thus, while they showed that “racial threat” may be operating on the macro level, they were
16; Costenbader & Markson,
supra note 18. See also Michael Rocque, Office Discipline and Student Behavior: Does
Race Matter? 116 AM.J.EDUC. 557 (2010).
37 See supra note 27.
38 See generally Fenning & Rose, supra note 23; Dotterer, McHale & Crouter, supra note
16; Costenbader & Markson, supra note 18. See also Frank Bickel & Robert Qualls, The
Impact of School Climate on Suspension Rates in the Jefferson County Public Schools, 12
URB.REV. 79 (1980); Linda Mendez et al., School Demographic Variables and Out-Of-School Suspension Rates: A Quantitative and Qualitative Analysis of a Large, Ethnically Diverse School District, 39 PSYCHOL. IN SCHS.259 (2002).
39 See Wu et al., supra note 27. 40 Welch & Payne,
unable to determine if and how macro and micro factors operate conterminously on use of punitive discipline.41
Controlling for school context in a study of racial disparity in school discipline is important substantively because this context may provide insight into the meaning of any individual level effect. In understanding why teachers may use race as one basis for meting out punishment in school, one can appeal to the racial threat literature. According to racial threat theory,42 an increase in the size of a minority group will be viewed as menacing by a majority group because it threatens the majority’s position of dominance, be it political, economic, or in the case of the school, cultural. The majority group responds by increasing efforts at social control, particularly through punitive methods, in an attempt to retain control and dominance. Research in criminology has consistently shown that as the percentage of the black population increases in a particular jurisdiction, so do legal efforts to control that population.43
We are not, of course, implying that elementary school students pose a political or economic threat to teachers, but they can pose a threat to the cultural hegemony of teachers. They can passively resist the cultural doctrine that the teachers are pressing or they can adopt a counter-cultural position of opposition. If white teachers perceive that African-American students have a subculture and adopt identities that are in opposition to official school culture, it is reasonable to think that they would view them as a possible threat to their cultural control.44
41 A further limitation of this study is that by aggregating the data, the analyses could not
isolate disciplinary incidents targeting blacks. That is, their measure of punishment mixed both black and white incidents. Thus, the scenario where increases in the number of black students caused greater punishment for whites could not be ruled out.
That is, black students may
42 See generally HUBERT M. BLALOCK, JR., TOWARD A THEORY OF MINORITY-GROUP
RELATIONS (1967); Herbert Blumer, RacePrejudice as a Sense of Group Position, 1 PAC. SOC.REV. 3 (1958).
43
See generally David Jacobs & Robert M. O’Brien, The Determinants of Deadly Force:
A Structural Analysis of Police Violence, 103 AM.J. OF SOC. 837 (1998); David Jacobs & Jason T. Carmichael, The Political Sociology of the Death Penalty: A Pooled Time-Series Analysis, 67AM.SOC.REV. 109 (2002); David Jacobs & Jason T. Carmichael, The Politics of
Punishment Across Time and Space: A Pooled Time-Series Analysis of Imprisonment Rates,
80 SOC.FORCES 61 (2001); David Jacobs et al., Who Survives on Death Row? An Individual
and Contextual Analysis, 72 AM. SOC.REV. 610 (2007); Bradley Keen & David Jacobs,
Racial Threat, Partisan Politics, and Racial Disparities in Prison Admissions: A Panel
Analysis, 47 CRIMINOLOGY 209 (2009); Stephanie L. Kent & David Jacobs, Minority Threat
and Police Strength From 1980 to 2000: A Fixed-Effects Analysis of Linear and Interactive
Effects in Large U.S. Cities, 43 CRIMINOLOGY 731 (2003).
44 See generally A
NDERSONsupra note 8; FERGUSONsupra note 10; KUPCHIK, supra note 25; Kupchik, supra note 25; Morris, “Tuck in that Shirt!”, supra note 26. See also John U. Ogbu, Frameworks—Variability in Minority School Performance: A Problem in Search of
be singled out as “troublemakers” not necessarily because of what they do but because of what they think and what they represent.45
The racial threat literature in criminology and sociology has suggested that the functional form of the relationship between percentage of African Americans and official sanctions may be either linear or quadratic.
46 The possibility of a quadratic effect exists because scholars have argued that while a larger percentage of blacks may constitute a threat for whites, this threat exists only up to some point, at which it then reverses. The quadratic possibility reflects the fact that as the black population increases the risk that blacks victimize other blacks, rather than whites, increases. In a spirit of “benign neglect,”47
In this Article, we add to the existing literature on racial disparities in school punishment by looking at the relationship between individual student race and discipline imposed by teachers after controlling for differences in the perceived conduct of the student, grades, school-related attitudes, and other factors. In addition, we examine relationships between teacher and school characteristics and disciplinary practices by estimating a multi-level model that controls for the absence of independence of observations in clustered data (e.g., when students are nested within teachers within schools). We also use the school-level data to examine if the racial composition of the school is related to the risk of being disciplined. In addition, our respondents are elementary school students. We view this to be particularly well-suited to our purposes, since a disengagement from school, including bad grades, poor attendance, and dropping out are not events but a process which begins in the early years of school.
this behavior is much less threatening to whites and less likely to result in punitive actions by whites.
48
Jacob & Cathie Jordan eds., 1993); John U. Ogbu, Cultural Problems in Minority Education:
Their Interpretations and Consequences—Part One: Theoretical Background, 27 URB.REV.
189 (1995); John U. Ogbu, Cultural Problems in Minority Education: Their Interpretations
and Consequences—Part Two: Case Studies, 27 URB.REV. 271 (1995).
Given the direct and substantively nontrivial relationship that has been found with
45 See generally Carla R. Monroe, Why Are “Bad Boys” Always Black? Causes of
Disproportionality in School Discipline and Recommendations for Change, 79 CLEARING
HOUSE 45 (2005); Townsend, supra note 9. 46 David Jacobs & Daniel Tope,
The Politics of Resentment in the Post-Civil Rights Era:
Minority Threat, Homicide, and Ideological Voting in Congress, 112 AM.J.SOC. 1458, 1464
(2007).
47 See generally Jacobs et al., supra note 43; Allen E. Liska & Mitchell B. Chamlin,
Social Structure and Crime Control Among Macro Social Units, 90 AM.J.SOC. 383 (2005).
48 See generally supra notes 19 and 20. See also Karl L. Alexander et al., The Dropout
Process in Life Course Perspective: Early Risk Factors at Home and School, 103 TEACHERS
C.REC. 760 (2001); Karl L. Alexander et al., First Grade Behavior: Its Short and
increasing frequency between educational attainment and crime,49
III.METHODS
a more nuanced understanding of the early factors that contribute to the disengagement from school is imperative and timely.
A. SAMPLE
The respondents for this research included more than 22,000 students from forty-five elementary schools in a large suburban/urban/rural consolidated school district in a mid-Atlantic state. The data, collected as part of a larger study, span the 2005–2006 school year. Teacher and official reports were gathered in winter and spring 2006. Students were in grades K–5, and they ranged in age from five years to eleven years old with roughly equal proportions of students at each grade level.50 Fifty-two percent of the students were male, and the distribution by race/ethnicity was as follows: Caucasian (42.9%), African American (20.3%), Hispanic (25.6%), Asian (7.0%), and other (4.2%).51 In addition to information from students, data were collected from approximately 1,100 teachers. Teachers’ demographic information was collected, including their educational background and teaching experience, in addition to attitudinal measures that pertained to their students. Finally, we created aggregate data on the forty-five schools from information taken from students and teachers. Because of the way the data were collected, we were not able to match all the students with their teachers, nor were we able to match all teachers with their students.52 In addition, approximately 2% of the students were lost with listwise deletion of missing data.53
49 See Lochner & Moretti, supra note
We retained 19,645 students (approximately 89% of the total number of students), 990 teachers (approximately 90% of the total number of teachers), and all 45 of the schools. Together, these data are hierarchical with three levels: students nested within classrooms and classrooms nested within schools. The
3; Pettit & Western, supra note 30; Welch & Payne, supra note 4, at 31–35.
50 Students over the age of eleven were dropped from the analyses.
51 A very small majority of “others” were of “unspecified” race/ethnicity. This “other”
racial group was dropped from the analyses.
52 At times, the original research team collected data from students in a class but not their
teacher and from teachers who did not have classrooms in the student data collection. 53 In a listwise deletion of missing cases, a case is dropped if it has missing data on any
hierarchical nature of the data will be taken into account in our analytic strategy described below.
B. MEASURES
1. Dependent Variables
The dependent variables in the study were (a) whether a student was referred to the vice-principal’s office for misconduct and (b) the number of times that a student was referred at any time during the 2005–2006 school year. Referrals were almost exclusively initiated by teachers for misconduct such as truancy, showing disrespect to a teacher, inattention in class, disrupting a class, and fighting. Because of the relatively low rate of more serious behavior, we collapse all forms of misconduct resulting in discipline into one measure. This information was recorded by the principal’s office and is an official, rather than self-reported, measure of school disciplinary action. The number of office disciplinary referrals is a count variable, but unsurprisingly, it is highly skewed with a long right tail. Out of the nearly 22,000 students, 93% of them did not receive a single office referral during the year, 4% received only one referral, and six students received more than twenty. We created a truncated count variable of the number of office referrals by collapsing six or more office referrals into six referrals. This count variable ranges from zero to six or more referrals.
2. Independent Variables
a. Student Measures
Respondent’s race was measured with a series of dummy variables. Based upon the student’s self-reported designation, each youth was assigned to one of four possible racial/ethnic groups: white, Hispanic, Asian, or African-American. In all analyses the respondent’s race was treated as a separate dummy variable with white as the reference category. There were no direct measures of the social class (for example, parental education, occupation, or income) of the youth available in the dataset. As a proxy for social class, therefore, we used official information on whether the youth was eligible for a government funded free lunch program. Our measure of social class, then, was a binary variable coded as “1” if the youth received a free school lunch.54
54 See Skiba et al., The Color of Discipline, supra note
We also included measures of the
18; seealso M.KAREGA RAUSCH
respondent’s age (number of years old), and gender (male). Since both the risk and number of school referrals might be related to the degree to which the youth was academically engaged in school, we calculated a composite measure of the youths’ grade point average, ranging from 0–4, that was combined from five different subjects (math, science, social studies, reading, and writing) and based upon five previous school terms (grades). We also calculated a dummy variable that measured whether or not the student had ever been kept back a year in school (retained). We measured whether or not the child was in a special education program or a program for those where English was a second language. In both instances, a dummy variable coded as “1” was used for those who were enrolled in each respective program. To measure the amount of “exposure time” that each youth was at risk for a disciplinary referral, we used a measure of the number of days during the 2005–2006 school year that the youth attended (days attended).
In addition to all the above measures, which were based either on self-reports from students or information obtained from school administrators, our data included measures of each student’s behavior or demeanor/attitude in school that were obtained from teachers’ reports. With these teacher ratings, we can ultimately assess the effect of race on the probability and number of disciplinary referrals while controlling for student conduct and attitudes. Teachers’ reports on each student were gathered by the research team during the school year. These rating assessments were based upon a number of content areas with several items comprising each area. One of these content areas was the closeness of the relationship between the student and teacher as measured by the teachers’ response to the following eight items: (1) I share a warm and caring relationship with this child; (2) This child and I always seem to be struggling with each other; (3) If upset this child will seek me out for support; (4) This child values his relationship with me; (5) This child’s feelings toward me can be unpredictable or change suddenly; (6) This child is sneaky and manipulative with me; (7) Dealing with this child drains my energy; and (8) This child spontaneously shares his experiences and feelings with me. Responses to these teacher rating items ranged from 0 (“never”) to 3 (“always”). After reverse coding items (2), (5), (6), and (7), a composite closeness scale was created by summing and averaging the responses to the eight items (Cronbach’s alpha = .84). A scale measuring the introversion/extroversion of each student was assessed by eight items: the student (1) interacts easily with teachers, (2) seems sad, (3) makes friends easily, (4) seems withdrawn and doesn’t get involved
with other students, (5) seems anxious or worried, (6) is shy or timid around classmates or adults, (7) socializes and interacts with classmates, and (8) is a loner. After reverse coding items (1), (3), and (7), the items were summed and averaged to form a composite scale of introversion (Cronbach’s alpha = .85). We created a measure of each student’s bad behavior by summing the teacher’s responses to the following eight items: the student (1) is disruptive, (2) breaks rules, (3) defies teachers or other school personnel, (4) argues or quarrels with others, (5) teases or taunts others, (6) takes others’ property without permission, (7) is physically aggressive or fights with others, and (8) gossips or spreads rumors (Cronbach’s alpha = .90). We then summed and averaged the responses to create a measure of bad behavior. Finally, we created a measure of the extent to which the teacher thought that the youth was able to focus and concentrate on school work. The teacher rated each student on the extent to which they: (1) were easily distracted, (2) completed their assignments independently, (3) appeared eager to learn, (4) worked hard to overcome obstacles in their school work, (5) easily quit when their school work becomes difficult, (6) able to stay on task, (7) able to pay attention, and (8) learn up to their ability. After reverse coding items (1) and (5), responses were summed and averaged to create a concentration scale (Cronbach’s alpha = .92).
b. Teacher Measures
At level 2, we have information about each of the 990 classrooms and each of the teachers. Since students who are in classrooms where bad behavior is prevalent may be more at risk to receive a disciplinary report, we have a measure of classroom behavior by aggregating from the individual-level measure of teacher reports. High scores on this measure reflect classrooms where there is a greater concentration of disciplinable behavior. By similarly aggregating up from the individual level, we created measures of the mean proportion of the class that received a free school lunch, and the mean age and the mean grade point average of the students. From each teacher, we have information about their education level (1 = bachelor’s degree; 5 = Ph.D. degree), race (white teacher), gender (male teacher), the number of years of teaching experience (years experience), and the number of years in the school (years at school) where the research was conducted.
c. School Measures
school, we used a measure of the percent of the students in the school who participate in a free lunch program. To measure the general behavior of the school or school climate, we aggregated from the student-level measure of bad behavior. We measured the academic climate at the school by aggregating from the individual level the students’ grade point average. We also created two measures of the racial composition of the school, the percent of the student population that is black (percent black), and the percent black student population squared (percent black squared). Descriptive information about all variables can be found in Table 1.
IV.ANALYTIC STRATEGY
Depending on the distribution of the dependent variable, we utilized logistic regression (for dichotomous outcomes) and negative binomial regression (for counts). Both the logistic and negative binomial regressions are based on a modeling strategy that takes into account the three-level nested nature of the data (persons within classrooms within schools). As is now well known, a statistical problem of error dependency emerges with such nested data because students within the same classrooms share a common teacher, and students and teachers share a common school environment. Students within a given class are, therefore, more likely to share a common learning and disciplinary environment than students in a different class with a different teacher. Because of this, assumptions concerning independence of observations in standard regression analyses do not hold. Similarly, classrooms in the same school are likely to have a more common social, disciplinary, and cultural context compared to those in different schools. In such a situation, there are likely to be correlated residual errors within classrooms and within schools, and such dependence will lead to downwardly biased standard errors of estimated structural coefficients. Hierarchical linear models have been developed to explicitly take into account the nested nature of data such as these.55
55 S
TEPHEN W. RAUDENBUSH & ANTHONY S. BRYK, HIERARCHICAL LINEAR MODELS:
APPLICATIONS AND DATA ANALYSIS METHODS 38–45 (2d ed. 2002).
Table 1
Descriptive Statistics for Individuals, Teachers, and School
INDIVIDUALS (n = 19,645) Mean Std. Dev. Min. Max.
Free Lunch Program 000.30 000.46 000.00 0001.00
English as Second Language 000.21 000.41 000.00 0001.00
Special Education 000.11 000.31 000.00 0001.00
Retained 000.02 000.13 000.00 0001.00
Days Attended 167.07 018.66 007.00 0178.00
Age 009.57 001.74 006.29 0012.77
Grades 003.06 000.58 000.11 0004.00
Male 000.52 000.50 000.00 0001.00
Asian 000.07 000.25 000.00 0001.00
African-American 000.20 000.40 000.00 0001.00
Hispanic 000.25 000.43 000.00 0001.00
White 000.45 000.50 000.00 0001.00
Concentration 002.06 000.73 000.00 0003.00
Bad Behavior 000.28 000.46 000.00 0003.00
Introversion 000.55 000.52 000.00 0003.00
Closeness 003.25 000.77 000.00 0004.00
TEACHERS (n = 990) Mean Std. Dev. Min. Max.
Proportion Free School Lunch 000.33 000.26 000.00 0001.00
Classroom Behavior 000.31 000.22 000.00 0001.63
Mean Age 009.67 001.65 006.86 0012.57
Mean GPA 003.04 000.31 001.70 0003.88
Teacher’s Education Level 002.50 001.01 001.00 0004.00 Teacher’s Years Experience 003.17 001.30 001.00 0005.00 Teacher’s Years at School 002.31 001.12 001.00 0005.00
White Teacher 000.89 000.32 000.00 0001.00
Male Teacher 000.06 000.24 000.00 0001.00
SCHOOLS (n = 45) Mean Std. Dev. Min. Max.
Mean Level of Bad Behavior 000.30 000.26 000.18 0000.52 Proportion Free Lunch 000.33 000.23 000.03 0000.71
Mean GPA 003.03 000.20 002.59 0004.29
Teacher’s Educational Level 002.72 000.19 002.26 0003.15
Years Experience 003.26 000.38 002.59 0004.29
Years at School 002.27 000.43 001.00 0003.25
Percent Free Lunch 000.33 000.23 000.03 0000.71
Percent Black 020.94 011.12 000.72 0051.50
student) on the outcome variable (disciplinary reports) net of covariates where all estimatedparameters have corrected standard errors. To correct for correlated errors across students and teachers, all models are estimated with HLM3 software.56
The data in this study are nested in three levels: the student (level 1), the classroom or teacher (level 2), and the school (level 3). For both logistic and negative binomial regressions, a three-level HLM model was estimated. All dichotomous variables were uncentered for ease of interpretation, and the continuous measures were all grand mean centered. Results for the unit-specific model with robust standard errors are reported. We allow level 2 variables (teacher attributes) to affect the level 1 intercept and the level 1 slope for the regression coefficient of being an African-American student. The latter are essentially interaction terms for the effect of black student x teacher attributes on either the log odds (logistic regression) or count (negative binomial) of a disciplinary referral. We allow level 3 variables (aggregated school attributes) to affect the intercept. All other effects are fixed across level 2 and level 3. The degrees of freedom for level 2 and 3 are not based on the total number of cases but rather the number of units in each level.57
V.RESULTS
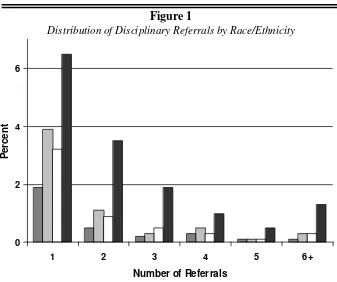
In Figure 1, we report the racial distribution of the count of referrals for students who reported at least one disciplinary report in the 2005–2006 school year. Ninety-seven percent of the Asian students, 93.9% of Hispanic students, and 94.8% of the white students received no disciplinary reports, while only 85.3% of the African-American students received no disciplinary reports that year. Put differently, nearly 15% of black students were disciplined compared to 6% of whites. Black students were, therefore, more than two times as likely to receive at least one disciplinary report compared with students of all other races. For those above the zero threshold (Figure 1), black students were more likely to receive a disciplinary report at every value by a ratio of two to one or greater. It would appear that at least at the bivariate level, black students are substantially more likely to receive a school disciplinary report than students of all other races, and receive more disciplinary reports total. Though compelling, these differences cannot tell us why black students are more likely to be disciplined, since the actions of authorities might be due to any number of possible legitimate reasons, most notably the possibly
56
Id.
57 See, e.g., Brian D. Johnson, The Multilevel Context of Criminal Sentencing:
0 2 4 6
1 2 3 4 5 6+
Number of Referrals
P
er
ce
n
t
Asian Hispanic White African-American
unruly behavior of black students in school compared with those of other racial/ethnic backgrounds. To answer this question, we move to the multivariate logistic and negative binomial regression models with HLM.
Figure 1
Distribution of Disciplinary Referrals by Race/Ethnicity
We first estimate an unconditional model for both the binary school discipline variable and its corresponding truncated count measure. These unconditional models will roughly indicate the proportion of the total variance that lies within students (level 1), across classrooms or teachers (level 2), and across schools (level 3). In the logit model, the binary measure of disciplinary referrals lacks a meaningful individual-level
variance component but can be roughly estimated as π2
/3, where π is the proportion in the sample with a 1 on the dependent variable, though this depends on underlying assumptions of the model being met.58
58 Id.; Townsend, supra note
Using this
9; see also TOM A.B. SNIJDERS & ROEL J. BOSKER,
MULTILEVEL ANALYSIS: AN INTRODUCTION TO BASIC AND ADVANCED MULTILEVEL
estimate in the unconditional logit model (data not shown), approximately 11% of the variance is at level 2 (teachers/classrooms) and 16% of the variance is at level 3 (schools). For the unconditional negative binomial model, about 14% of the variance is at level 2 and 16% at level 3. For both models, then, there is considerable variation at levels 2 and 3 warranting estimation of the HLM models.
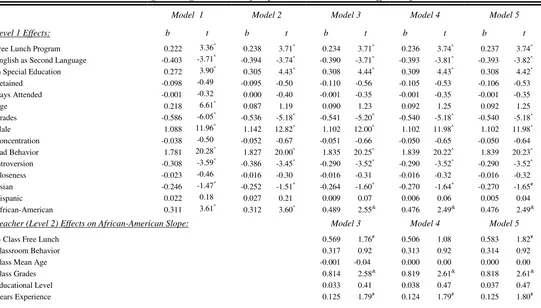
In Table 2, we estimate logistic regression models where the outcome variable is the binary indicator as to whether or not the student received at least one disciplinary report during the 2005–2006 school year. We estimate models sequentially starting with the simplest model that includes only level 1 effects, and then move to models where the intercept is random and slopes are fixed, to a final interaction model where both intercept and the slope for being an African-American student are random.
Model 1 reports the results when we consider only level 1 characteristics. Not surprisingly perhaps, the most important factor predicting the log odds of getting a disciplinary report in school is the student’s bad behavior (b = 1.781; p < .001; odds ratio of 5.936). In large measure, then, disciplinary reports are given to those students who present the most behavioral difficulties for teachers, lending some construct validity to the measure of bad behavior. In addition to those with poor/hostile conduct, however, those who are also more likely to get a disciplinary report in school are males, those in special education, older students, and less affluent students who are in a free lunch program.59
59 Approximately 62% of the Hispanic students, 43% of the African-American students, 24% of the Asian students, and 9% of the white students were enrolled in the free lunch program.
minority”60
A more informative way to look at the effect of a student’s race on the risk of a disciplinary report is to estimate the predicted probability of a disciplinary referral. Since the effects of level 1 variables do not change much across different models in Table 2, we will use the parameter estimates in Model 1 to estimate the predicted probability of a disciplinary report for students of different races controlling for all other covariates at the mean.
and suggest that there may be two currents of racial stereotyping in American elementary schools, one that privileges Asian-American students and one that disadvantages African-Asian-American students. Given the marginal significance, however, this can only be speculation at this point.
61
In Model 2, we introduce level 2 or teacher characteristics in order to determine whether characteristics of teachers or their classrooms explain the intercept or mean level of school disciplinary reports. Teachers who have on average more disruptive students are more likely to discipline students with an office referral (b = .446; p < .05), as are those who teach older elementary students rather than younger (b = .152; p < .05), and those with higher educational levels (b = .106; p < .05). Male teachers are slightly less likely to resort to referral than female teachers (b = -.306; p < .05). All of the level 1 findings stay the same in Model 2 as they were in Model 1, notably that African-American students are significantly more likely to be disciplined with an office referral than white students net of a comprehensive cluster of covariates.
When we do this (data not shown), the predicted probability of a disciplinary report for Asian students is .027, for white and Hispanic students it is .034, and for African-American students it is .046. While the absolute probabilities are low since getting a disciplinary report in school is a rare event, the probability for African-American students is 27% higher than for other students—even after taking into account such things as their grades, attitudes, gender, special education or language program, and their conduct in school as perceived by teachers. This finding indicates that black students are more likely to be disciplined in school compared with other racial groups and that this disparity is due neither to differences in their behavior nor their academic performance in school.
60 For a discussion of Asian Americans as “model minorities,” see Pat K. Chew,
Asian-Americans: The “Reticent Minority” and Their Paradoxes, 36 WM.&MARY L. REV. 1
(1994); Brian Johnson & Sara Betsinger, Punishing the “Model Minority”: Asian-American
Criminal Sentencing Outcomes in Federal District Courts, 47 CRIMINOLOGY 1045 (2009).
61 The predicted probability of a binary outcome variable in a logistic regression analysis
Model 3 includes random slopes for the relationship between being an African-American student on the chance of receiving a disciplinary report. These random slope coefficients should be understood as interaction terms, and the question being addressed is: “Does the positive relationship between being an African-American student on the risk of a disciplinary report vary by teacher/classroom level factors?” For the most part, the answer to that question is “no.” There is a stronger black student effect across classrooms that have more students in a free lunch program (b = .569; p < .05: all two-tailed tests), where the average grades are higher (b = .814; p < .01), and when the teacher has more years of teaching experience (b = .125; p < .05), but these interaction effects are very modest. We tested for other substantively interesting cross-level interaction effects, such as whether or not black students were more disadvantaged in terms of getting disciplinary reports in classrooms that were either mostly white or mostly African-American, but these interactions were all non-significant and substantively not different from zero.
In Model 4, we introduce school-level (level 3) characteristics to explain variation in the intercept or mean level of disciplinary reports across schools. None of the school-level characteristics impact the mean level of school disciplinary reports, except one. Those schools with a higher percentage of African-American students have higher mean levels of office referrals net of both teacher/classroom characteristics and characteristics of the students within the school (b = .045; p <.001). Our finding that schools with a higher proportion of African-American students are more likely to use office referrals for punishment is consistent with the racial threat hypothesis found in other criminological literature.62
62
See generally Blalock, supra note
As the black student population increases, teachers may perceive black student misconduct differently, as perhaps more menacing or more of a threat to their control, and respond to such conduct by African Americans more punitively. Disruptive student behavior may imply to school authorities that the students do not buy into the school game. More importantly, their disruptive conduct may put in jeopardy teachers’ ability to educate the remaining students. Because we have controlled for behavior of students in our analysis, the data show that there seems to be something particular about minority students’ unruly behavior that elicits a response from school officials. That is, unruly minority school students constitute a cultural threat to authorities that is responded to with an official rebuke or sanction
42; Jacobs & Carmichael, supra note 43. See also
Kent & Jacobs, supra note 43; Karen F. Parker et al., Racial Threat, Concentrated Disadvantage and Social Control: Considering the Macro-Level Sources of Variation in
Arrests, 43 CRIMINOLOGY 1111 (2005); John Shelton Reed, Percent Black and Lynching: A
Three Level HLM Logistic Regression Analysis for Whether or Not an Office Referral is Made
Model 1 Model 2 Model 3 Model 4 Model 5
Level 1 Effects: b t b t b t b t b t
Free Lunch Program 0.222 -03.36^
0.238 -03.71^ 0.234 0-3.71^ 0.236 0-3.74^ 0.237 0-3.74^ English as Second Language -0.403 0-3.71^
-0.394 0-3.74^ -0.390 0-3.71^ -0.393 0-3.81^ -0.393 0-3.82^
In Special Education 0.272 -03.90^
0.305 0-4.43^ 0.308 0-4.44^ 0.309 0-4.43^ 0.308 0-4.42^
Retained -0.098 0-0.49 -0.095 0-0.50 -0.110 0-0.56 -0.105 0-0.53 -0.106 0-0.53
Days Attended -0.001 0-0.32 0.000 0-0.40 -0.001 0-0.35 -0.001 0-0.35 -0.001 0-0.35
Age 0.218 -06.61^
0.087 0-1.19 0.090 0-1.23 0.092 0-1.25 0.092 0-1.25
Grades -0.586 0-6.05^
-0.536 0-5.18^ -0.541 0-5.20^ -0.540 0-5.18^ -0.540 0-5.18^
Male 1.088 -11.96^
1.142 -12.82^ 1.102 -12.00^ 1.102 -11.98^ 1.102 -11.98^
Concentration -0.038 0-0.50 -0.052 0-0.67 -0.051 0-0.66 -0.050 0-0.65 -0.050 0-0.64
Bad Behavior 1.781 -20.28^
1.827 -20.00^ 1.835 -20.25^ 1.839 -20.22^ 1.839 -20.23^
Introversion -0.308 0-3.59^
-0.386 0-3.45^ -0.290 0-3.52^ -0.290 0-3.52^ -0.290 0-3.52^
Closeness -0.023 0-0.46 -0.016 0-0.30 -0.016 0-0.31 -0.016 0-0.32 -0.016 0-0.32
Asian -0.246 0-1.47*
-0.252 0-1.51* -0.264 0-1.60* -0.270 0-1.64* -0.270 0-1.65#
Hispanic 0.022 -00.18 0.027 0-0.21 0.009 0-0.07 0.006 0-0.06 0.005 0-0.04
African-American 0.311 -03.61^
0.312 0-3.60^ 0.489 0-2.55& 0.476 0-2.49& 0.476 0-2.49&
Teacher (Level 2) Effects on African-American Slope: Model 3 Model 4 Model 5
% Class Free Lunch 0.569 0-1.76# 0.506 0-1.08 0.583 0-1.82#
Classroom Behavior 0.317 0-0.92 0.313 0-0.92 0.314 0-0.92
Class Mean Age -0.001 --0.04 0.000 0-0.00 0.000 0-0.00
Class Grades 0.814 0-2.58& 0.819 0-2.61& 0.818 0-2.61&
Educational Level 0.033 0-0.41 0.038 0-0.47 0.037 0-0.47
Male Teacher 0.388 0-1.13 0.378 0-1.10 0.376 0-1.09
Teacher (Level 2) Effects on Intercept: Model 2 Model 3 Model 4 Model 5
% Class Free Lunch -0.090 0-0.25 -0.294 0-0.72 -0.090 0-0.25 -0.507 0-1.00
Classroom Behavior 0.446 0-1.75# 0.552 0-2.35& 0.446 0-1.75# 0.546 0-2.31#
Class Mean Age 0.152 0-2.01# 0.152 0-2.09# 0.152 0-2.01# 0.152 0-2.07#
Class Grades -0.255 0-1.36 -0.533 0-2.60& -0.255 0-1.36* -0.526 0-2.48&
Educational Level 0.106 0-2.10# 0.100 0-2.12# 0.106 0-2.10# 0.098 0-2.10#
Years Experience -0.037 0-0.76 -0.078 0-1.47 -0.037 0-0.76 -0.076 0-1.44*
Years in School -0.011 0-0.03 0.017 0-0.27 -0.011 0-0.03 0.034 0-0.53
White Teacher -0.123 0-0.88 -0.041 0-0.26 -0.123 0-0.88 -0.014 0-0.09
Male Teacher -0.306 0-1.77 -0.461 0-2.31 -0.306 0-1.77 -0.461 0-2.32#
School (Level 3) Effects on Intercept: Model 4 Model 5
Teacher’s Mean Educational Level 0.592 0-1.06 0.467 0-0.77
Years Experience of Teachers -0.146 0-0.19 -0.103 0-0.13
Mean Years in School -1.039 0-1.47* -1.073 0-1.51*
% Student Free Lunch 0.377 0-0.30 0.235 0-0.18
Mean Bad Behavior 2.721 0-0.94 2.607 0-0.90
Mean Grades 0.353 0-0.28 0.288 0-0.18
Percent Black 0.045 0-3.75^ 0.071 0-2.26#
Percent Black Squared -0.001 0-0.96
Intercept: -4.193 -4.071 -4.146 -4.172 -4.170
Note: For a one-tailed test, * corresponds to a t≥ |1.282| and a p≤ 0.10; # corresponds to a t≥ |1.645| and a p≤ 0.05; & corresponds to a t≥ |2.326| and a