PREDICTING TECHNOLOGY ADOPTION IN PADDY (RICE) CULTIVATION AT SUKOHARJO AND WONOKARTO VILLAGE OF SEKAMPUNG SUBDISTRICT
IN EAST DISTRICT OF LAMPUNG PROVINCE, INDONESIA
Prediksi Adopsi Teknologi dalam Budidaya Padi di Desa Sukoharjo dan Wonokarto Kecamatan Sekampung Lampung Timur, Indonesia
Muhammad Ibnu1 dan Budiman Hutabarat2
1
Jurusan Studi Agribisnis Fakultas Pertanian Universitas Lampung, Jl. Prof. Dr. Soemantri Brojonegoro No. 1 Bandar Lampung 35145
E-mail:[email protected]
2Pusat sosial ekonomi dan kebijakan Pertanian, Jl. A. Yani No. 70 Bogor
E-mail:[email protected]
Naskah masuk : 6 Februari 2012 Naskah diterima : 20 April 2012
ABSTRAK
Pengenalan banyak teknologi baru selama ini telah semakin kurang berhasil, sebagaimana ditunjukkan oleh tingkat adopsinya yang rendah. Proses pengenalan teknologi baru padi sampai petani berkeinginan untuk mengadopsinya memang bukanlah hal mudah. Tujuan makalah ini adalah menganalisi faktor-faktor yang menjadi penggerak niat petani untuk mengadopsi teknologi baru dalam budidaya padi dengan mempertimbangkan efek simultan dari peubah-peubah terukur dan variabel peubah-peubah laten yang mempengaruhi niat petani. Penelitian ini mengintegrasikan technology acceptance model (TAM) dan theory of planned behavior (TPB) untuk memprakirakan penerimaan teknologi petani melalui pengukuran niat dan kemampuan menjelaskan maksud mereka dalam hal sikap, persepsi kemudahan penggunaan, penggunaan, pengalaman masa lalu, persepsi pengaruh perilaku, dan peubah-peubah yang saling berhubungan. Hasil analisis data menunjukkan bahwa peubah persepsi kegunaan, persepsi kemudahan penggunaan, dan pengalaman masa lalu petani secara positif mempengaruhi sikap petani terhadap adopsi teknologi baru. Selain itu, hasil analisi juga menunjukkan bahwa peubah sikap persepsi yang mengendalian perilaku, persepsi keguanaan, kondisi fasilitas pendukung dan persepsi risiko secara positif mempengaruhi niat petani dalam mengadopsi teknologi.
Kata kunci: niat petani, perilaku adopsi teknologi pertanian, structural equation models (SEM), technology acceptance model (TAM), theory of planned behavior (TPB)
ABSTRACT
The introduction of many new technologies has come up with limited success, as indicated by the low of observed rates of adoption. Furthermore, the process of introduction until paddy farmers have willingness to adopt this new technology is not always easy. The objective of this paper is to analyze factors that drive farmers’ intention to adopt a new technology in paddy cultivation, by taking into account simultaneous effects of measured and latent variables influencing the intention. This study uses integrated technology acceptance model (TAM) and theory of planned behavior (TPB) for predicting farmers’ technology acceptance by measuring their intentions, and the ability to explain their intentions in terms of their attitudes, perceived ease of use, perceived usefulness, past experience, perceived behavioral control, and interrelated variables. Results of this paper reveal that attitude, perceived behavioral control, perceived usefulness, resource facilitating conditions and perceived risks positively engender the intention of agricultural technology adoption.
INTRODUCTION
Technological institutional and policy innovations have been the main drivers of growth and development of business and agribusiness system in Indonesia. An empirical evidence was that the green revolution in rice and corn agribusiness. The adoption of modern varieties and the introduction of green revolution technologies implemented in Indonesia, has turned one of the major importers of rice and corn, to becoming self-sufficient country of rice in 1984 (Sisworo, 1997) and corn in 1990s (Kasryno, 2009). However, the utilization level of new agricultural technologies has slowed down, and even diminished in recent times (Musyafak and Ibrahim, 2005). Coupled with other factors, this condition seems to contribute to the decline of national rice and corn production as well as to cause Indonesia regain its position as an importer country for both commodities.
Recently, Indonesia has become one of the major rice-importer countries in the world, although paddy has been intensively cultivated since three decades ago. In 2010, the aggregate production of paddy was over 65 millions tons, but it still was not sufficient to give food for nearly 238 millions Indonesians so that rice was imported as many as 687,600 tons to fulfill the excess demands (Indonesian Central Statistic Bureau, 2011). Following the average growth rate of population by 1.2% – 4.8% per annum the consumption demand of rice is a likely to increase as well. On the other hand, Indonesian Central Statistic Bureau (2011) estimated that on the average the harvested areas of paddy production have been declining nationwide. This leads to other concerns that paddy productivity has been stagnant and conversion of fertile paddy fields to other uses has been staggering. Based on this ground, the problem of declining in rice productivity needs to be addressed.
One important ways to boost agricultural productivity is through an introduction of the better agricultural technologies and management systems (Feder, 1982; Doss, 2006). However, the introduction of many new technologies has come up with success, as indicated by the low of observed rates of adoption (Lin, 1991). In Indonesia, partial success of technological adoption is probably due to some explanations: (i) that the information about the technology is not well disseminated, (ii) the technology is not well fit to farmer condition (Musyafak and Ibrahim, 2005), (iii) communication/extension workers do not optimally play their roles (Saridewi and Siregar, 2010), and (iv) farmers who have received the information do not transferred it to other farmers (Adam, 2009).
Furthermore, the process of technology introduction, until farmers have willingness to adopt a new technology in paddy cultivation, is not always easy. Farmers frequently are less motivated or interested in adopting the new technologies introduced to them. Although the new one is promising better results than the existing ones. This is because farmers have to consider many factors before they make any decision for adoption. Therefore, this paper investigates how new technologies will be taken up by farmers through gaining insight from the farmers’ mind process in understanding and making decision to adopt technologies.
Adoption behavior, nevertheless, apparently cannot be represented effectively only by assessing direct correlation among variables. Federet al. (1985) stated that some variables that may have small correlations but in reality this is so because other variables, directly and indirectly may also have effects on the relationship that cause the spurious effects or hidden influences of the other variables. Therefore, simultaneous correlation among variables should be performed in analyses.
The paper is aimed to examine factors that drive farmers’ intention to adopt a technology, especially by highlighting suggestion by Feder et al. (1985) regarding simultaneity considerations of the factors influencing adoption behavior and holding hypothesis that factors influencing farmers’ intention to adopt a technology are correlated with one another, and they simultaneously influence the intention to adopt direct or indirectly.
METHODOLOGY
In order to present a strong theoretical basis for investigating the major factors of agricultural-technology adoption behavior, this study integrates the theory of planned behavior (TPB) and the technology acceptance model (TAM). Both are two important theories in the literatures and have been widely used to predict behavioral intention.
Model and Hypotheses
Based on a number of prior studies, it appears that both TAM and TPB are well acknowledged for predicting behavioral intention and widely accepted in various domains of researches, including in the technological arenas. However, since factors influencing consumers’ adoption of technology can be very different, depending on the technologies, target consumers, and the contexts (Taylor and Todd, 1995a, 1995b; Venkatesh et al., 2003), both theories which can offer best justification or predictions of behavior in consistent manner apparently have not been found yet.
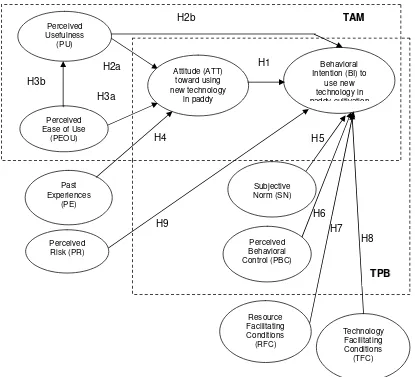
Accordingly, Dishaw and Strong (1999) and Legris et al. (2003) suggested an integrated model that may provide more analytical power than either any model alone. By integrating TPB with another theory such as TAM, a new model frequently called a decomposed TPB model is developed (Figure 3).
A decomposed TPB model is a model using TPB as its basic structure, but also decomposing attitude by incorporating perceived usefulness (PU) and perceived ease of use (PEOU) from TAM, as its mediating variables (Chau and Hu, 2001). This model was proposed by Mathieson (1991), then validated by Taylor and Todd (1995a), and several researchers afterward (e.g. Chau and Hu, 2002; Fu et al., 2006; Chenet al., 2007). The decomposed model has advantages by which allowing researchers to consider key factors influencing intention, and providing a better understanding of how these entire parameters can explain variances across users of a technology (Fu, et al., 2006) as well as guiding to a better understanding of human behavior in the context or perspective of adoption of innovations (Ronteltapet al., 2007).
Figure 3. The Proposed Conceptual Model and Research Hypotheses.
Intentions are hypothesized to capture the motivational factors influencing a behavior. They are indications of how industrious people are willing to try and how much an effort they are planning to apply, in order to perform the behavior (Ajzen, 1991). Attitude towards behavior (ATT) “refers to the degree to which a person has a favorable or unfavorable evaluation or appraisal of the behavior in question” (Ajzen, 1991, p. 188). Subjective Norm (SN) “refers to the perceived social pressure to perform or not to perform the behaviour” (Ajzen, 1991, p.188). Perceived behavioral control (PBC) is defined as “…people’s perception of the ease or difficulty of performing the behavior of interest” (Ajzen, 1991, p. 183). Perceived risk (PR), defined here as the farmer’s perception of the uncertainty and adverse consequence of a desired outcome (Fu et.al, 2006). Past Experience (PR) refers to outcomes experience from pursuing goal related to technology adoption (Bobbitt and Dabholkar, 2001).
Davis (1989, p. 320), defines perceived usefulness (PU) as “the degree to which a person believes that using a particular system would enhance his or her productivity”, and perceived ease of use (PEOU) as “the degree to which a person believes that using a particular system would be free of effort”. The resources facilitating conditions (RFC) and technology facilitating conditions (TFC) construct refer to an individual’s perceptions of the presence or absence of supporting resources and technology necessary for performing an action (Fue .al., 2006).
Further, hypotheses in Figure 3 can be summarized as following: Hypothesis 1 (H1): attitude toward a new technology directly and positively influence farmers’ intention to adopt a new agricultural technology. Hypothesis 2 (H2): (H2a) perceived usefulness (PU) of a new agricultural technology directly and positively influences the attitude toward the technology, and (H2b) PU also has a direct positive effect on farmers’ intention to accept a new technology. Hypothesis 3 (H3): (H3a) perceived ease of use (PEOU) directly and positively influences the attitude towards the new technology, and (H3b) PEOU also has a positive influence (correlation) to perceived usefulness. Hypothesis 4 (H4): past experiences (PE) of a new agricultural technology has a direct positive influence on the attitude towards the technology. Hypothesis 5 (H5): subjective norms (SN) directly and positively influence farmers’ intention to adopt a new agricultural technology. Hypothesis 6 (H6): farmers’ perceived behavioral control (PBC) towards a new agricultural technology directly and positively has influence on the intention of the new agricultural technology adoption. Hypothesis 7 (H7): resource facilitating conditions (RFC) directly and positively has an effect on farmers’ intention to adopt the new agricultural technology. Hypothesis 8 (H8): technology facilitating conditions (TFC) directly and positively increase famers’ intention to adopt the new agricultural technology. Hypothesis 9 (H9): perceived risk (PR) of a new agricultural technology directly and positively influences the intention of adopting the technology.
Data Collection
There is no agreement reached among researchers how big sample size for SEM analysis must be. However, several researchers such as Boomsma and Hoogland (2001) and Hairet al. (2006) recommend sample size should not less than 200 (bigger sample is desired) to reduce the risk of drawing erroneous conclusions in SEM and to ensure stable MLE solutions. Another common opinion among researchers is that SEM sample size is at least 50 more than 8 times the number of variables in the model. Therefore, following the later opinions, this study uses a sample of size 350 (i.e. 37*8+50=346≈350).
Table 1 shows required sample size for commonly used confidence levels in some populations. The sample sizes in the table are produced by using the following formula: n = ((K × S)/E)2; where K is desired confidence level, S is sample standard deviation, and E is the required level of precision.
Table 1. Required Sample Size
Confidence Level Population
95% C.I ± 5% C.I
Confidence Level Population
95% C.I ± 5% C.I
100 80 10,000 370
500 217 50,000 381
1,000 278 100,000 383
5,000 357 1,000,000 384
Source: O’Leary (2004)
In this study, a structured questionnaire survey was designed to verify the research model. The questionnaire contains inquiry related to every parameter in the hypothesized model (see measurement construct in Appendix A). Even though most items formulated in the had been validated prior to the research, the questionnaire was again pretested in a survey carried out to ensure the farmers could answer the questions appropriately. The subjects of the pretest were also the farmers (i.e. 20 people) from the location of the research.
Data collection was carried out in May 2009 and the respondents consist of 350 farmers. All of them regularly plant paddy as their main crops, and they were picked out of the population with systematic random sampling. By choosing every three numbers from the lists of farmers’ name, 200 participants were picked out from Sukoharjo Village, and 150 participants were picked out from Wonokarto Village. At the same time, with the pretest survey, an exploratory study was performed by asking all respondents (i.e. subject of pretest) about their perceptions and understanding of a technology in paddy cultivation. The respondents were also asked to give the examples of every aspect of technology they mentioned. This exploratory study was intended to match up perceptions of the researcher with the perception of the respondents about the technology.
Measurement of Constructs
This study uses multiple-item scales for measuring the constructs and utilizes LISREL (Linear Structural Relationship) 8.51 program for processing the data. All items, except PE, are taken from validated measures in previous empirical researches that have proven their validities and reliabilities. Items for measuring PE are taken from a conceptual framework proposed by Bobbitt and Dabholkar (2001) based on the theory of trying of Bagozzi and Warshaws. Items for PU, PEOU, BI and PR are adapted from Davis (1989), Moore and Benbasat (1991), Bhattacherjee (2000), Chau and Hu (2001), Yuet al. (2005) and Fu et al. (2006). Constructs for Attitude, SN, PBC, RFC and TFC are from Taylor and Todd (1995a). All items are measured using a five-point Likert-type scale with anchors on 5 = “strongly agree” and 1 = “strongly disagree.” Measurement of Constructs can be seen in Appendix A.
In assessing the stability of the model, the author carried out five tests as follows: (1) Confirmatory factor analysis (CFA); (2) Multicollinearity test; (3) Normality test; (4) Construct validity test; (5) Goodness of fit test of CFA; and (6) Discriminant validity; and (7) Goodness of fit test of the structural model . Confirmatory factor analysis (CFA) as the first step of data analysis (Bentler and Chou 1987; Mueller, 1996; Kelloway, 1998; Hairet al., 2006). Results from a CFA that can assist in the assessment of the validity and reliability of instruments, by redefining correlations of concepts from a CFA perspective (Mueller, 1996).
Multicollinearity is a problem in regression analysis because it causes a power of a single construct is difficult to measure as it is interfered by influence of other constructs, because in SEM it is expected that a construct should be more closely related to its own indicators than to other constructs (Grewal, 2004). Therefore, referring to the theories and prior studies, the variables causing multicollinearity should be excluded. This means that those items and constructs correlated to one another that were not supported by theories and prior studies, should be removed from the model. Although items and constructs used in this study are adapted from previous empirical research that have been proven to be valid and reliable that their the estimation will always be stable over times and places. In fact, multicollinearity exists because respondents were difficult to distinguish between |an item and a construct without referring to the others.
It is very important also to test the construct validity of the model and its parameters. One of the validity test for construct is convergent validity. A rule of thumb is (Hairet al., 2006):
Standardized factor loadings (i.e. path coefficients/λ) should exceed 0.5, ideally, 0.7 or higher.
Construct reliabilities (CR) should exceed 0.7 or higher, to indicate internal consistency.
Average variance extracted (AVE) should be 0.5 or greater.
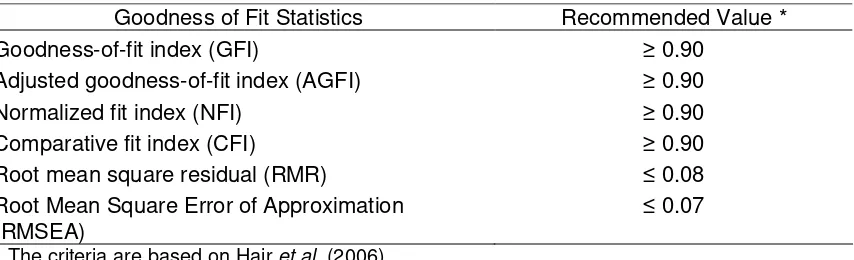
Goodness of fit test for the confirmatory factor analysis is done by comparing the results of data analysis with the recommended values on six criteria, namely: Goodness-of-fit index (GFI), Adjusted goodness-Goodness-of-fit index (AGFI), Normalized fit index (NFI), Comparative fit index (CFI), Root mean square residual (RMR), Root Mean Square Error of Approximation (RMSEA) (Table 2).
Table 2. Goodness of Fit of Model for Confirmatory Factor Analysis (CFA)
Goodness of Fit Statistics Recommended Value *
Goodness-of-fit index (GFI)
Adjusted goodness-of-fit index (AGFI) Normalized fit index (NFI)
Comparative fit index (CFI)
Root mean square residual (RMR)
Root Mean Square Error of Approximation (RMSEA)
≥ 0.90 ≥ 0.90 ≥ 0.90 ≥ 0.90 ≤ 0.08 ≤ 0.07
*) The criteria are based on Hairet al.(2006)
Goodness of fit test of the structural model is done by the same way as that of CFA above, in which the results of data analysis through SEM are compared with the recommended values on six criteria in Table 2.
Further, another important test for determining the validity of the model is discriminant validity. According to Hair et al. (2006), if all the average variance extracted (AVE) for each factor greater than squared correlation estimates, thus this suggests discriminant validity among constructs.
RESULTS AND DISCUSSION
Based on the CFA, only 8 of 10 latent variables and 27 of 37 observed variables are used in the analysis because of multicollinearity problems (see Table 3). When the first CFA model applied to the data, the result was statistically not significant because it has very low goodness of fit index and factor loadings. As example, by observing the data it seem that respondents related the item of subjective norm (SN) to attitude, by perceiving that other people might have influence on the idea of using technology which is not supported by theory. As a consequence, correlation of subjective norm (SN) to attitude (ATT) is stronger than its correlation to behavioral intention (BI). However, based on several studies, the effect of subjective norm on behavioral intention was inconsistence and insignificant (Fu et.al, 2006) and subjective norm is not a predictor of behavioral intention (Ndubisi and Nnaemeka, 2004).
Table 3. Variables Used in the Analysis, Sukoharjo and Wonokarto Villages, Sekampung Subdistrict, East Lampung District, May 2009
X7 = PEOU1 Removed X25 = TFC2 Removed
X8 = PEOU2 Used
Therefore, to avoid this multicollinearity problem and to be in line with theoretical consideration, subjective norm is excluded from the model. This situation is almost similar to case of technology facilitation condition (TFC) and perceived ease of use (PEOU) in which TFC is finally dropped out from the model.
Normality test resulted in 45 observations are outliers, leaving 255 of 350 data (i.e. respondents) to be used in the analysis (i.e. 130 from Sukoharjo and 125 from Wonokarto). The outlier data brings a consequence to the representativeness of the sample to the population. However, referring to the suggestion of Hair et al. (2006) that the recommended sample size for providing a sound basis for SEM estimation is not less than 200. As the sample size of this study was well above 200, it is more than sufficient and reliable to do SEM analysis.
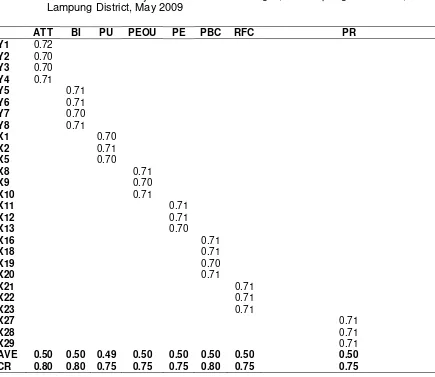
suggesting adequate reliabilities for all the parameters. In addition, average variance extracted (AVE) is in the range from 0.49 to 0.5. Except for construct PU, all other constructs are 0.5. As all three conditions for convergent validity were met, then it may be concluded that the constructs were valid.
Having tested all indicators of the CFA model against six statistical criteria (Table 5), it is concluded that all the values given by the present CFA model are better than the recommended values. Therefore, this suggests that they fit adequately for the model.
Table 4. Completely Standardized Factor Loading, Variance Extracted, and Reliability Estimates. Sukoharjo and Wonokarto Villages, Sekampung Subdistrict, East Lampung District, May 2009
AVE 0.50 0.50 0.49 0.50 0.50 0.50 0.50 0.50
CR 0.80 0.80 0.75 0.75 0.75 0.80 0.75 0.75
Table 5. Goodness of Fit of Model for Confirmatory Factor Analysis (CFA), Sukoharjo and Wonokarto Villages, Sekampung Subdistrict, East Lampung District, May 2009
Goodness of Fit Statistics Results of Data Analysis
Goodness-of-fit index (GFI)
Adjusted goodness-of-fit index (AGFI) Normalized fit index (NFI)
Comparative fit index (CFI) Root mean square residual (RMR)
Root Mean Square Error of Approximation (RMSEA)
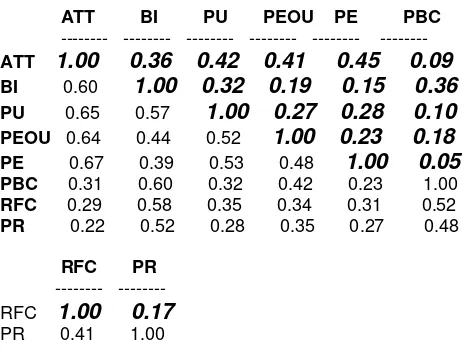
As shown in Table 6, the largest squared correlation (written in bold and italic) between any pair of constructs is 0.45, while the smallest AVE is 0.49 (see AVE in Table 4). Hence, based on the recommendation of Hair et al. (2006), the test for discriminant validity is also successfully passed as all AVE are greater than the squared correlation coefficients between constructs (written in bold and italic in Table 6).
Table 6. Construct Correlation Matrix (Standardized), Sukoharjo and Wonokarto Villages, Sekampung Subdistrict, East Lampung District, May 2009
ATT BI PU PEOU PE PBC
--- --- --- --- ---
---ATT 1.00 0.36 0.42 0.41 0.45 0.09
BI 0.60 1.00 0.32 0.19 0.15 0.36
PU 0.65 0.57 1.00 0.27 0.28 0.10
PEOU 0.64 0.44 0.52 1.00 0.23 0.18
PE 0.67 0.39 0.53 0.48 1.00 0.05
PBC 0.31 0.60 0.32 0.42 0.23 1.00
RFC 0.29 0.58 0.35 0.34 0.31 0.52
PR 0.22 0.52 0.28 0.35 0.27 0.48
RFC PR
RFC 1.00 0.17
PR 0.41 1.00
Note: squared correlation matrix is written in bold and italic
Table 7 shows that all the indicator results of SEM analysis have goodness of statistics better than the recommended values. It indicates that the current model is statistically adequate. Later, results of SEM analysis and the significance of all factor loadings (i.e. path coefficients) between constructs can be seen in Figures.
Table 7. Goodness of Fit of Model for SEM Analysis, Sukoharjo and Wonokarto Villages, Sekampung Subdistrict, East Lampung District, May 2009
Goodness of Fit Statistics Result of this Research Goodness-of-fit index (GFI)
Adjusted goodness-of-fit index (AGFI) Normalized fit index (NFI)
Comparative fit index (CFI)
Root mean square residual (RMR)
Root Mean Square Error of Approximation (RMSEA)
1.00* 0.99* 0.99* 1.00* 0,0096*
0.000* *) Significant based on Hairet al.(2006)
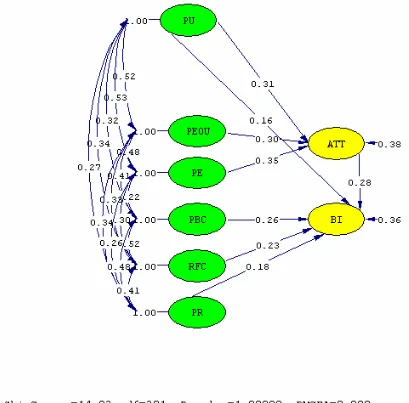
Moreover, as shown in both Figures 4 and 5, perceived usefulness (PU) influences both attitude (ATT) and behavioral intention (BI). However, perceived usefulness has an insignificant direct effect on behavioral intention as its t-value less than 1.96 at p = 0.05. Instead, perceived usefulness is one of the strong determinants of attitude, and attitude significantly has a direct effect on behavioral intention.
Figure 4 Result of SEM Analysis (Standardized)
For behavioral intention, perceived behavioral control (λ= 0. 26) is the strongest determinant, followed by resource facilitating conditions (λ= 0. 23) and perceived risks (λ= 0. 18). Overall, based on the path coefficients (λ) directly to behavioral intention, attitude (λ= 0. 28) is the strongest determinants of behavioral intention, followed by perceived behavioral control (λ= 0. 26), resource facilitating conditions (λ= 0. 23) and perceived risk (λ= 0. 18) respectively (see Figure 4).
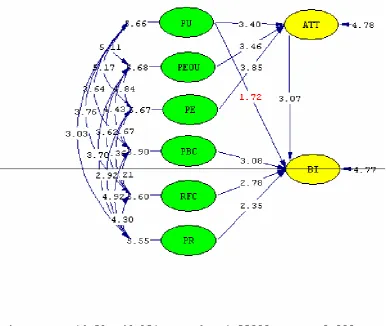
Figure 5. T-values between Constructs (p<0.005)
Table 8. Standardized Total, Direct and Indirect Effects between the Parameters Standardized Total Effects of PU, PEOU, PE, PBC, RFC, PR on ATT and BI
PU PEOU PE PBC RFC PR --- ---
---ATT 0.31 0.30 0.35 - - - -
-BI 0.25 0.08 0.10 0.26 0.23 0.18 Standardized Total Effects of ATT on BI
ATT BI --- ATT - - BI 0.28
Standardized Direct Effects of PU, PEOU, PE, PBC, RFC, PR on ATT and BI
PU PEOU PE PBC RFC PR ATT 0.31 0.30 0.35 - - - - BI 0.16 - - - - 0.26 0.23 0.18
Standardized Indirect Effects of PU, PEOU, PE, PBC, RFC, PR on ATT and BI
PU PEOU PE PBC RFC PR --- --- --- ---
ATT - - -
-DISCUSSIONS
By combining all the results above, this study confirms that farmers’ intentions are influenced by several factors, in which, directly and indirectly affecting their intentions. It implies that perceived usefulness seems to be one of the significant factors affecting both farmers’ attitude and intention to adopt technology. This finding is consistent with the results from several previous studies that scrutinized TAM (e.g. Davis, 1989; Adamet al., 1992; Chau and Hu, 2002; Fuet al., 2006 and Chenet al., 2007). This finding has several implications. First, farmers apparently have a tendency to be pragmatist in making decisions whether or not to accept technology based on: their consideration and perception of its usefulness and practicality. Second, perceived usefulness of a technoloy is an important determinant of farmer’s attitude, which exerts great influences on individual attitude development.
Perceived ease of use appears to have a significant effect on attitude and a positive correlation with perceived usefulness. This is also consistent with the results of some prior studies (e.g. Davis, 1989; Adam et al., 1992; Subramanian, 1994; Fu et al., 2006 and Chen et al., 2007). This imples that: first, finding has several implications. Firstly, farmers have the tendency to accept a technology if they think the technology is easy to use. Secondly, farmers’ perception on the usefulness of a technology is influenced by their perception on how easy it is to use.
Past experience emerges as a variable that has the most significant influence on attitude. It means that first, farmers’ attitude seems to have a positive association with their past experiences. A farmer, who does not encounter difficulties to learn and use a technology, is likely to be more optimistic to accept another technology. Second, attitude is seems also driven by satisfying experiences of using the a technology in the past. A farmer who experiences a technology that performs well in the practice, is likely to have a positive attitude to accept another technology.
As the model predicts, attitude appears to be the most important determinant of a farmer’s intention for accepting a technology in paddy cultivation. This finding is consistence with some other studies that used TPB and/or TAM as a basic structure of their models (e.g. Godin and Kok, 1996; Hausenblaset al., 1997; Chau and Hu, 2002 and Chenet al., 2007). Furthermore, a farmer, who has positive attitude toward a technology, is the most likely to favor of using a technology a good and a wise idea. This type of farmer would also advocate himself that using the technology in his farm would be pleasant. In turn, this kind of attitude would support his intention to adopt the technology.
Furthermore, a common characteristic of people in rural areas in Indonesia, is they are connected well with a kinship system (Center of Society Service of Kristen Petra University, 2005) so that they know one another relatively well. However, people in rural areas normally will also open their hands in accepting other people from outside their surroundings and they usually do not reject what outsiders bring at the first encounter.
Meanwhile, resource facilitating conditions turns out to be another significant factor that influences farmers’ intention. This result is different with the prior studies (i.e. Fu et al., 2006) where resource facilitation conditions only have little or no effect on the behavioral intention. This result suggests that has some impacts. firstly, farmers are likely accept a technology when they believe they have enough resources (e.g. land, labors, etc.) to support the use of the technology. Secondly, if they are confident that appropriate supporting means (e.g. tools, fuel, etc.) is not difficult to find be found, they become easier to accept technology. Thirdly, the decision farmer’s to use technology is also determined by farmer’s ability, whether the technology is affordable or not.
Perceived risk also appears as one important factors affecting farmers’ intention. This result is somewhat different with that of previous study (i.e. Fuet al, 2006) to which perceived risk has barely on or no effect on the behavioral intention. This finding indicates that, first, who a farmer, is unease about the risk of a technology on his current income, would be the most likely to avoids the technology or would just passively waits and sees. On the other hand, a farmer who considers using a technology is not a threat to his income would likely accept the technology. Secondly, farmer’s psychological conditions also matter in using a technology. Thirdly, farmers seem to also consider and evaluate the safety of using a technology.
However, the results of this study should be cautiously interpreted. Notwithstanding its methodological aptness, this still bears some limitations. First, this study uses a cross-sectional data to construct correlations matrix, so that causal relationships could not identified exactly. Second, by removing two parameters from the model (i.e. subjective norm and resource facilitation condition), this study cannot confirm whether the parameters have significant influences on farmers’ behavioral intention or not. This brings this study to its third limitation, in which, the model just accounts for about 61% of the variance of behavioral intention (R2BI = 0.61), indicating that some more variables needed to explain the rest of this variance are still excluded.
CONCLUSION AND RECOMMENDATIONS
Understanding whether and why farmers will adopt a new product or service is a critical insight for stakeholders involved in technology diffusion programs.
Although the majority of the participants in this study have low formal education, they were very rational and they put considerations on many factors that affect their intention.
As found in other previous studies, this study validates, parameters of the behavioral intention equation were not consistently significant. Among parameters influencing farmers’ intention, the behavioral intention is largely driven by attitude, in which, it can explain nearly 40 % of the variances in intention. Furthermore, perceived behavioral control represents the second largest determinant of behavioral intention followed by perceived usefulness, resource facilitating conditions and perceived risk respectively. Thus, in constructing an intention toward using a technology, it seems that farmers tend to rely on their perception of ability to afford a technology, of knowledge and skill capacities, of the usefulness of the technology, of the resources that support the use of the technology, and of the risks following the utilization of the technology.
toward a new technology by showing to farmers that this new technology is useful and easy to use. This can be conducted in several ways, for instance: demonstration of using machines or tools, a demonstration plot, a training, watching video and, if possible, arranging a trip to another farming activity which has been applying the new technology successfully.
Concerning past experiences, communication/extension workers should transform a negative experience to be more positive by giving new constructive experiences to farmers. The aforementioned examples may give new experiences for farmer. In addition, one thing that should be considered is the approaches, the educations and the trainings should be appreciate to farmer as an adult learner. Hence, farmer should be given opportunities to learn by doing, to ask questions, to tell their problems, to comment and to discuss. By doing so, at least farmer will get two experiences. First, experience of learning and using a new technology, and second, experience of how to learn. Interpersonal approaches are very important in developing trust and triggering the farmers to have optimistic outlook toward a new technology.
As perceived behavioral control is a factor significantly influencing behavioral intention of adopting a new technology. A feeling of confident of farmer should be fostered by showing, practical learning, training and conducting a small demonstration plot. So farmer could see that a new technology does not always demand a lot of time to learn, and is not always difficult to master, yet it is better. Farmers should also be trained strategies to organize themselves for purchasing a costly indispensable technology.
As an example, collectively farmers can share some money to buy a machine. Then, they can make schedule arrangement on the use of the machine. Farmers in Sukoharjo and Wonokarto villages have practiced a quite similar activity in buying fertilizer, especially a based-fertilizer.
Resource facilitating conditions is another factor that significantly has direct impact on farmers’ intention. It reconfirms that a shared facility or a kind of joint venture to afford resources is indeed a good way for expanding the use of a technology. However, another alternative is also available such as requesting contributions contributions from stakeholders such as governments, universities, and private sectors (e.g. a company, a supplier etc.).
In view of the fact that perceived risk is affects farmers’ intention to adopt a new technology. A combination of strategies, roles and functions is needed to reduce the anxiety of farmers in adopting a new technology. Several ways to do that are by providing relevant information about a new technology (e.g. via brochures, leaflets, etc.), doing interpersonal approaches, conducting discussions and careful examinations of the new technology, illustrating technology using a diagram, a picture or a video, doing demonstration plots, as well arranging a trip to another farming activities.
REFERENCES
Adam, M. (2009) Pengaruh Tingkat Penyerapan Adopsi Teknologi serta Pendapatan Petani Padi Sawah Pasang Surut di Kabupaten Indragilir hilir dan Siak. Jurnal Teroka Vol. IX No. 02 April 2009 p. 181-190.
Adams, D. A., R. R. Nelson, and P. A. Todd. 1992. Perceived usefulness, ease of use and usage of information technology: a replication. MIS Quarterly 16 (2), pp. 227–247.
Armitage, C. J., and M. Conner. 1999. The Theory of Planned Behavior: Assessment of Predictive Validity and Perceived Control. British Journal of Social Psychology 38, pp. 35-54.
Armitage, C. J., and M. Conner. 2001. Efficacy of The Theory of Planned Behavior: A Meta-Analytic Review. British Journal of Social Psychology 40 (3), pp. 471–499.
Bentler, P. M., and C. P. Chou. 1987. Practical Issues in Structural Modeling. Sociological Methods and Research 16 (1), pp. 78–117.
Bhattacherjee, A. 2000. Acceptance of E-Commerce Services: The Case of Electronic Brokerages. IEEE Transaction on Systems, Man, and Cybernetics Part A: Systems and Humans 30 (4), pp. 411–420.
Bobbitt, L. M., and P. A. Dabholkar. 2001. Integrating Attitudinal Theories to Understand and Predict Use of Technology-Based Self-Service: The Internet as An Illustration. International Journal of Service Industry and Management 12 (5), pp. 423-450.
Bollen, K. A., and J. S. Long. 1992. Test for Structural Equation Models: Introduction. Sociological Methods and Research 21 (2), pp. 123–131.
Boomsma, A., and J. J. Hoogland. 2001. The Robustness of LISREL Modeling Revisited. In R. Cudeck, S. du Toit and D. Sörbom (Eds.), Structural equation models: Present and future. A Festschrift in honor of Karl Jöreskog, pp. 139–168. Lincolnwood, IL: Scientific Software International.
Center of Society Service of Kristen Petra University. 2005. Ethics and Culture of Rural Society. A Working Paper for COP Training Period XII, The Kristen Petra University. Available from: http://lppm.petra.ac.id/ppm/COP/download/etika%20budaya%20masyarakat%20desa.doc. [Accessed 20 April 2009].
Chau, P. Y. K., and P. J. H. Hu. 2002. Investigating Healthcare Professional’s Decisions to Accept Telemedicine Technology: An Empirical Test of Competing Theories. Information and Management 39, pp. 297–311.
Chau, P. Y. K., and P. J. Hu. 2001. Information Technology Acceptance by Individual Professionals: A Model Comparison Approach. Decision Sciences 32(4), pp. 699-719. Chen, C. D., Y. W. Fan, and C.K. Farn. 2007. Predicting Electronic Toll Collection Service
Adoption: An Integration of the Technology Acceptance Model and the Theory of Planned Behavior. Transportation Research Part C 15, pp. 300–311.
Davis, F. D. 1989. Perceived Usefulness, Perceived Ease of Use, and User Acceptance of Information Technology. Information System Quarterly 13 (3), pp. 319-340.
Dishaw, M. T., and D. M. Strong. 1999. Extending the Technology Acceptance Model with Task-Technology Fit Constructs. Information and Management 36 (1), pp. 9–21.
Doss, C. R. 2006. Analyzing Technology Adoption Using Micro Studies: Limitations, Challenges, and Opportunities for Improvement. Agricultural Economics 34, pp. 207–219.
Feder, G. 1982. Adoption of Interrelated Agricultural Innovations: Complementarity and the Impacts of Risk, Scale, and Credit. American Journal of Agricultural Economics 64 (1), pp. 94-101.
Feder, G., R. E. Just and D. Zilberman. 1985. Adoption of Agricultural Innovations in Developing Countries: A Survey. Economic Development and Cultural Change 33 (2), pp. 255-298. Fu, J. R., C. K. Farn, and W. P. Chao. 2006. Acceptance of Electronic Tax Filing: A Study of
Taxpayer Intentions. Information and Management 43 (1), pp. 109–126.
Godin, G., and G. Kok. 1996. The Theory of Planned Behavior: A Review of Its Applications to Health-Related Behaviors. American Journal of Health Promotion 11, pp. 87–98.
Grewal, R. and J. A. Cote. 2004. Multicollinearity and Measurement Error in Structural Equation Models: Implications for Theory Testing. Marketing Science 23 (4) pp. 519–529.
Harrison, D. A., P. P. Mykytyn, and C. K. Riemenschneider. 1997. Executive Decisions about Adoption of Information Technology in Small Business: Theory and Empirical Tests. Information Systems Research 8 (2), pp. 171-195.
Hausenblas, H. A., A. V. Carron, and D. E. Mack. 1997. Application of the Theories of Reasoned Action and Planned Behavior to Exercise Behavior: A Meta-Analysis. Journal of Sport and Exercise Psychology, 19, pp. 36–51.
Hu, P. J., P.Y.K. Chau, O.R. Liu Sheng, and K. Yan Tam. 1999. Examining the Technology Acceptance Model Using Physician Acceptance of Telemedicine Technology, Journal of Management Information Systems 16 (2), pp. 91–112.
Indonesian Central Statistic Bureau. 2011. Trends of the Selected Socio-Economic Indicators of Indonesia March 2011. Jakarta: BPS - Indonesian Central Statistic Bureau.
Kasryno, F. et al. 2009. Gambaran Umum Ekonomi Jagung Indonesia. Available from Http:// pustaka.litbang.deptan.go.id/bppi/lengkap/bpp10229.pdf.
Kelloway, E. K. 1998. Using LISREL for Structural Equation Modeling: A Researcher’s Guide. London: Sage Publications.
Legris, P., J. Ingham, and P. Collerette. 2003. Why Do People Use Information Technology? A Critical Review of the Technology Acceptance Model. Information and Management 40, pp. 191–204.
Lin, J. Y. 1991. Education and Innovation Adoption in Agriculture: Evidence from Hybrid Rice in China. American Journal of Agricultural Economics 73 (3), pp. 713-723.
Lu, C. S., K. H. Lai, and T. C. E. Cheng. 2007. Application of Structural Equation Modeling to Evaluate the Intention of Shippers to Use Internet Services in Liner Shipping. European Journal of Operational Research 180, pp. 845–867.
Mathieson, K. 1991. Predicting User Intentions: Comparing the Technology Acceptance Model with the Theory of Planned Behavior, Information Systems Research 2(3), pp. 173–191. Moore, G. C., and I. Benbasat. 1991. Development of an Instrument to Measure the Perceptions of
Adoption an Information Technology Innovation. Information Systems Research 2 (3), pp. 192–222.
Mueller, R. O. 1996. Basic Principle of Structural Equation Modeling: an Introduction to LISREL and EQS. New York: Springer-verlag.
Musyafak, A. and Tatang M. I. 2005. Strategi Percepatan Adopsi dan Inovasi Pertanian Mendukung Prima Tani. Jurnal Analisis Kebijakan Pertanian. Volume 3 No. 1, Maret 2005 : 20-37.
Ndubisi, N. O. and N. C. Chukwunonso. 2004. On-Line Learning Adoption Intention: Comparing the Predictive Power of Two Competing Models. Conference Paper. Available from http://www.herdsa.org.au/wp-content/uploads/conference/2004/PDF/P058-jt.pdf.
O’Leary, Z. 2004. The Essential Guide to Doing Research. California: Sage Publication.
Pavlou, P. A. 2003. Consumer Acceptance of Electronic Commerce: Integrating Trust and Risk with the Technology Acceptance Model. International Journal of Electronic Commerce 7 (3), pp. 101–134.
Rogers, E.M. 1995. The Diffusion of Innovation, 4th ed. New York: Free Press.
Ronteltap, A., J. C. M. van Trijp, R. J. Renes, and L. J. Frewer. 2007. Consumer Acceptance of Technology-Based Food Innovations: Lessons for the Future of Nutrigenomics. Appetite 49, pp. 1–17.
Sheeran, P. and S. Taylor. 1999. Predicting Intentions to Use Condoms: A Meta-Analysis and Comparison of the Theories of Reasoned Action and Planned Behavior. Journal of Applied Social Psychology 29 (8), pp. 1624-1675.
Sisworo, W.H. 1997. Revolusi Hijau dan Swa Sembada Beras (Bagian Kedua): Kelaparan,
Kemiskinan dan Isu Lingkungan. Available from:
http://www.drn.go.id/index2.php?option=isi&do_pdf=1&id=82.
Subramanian, G. H. 1994. A Replication of Perceived Usefulness and Perceived Ease-of-Use Measurement. Decision Science 25(5/6), pp. 863–874.
Taylor, S., and P. A. Todd. 1995a. Understanding Information Technology Usage: A Test of Competing Models. Information Systems Research 6 (2), pp. 144–176.
Taylor, S., and P. A. Todd. 1995b. Assessing IT Usage: The Role of Prior Past Experience. MIS Quarterly 19 (2), pp. 561-570.
Venkatesh, V., M. G. Morris, G. B. Davis, and F. D. Davis. 2003. User Acceptance of Information Technology: Toward a Unified View. MIS Quarterly 27 (3), pp. 425–478.
Appendix A. Items for Measuring the Constructs
BI2 I will use the new technology in paddy cultivation soon after it is launched
BI3 I predict I will use the new technology in paddy cultivation on a regular basis in the future
Behavioral Intention (BI) (Davis, 1989; Yuet al., 2005; Fuet al., 2006)
BI4 I would like to recommend the use of new technology in paddy cultivation to my relatives and friends.
PU1
Using the new technology in paddy cultivation enables me to work more quickly so that increases my productivity
PU2 Using the new technology in paddy cultivation improves the efficiency of cultivating system
PU3 Using the new technology in paddy cultivation makes it easier for me to produce good rice
PU4 Using the new technology in paddy cultivation makes me effectively control my working time on the rice field PU5 The advantages of the new technology in paddy
PEOU1 Learning to operate/apply a new technology in paddy cultivation is easy for me
PEOU2 It is easy for me to be accustomed to use new technology in paddy cultivation
PEOU3 I find a new technology in paddy cultivation system is easy to use for me
Perceived ease of use (PEOU)
(Davis, 1989; Bhattacherjee, 2000; Chau and Hu, 2001)
PEOU4 Overall, I believe that a new technology in paddy cultivation is easy to use
PE1 Based on my experiences, it was easy to learn to use a new technology in paddy cultivation
PE2 Based on my experiences, it was affordable to use the new technology in paddy cultivation
Past Experiences (PE) (Bobbitt and Dabholkar, 2001)
PE3 I found that the new technology gave better outcomes than the old ones.
SN1 People who influence my behavior would think that I should use the new technology in paddy cultivation Subjective norm (SN)
(Taylor and Todd, 1995a)
paddy cultivation
There are enough resources (e.g. money, land, labors) for me to use new technology in paddy cultivation
RFC2
I can find appropriate supporting means (e.g. tools, fuel etc) when I want to use new technology in paddy cultivation.
Resource facilitating conditions (RFC)
(Taylor and Todd, 1995a)
RFC3 Using the new technology in paddy cultivation is affordable for me problems using new technology is very important Technology facilitating
PR2 I will not feel difficult psychologically if I use the new technology in paddy cultivation
Perceived risk (PR) (Fuet al., 2006)
PR3
I think it is safe to use the new technologies in paddy cultivation because they have been experimented and implemented by the agricultural experts and others
Appendix B. Demographics of Respondents
Data of Respondents (in Average) Sukoharjo Village Wonokarto Village
Age of Respondents 45.44 45.36
Number of family members 4.29 4.34
Number of farmers in the family 2.26 2.27
Time length of becoming a farmer (year) 22.20 22.26
Time length of cultivating paddy/ rice (year) 20.39 20.00
Farm size (hectare) 0.49 0.46
Paddy production per harvest (ton) 6.59 2.50
Number of harvests per year (times/year) 1.50 1.40