Demographia
World Urban Areas
DEMOGRAPHIA WORLD URBAN AREAS
13
thANNUAL EDITION
April 2017
(Built Up Urban Areas or World Agglomerations)
TABLE OF CONTENTS
Demographia World Urban Areas (Introduction)
1
URBAN AREA LISTINGS
p
Table 1: Largest Urban Areas in the World
18
Table 2: Urban Areas by Land Area (Urban Footprint)
35
Table 3: Urban Areas by Urban Population Density
53
Table 4: Urban Areas by Geography (Including Selected under 500,000 Population)
71
SUMMARY TABLE
SUMMARY TABLE
Table 5: Summary: Urban Areas Over 500,000
112
COVER PHOTOGRAPH
Dhaka: Farmgate (by author)
demographia.com/db‐worldua‐index.htm
© Copyright Notice
All rights reserved
Permission granted to copy or republish only without alteration of any data, name of urban area or
g
( y
)
RELATED PUBLICATIONS
Toward More Prosperous Cities:
Framing Essay on Urban Policy
13th Annual Demographia International
Housing Affordability Survey
The Evolving Urban Form
(Profiles of World Urban Areas)
A Question of Values: Middle-Income Housing
Affordability and Urban Containment Policy
City Sector Model
(Urban Core & Suburban Small Area Analysis
within US Metropolitan Areas
`
Demographia World Urban Areas
(Built-Up Urban Areas or Urban Agglomerations)
13th Annual Edition: April 2017
INTRODUCTION
CONTENTS OF THE INTRODUCTION
1.
Demographia World Urban Areas
2.
Important Revisions
3.
Distribution of Population
4.
Built-Up Urban Areas: Definitional Issues
5.
Smaller Urban Areas (Under 500,000 Population)
6.
Geographical Notes
7.
Methodology
8.
Caution: Trend Analysis
9.
Cover Illustration: Farmgate, Dhaka
10. Comments and Suggestions
1. DEMOGRAPHIA WORLD URBAN AREAS
Demographia World Urban Areas
(Built-up Urban Areas or
Urban Agglomerations)
is the only annually published
inventory of population, corresponding land area and population density for urban areas with more than
500,000 population. Unlike metropolitan area lists,
Demographia World Urban Areas
applies a generally
consistent definition to built-up urban areas.
1Urban footprint data is reported without regard political
boundaries that are generally associated with metropolitan areas or sub-national jurisdictions.
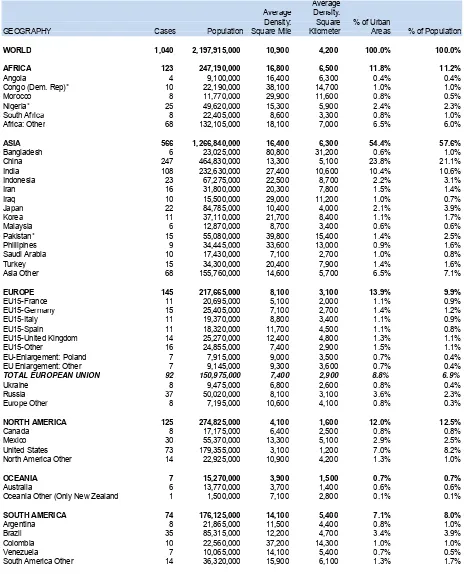
This report contains population, land area and population density for all 1,040 identified built-up urban
areas (urban agglomerations or urbanized areas) in the world with 500,000 or more population. The total
population of these urban areas is estimated at 2.2 billion, 53 percent of the world urban population in
2017.
2A number of smaller urban areas are also listed. Overall, data is provided for 1,746 urban areas of all sizes,
which comprise a population of 2.34 billion people, 57 percent of the world urban population.
1
Other regularly published urban agglomeration lists do not contain consistently defined entities. They tend to mix
metropolitan areas, municipalities (parts of metropolitan areas) and urban areas (built up urban areas or
agglomerations). None of these lists include urban land area data. The United Nations list is unique in providing
notes that clarify the nature of its each of its listings (core cities, metropolitan areas, urban areas and others).
2
2. IMPORTANT REVISIONS
2017 Revisions
New census data and estimates as well as later satellite imagery has led to some substantial revisions in
the 2016 edition of
Demographia World Urban Areas.
The most notable are indicated below:
•
Canada has revised its method for delineation of built-up urban areas (population centres). Urban
areas are now comprised of qualifying small area “blocks,” rather than the former municipalities.
Some municipalities included large tracts of rural land and this revision removed these areas from
the urban areas. As a result, urban area densities in Canada are higher and land areas smaller.
•
New local population estimates are available for some larger municipalities (prefectures) in China
and have been used to calculate new population bases. Almost without exception, population
growth has been well below United Nations projected levels since the 2010 census. Population
estimates for built-up urban areas with base years before 2013 are likely to be high, because
newer estimates may show slower growth rates
•
The adjacent Shenyang and Fushun (Liaoning, China) urban areas have been combined.
•
The built-up urban areas of Boston and Providence (USA) and other smaller adjacent built-up
urban areas have been combined as a result of their now being included in the Boston combined
statistical area.
Earlier Revisions
There were important revisions tithe 2016 edition of
Demographia World Urban Areas.
The most notable
are indicated below:
•
Demographia World Urban Areas
is now using the
Africapolis
population and urban land area data
were available, considering them to be the closest approximation to national census data on
built-up urban areas.
Africapolis
data covers West African nations and most importantly, appears to
provide reliable data on the built-up urban areas of Nigeria, where official data has often been
challenged. The availability of the
Africapolis
data makes it unnecessary for
Demographia World
Urban Areas
to develop independent built-up urban area data in West Africa outside Nigeria, where
no difficulty in census data is indicated.
•
The Mumbai built-up urban area has been expanded to incorporate the Bhiwandi, Kalyan and
Vasai-Virar urban areas. This is generally consistent with the definition of the Census of India, with
the exception that
Demographia
includes Bhiwandi.
•
A new population census ends more than 30 years since the last in Myanmar. Built-up urban area
estimates have been updated using this information.
•
The lower range population estimates for the Lagos built up urban area have been largely
confirmed by the
Africapolis
project (see Geographical Notes, below). There has been
considerable controversy about the population of Lagos for years and local governments had
claimed the census of Nigeria had severely under-counted its population. The new information is
generally consistent with the Nigerian federal government population data.
•
A new urban area of more than 5,000,000 residents has been identified by
Africapolis
, Onitsha,
Nigeria.
•
Later local government population estimates in China indicate a slowing of population growth.
Revised Format
Tables have been simplified and reorganized starting in 2016. The population base, base year and
estimates for built-up urban areas with less than 500,000 population are shown in Table 4 only. Table 4
contains all urban areas covered, in alphabetical order by geography and built-up urban area name.
3. DISTRIBUTION OF POPULATION (BY URBAN AREA SIZE, URBAN DENSITY AND CONTINENT)
In recent years, the world has become
more than one-half urban for the first
time in history (54.9 percent in 2017).
Yet, it would be a mistake to believe that
the world's urban residents live in
settings similar to 5th Avenue in New
York or within the fourth ring road of
Beijing or in inner Paris, or for that matter
in large urban areas. Even in urban
settings that are not particularly dense,
such as suburban areas. Further, more
than 70 percent of the world’s population
lives in urban areas with less than
500,000 residents
3or in rural areas
(See:
What is a Half-Urban World?
4).
Less than 30 percent (28.6 percent) lives in urban areas with 500,000 or more population.
5More than 70
percent of the world's population lives outside urban areas with 500,000 or more residents (Figure 1).
63
The of urban areas under 500,000 is estimated by applying ratios from
, Making Room for a Planet of Cities
(Shlomo Angel, with Jason Parent, Daniel L. Civco, and Alejandro M. Blei) to the Demographia data.
4
Wendell Cox (2012), "What is a Half-Urban World,"
The New Geography
,
http://www.newgeography.com/content/003249-what-a-half-urban-world.
5
A slight majority of the large urban area
population lives in built-up urban areas
with between 4,000 and 10,000 persons
per square kilometer (approximately
10,000 to 25,000 persons per square
mile). Approximately one-quarter live at
higher densities and one quarter live at
lower densities (Figure 2)
More than one-half of the population of
large built-up urban areas (500,000 and
over) are in Asia, living in 566 of the 1,040
large urban areas (Figure 3). The Asian
areas comprise 57 percent of the world’s
large urban area population.
There are 37 megacities in the world (urban areas over 10 million population). A total of 84 urban areas are
indicated with 5,000,000 or more population.
4. BUILT-UP URBAN AREAS: DEFINITIONAL ISSUES
An urban area ("built-up urban area,"
7urbanized area or urban agglomeration)
8is a continuously built up
land mass of urban development that is
within
a labor market (metropolitan area or metropolitan region). An
urban area contains
no
rural land (all land in the world is either urban or rural). In some nations, the term
"urban area" is used, but does not denote a built-up urban area.
9An urban area is best thought of as the “urban footprint” --- the lighted area that can be observed from an
airplane (or satellite) on a clear night. National census authorities in Australia, Canada, Denmark, Finland,
France, the Netherlands, Norway, Sweden, the United Kingdom and the United States designate urban
areas. Except in Australia, the authorities use a minimum urban density definition of 400 persons per
square kilometer (or the nearly identical 1,000 per square mile in the United States) in areas that comprise
urban areas.
By necessity, average data masks significant variations within urban areas. Within urban areas, urban
population densities can range from below 400 per square kilometer (1,000 per square mile), particularly in
North American urban areas, to over 1,000,000 per square kilometer (2,500,000 per square mile) in
informal neighborhoods
10of some Asian cities (such as in Dhaka).
116
The of urban areas under 100,000 is estimated by applying ratios from
, Making Room for a Planet of Cities
7
"Built up urban area" is the new urban area term now used by National Statistics in the United Kingdom. It may be
the most descriptive short term for urban areas.
8
Called a "population centre" in Canada and an "urban centre" in Australia.
9
For example, in China, sub-city or sub-regional districts called “shixiaqu” (
市辖区) are sometimes referred to as
urban areas. Shixiaqu resemble metropolitan areas, containing both urban and rural land. Districts designated as
urban often have large tracts of rural land on which urban development is anticipated.
10
There are also significant differences in density variation within built-up urban areas. Average urban density
does not provide any information on such variations, nor can it be assumed that an urban area with a
higher average density will have higher neighborhood densities. For example, the population density of the
Phoenix urban area is more than 60 percent higher than in the Boston-Providence urban area. Yet, the
highest population densities of
Boston-Providence are at least five times that of
the highest density areas in Phoenix.
Moreover, Boston-Providence has a far
larger commercial core (“central business
district” or “downtown”). The difference is
that the Phoenix suburbs are denser than
the Boston-Providence suburbs.
Higher density suburbs are also
responsible for making Los Angeles the
most densely populated large urban area
in the United States, despite its much
lower urban core densities relative to New
York. This creates an irony that the city
most associated with urban dispersion
(“urban sprawl”) in the United States is, in
reality, the most dispersed (least “sprawling”). At the same time, no urban area in the world sprawls over a
larger area than New York, as is indicated in Table 2.
Similarly, London and Athens have similar population densities. Yet, the core densities in Athens are
considerably higher than in London. The Athens suburbs, however, are among the least dense in the world.
The Essen-Dusseldorf and Milan urban areas have almost identical densities, yet core densities are
considerably higher in Milan.
Demographia World Urban Areas
defines the population and density of urban
footprints, regardless of their internal density profiles.
Urban Areas Contrasted with Metropolitan Areas
An urban area (built-up urban area or urban agglomeration) is fundamentally different from a metropolitan
area. A metropolitan area is a labor market. It includes a principal built-up urban area (the largest urban
area in the metropolitan area) as well as economically connected rural areas (and smaller urban areas) to
the outside. (Figure 4).
12Urban areas draw employees from a labor market area larger than the area of continuous development.
For example, INSEE, the census authority of France defines the Paris urban area ("unité urbaine") as 2,845
square kilometers and the Paris metropolitan area (aire urbaine) as 17,100 square kilometers, indicating
that more than 80 percent of the land area is outside the Paris urban area. Similarly, in the United States,
11
See: Wendell Cox, (2012), “The Evolving Urban Form: Dhaka,”
The New Geography
,
http://www.newgeography.com/content/003004-evolving-urban-form-dhaka.
12
the 52 metropolitan areas with more than 1,000,000 population had only 19 percent of land in urban use,
with the remainder of 81 percent being rural.
13Because of the fundamental differences between urban areas (or urban agglomerations) and metropolitan
areas, population comparisons should be made only within the two categories, not between.
Metropolitan Area Densities
Metropolitan area densities can be
calculated, but are of limited value and
can produce misleading results. This is
because there are no international
standards for delineating metropolitan
areas, rendering them non-comparable
(at best) between nations. Among the
least useful metropolitan areas for
density comparisons are those of the
United States, where counties are used
as the building blocks. The size of
counties in the United States varies up to
1,500 times and, as a result, metropolitan
densities are strongly influenced by the
densities of the rural areas surrounding
the built-up urban areas.. The most expansive metropolitan area in the United States is Riverside-San
Bernardino, at 27,300 square miles (71,000 square kilometers), is not much smaller than Austria. Most of
this area is well beyond commuting range, which means that it is not a genuine labor market. The situation
is similar, but not as extreme in some other metropolitan areas of the United States. Metropolitan area
densities in the United States therefore cannot even be validly compared even among themselves.
Further, it is incorrect to characterized metropolitan area densities as urban densities. Urban densities can
be calculated only using urban populations and excluding populations of rural areas. All metropolitan areas
have rural areas and thus metropolitan density is not a genuine measure of urban density.
Urban Areas and Urban Extents Contrasted
In some cases, urban areas have virtually grown together, yet are still considered separate urban areas.
This report confines urban areas to a single metropolitan area (below) or labor market area. Continuous
urbanization that extends beyond individual labor markets (metropolitan areas) can be called "urban
extents."
What constitutes a particular metropolitan area is a matter of judgment and there are no generally accepted
international principles for delineating metropolitan areas (unlike urban areas). However, it is necessary to
13
“draw a line,” especially where adjacent urban areas have “grown together,” but remain essentially distinct
labor markets. For example, the following urban extents are composed of more than one urban area:
•
The coast of Japan from Tokyo-Yokohama to Osaka-Kobe-Kyoto has nearly “grown together.”
Yet, this ribbon of urbanization is far too large to be a single metropolitan area (labor market)
and thus considered to be multiple urban areas (an urban extent).
•
The Pearl River Delta urban areas of Shenzhen, Dongguan, Zhongshan, Jiangmen, Huizhou,
Zhuhai, Guangzhou and Foshan in China’s Guangdong province are very close to one-another
and in some cases the built-up urban areas are virtually adjacent. Yet, this is not considered a
single urban area because there is not a single, unified labor market.
Demographia World
Urban Areas
considers Guangzhou and Foshan as a single urban area, because they have
become more economically integrated than the other urban areas (such as by Metro system
that serves both cities). Otherwise, each of the other urban areas in the Pearl River Delta
economic region is considered to be separate. The urban extent also includes Hong Kong.
However, there is a second reason that Hong Kong is not a part of a Pearl River Delta urban
area --- there is border control between Hong Kong and Shenzhen that does not permit the
free exchange of labor.
•
The Yangtze River Delta contains a number of nearby (though not always adjacent) urban
areas stretching from Ningbo Shanghai, and Nanjing. This includes Ningbo, Shaoxing,
Hangzhou, Jiaxing, Shanghai, Kunshan, Suzhou, Wuxi, Changzhou, Zhenjiang, Nanjing and
other smaller urban areas. Some sources consider this a single metropolitan area or even a
single built-up urban area. It is neither. The area is simply to be too large to be a single labor
market. Further, the Yangtze River Delta is not even a single urban extent, because there
considerable rural territory between some, breaking up the continuous urbanization. There is
rural territory between Ningbo and Shaoxing, Hangzhou and Jiaxing, Jiaxing and Shanghai,
Changzhou and Zhenjiang as well as between Zhenjiang and Nanjing. As a result, the Yangtze
Delta urban extent, at most, stretches from Shanghai to Changzhou. It is composed of multiple
metropolitan areas and thus multiple urban areas.
•
The same applies to the Northeastern "megalopolis" of the United States. The continuous
urban development that exists is has rural separations in some cases and each of the major
metropolitan areas represents a separate labor market. Thus nearly continuous urban areas of
the Northeast corridor are considered separate, including Hartford, New York, Philadelphia,
Baltimore and Washington.
International Urban Areas
Urban areas (and metropolitan areas) are confined to a single nation, unless there is virtual freedom of
movement (principally labor) between the adjacent nations. This is indicated by the lack of customs or
immigration facilities at borders, or the broad access to work permits for working in adjacent countries.
Currently, this condition is met only between some continental nations of the European Union. For
France and Germany as a single built-up urban area. Similarly, Milan together with Chiasso in Switzerland
is a single built-up urban area.
However, Detroit-Windsor El Paso-Ciudad Juarez and San Diego-Tijuana are not considered single urban
areas because of their border controls restricting the free movement of labor. As noted above, the
Shenzhen and Hong Kong urban areas, despite their adjacency, are also considered to separate because
of their international-style border controls.
Municipality (City or Commune)
An urban area is different from a municipality (also often called a city or a local government authority).
Municipalities have political boundaries that usually constitute only a part of the urban area. For example,
the city of Seoul represents less than one-half of the population (and a declining proportion) of the
Seoul-Incheon urban area, which extends well beyond the municipality. On the other hand, a municipality may be
considerably larger than an urban area and therefore contain considerable non-urban (or rural) territory.
Zaragoza, Spain is an example. A large part of the municipality of Mumbai is rural, composed of the Rajiv
Ghandi National Park and thus not included in the urban area.
The translated term "city" is generally used to denote sub-provincial (or in some cases provincial)
government areas in China. These would be more appropriately called “regions” and many were formerly
referred to as "prefectures." Generally, they extend far beyond their built-up areas (such as Beijing, Tianjin,
Wuhan and Guangzhou). The city of Chongqing, which has the largest population of any entity called a city
(municipality) in the world and stretches far beyond any reasonable definition of a metropolitan area. Like
the Riverside-San Bernardino metropolitan area, Chongqing covers a land area similar to that of Austria.
Most of the municipality is well beyond the commuting range of the urban area.
Combined Urban Areas
In the United States, single labor markets can be either metropolitan areas, or combined statistical areas
(CSAs), which are, in effect, larger metropolitan areas or metropolitan regions, with somewhat less
stringent economic interchanges (employment commuting).
14Where adjacent urban footprints exist (both in
CSAs and metropolitan areas), Demographia reports on combined built-up urban areas. For example, the
New York built-up urban area stretches from New York to other adjacent built-up urban areas, such as
Bridgeport-Stamford, New Haven, Trenton and other metropolitan areas.
In Canada, where the national census authority (Statistics Canada) defines metropolitan areas, the
Toronto, Hamilton and Oshawa metropolitan areas are also considered a single labor market and are
combined into a single combined urban area. While Canada does not designate combinations of
metropolitan areas, Statistics Canada has indicated that if criteria similar to that of the United States were
applied the Toronto, Hamilton and Oshawa metropolitan areas, they would constitute a combined
metropolitan area.
1514
Metropolitan areas require a 25 percent employment interchange between constituent counties (US metropolitan
areas are no longer based on central municipalities, but now use "central counties"). Combined statistical areas
require a 15 percent employment interchange between adjacent metropolitan areas.
15
Other adjacent urban areas are combined in nations that do not report built-up urban area data. For
example, Guangzhou and Foshan, and Tehran and Karaj are combined because of strong transport links
that make commuting feasible.
COMBINED URBAN AREAS
Designated only in Nations Reporting Urban Agglomeration Data
NATION
COMBINED URBAN AREA & Constituent Urban Areas (Source Code “N”)
Canada
TORONTO, ON: Hamilton, Oshawa, Toronto
United States
ATLANTA, GA: Atlanta, Gainesville, Winder
United States
BOSTON-PROVIDENCE, MA-RI-NH-CT-ME: Barnstable Town (MA), Dover (NH-ME), Boston (MA-NH-RI),
Leominster (MA), Manchester (NH) Nashua (NH-MA), New Bedford (MA), Portsmouth (NH-ME), Providence
(RI-MA), Worcester (MA-CT)
United States
CHICAGO, IL-IN-WI, Chicago, Kenosha (WI), Round Lake Beach
United States
DALLAS-FORT WORTH, TX: Dallas-Fort Worth, Denton, McKinney
United States
HOUSTON, TX: Houston, Conroe, Texas City
United States
LOS ANGELES, CA: Los Angeles, Riverside-San Bernardino, Mission Viejo
United States
NEW YORK, NY-NJ-CT-PA: Bridgeport (CT), Danbury (CT-NY), New Haven (CT), New York (NY-NJ-PA), Trenton
(NJ), Twin Rivers (NJ), Waterbury, CT
United States
ORLANDO, FL: Orlando, Kissimmee, Poinciana
United States
PHOENIX, AZ: Phoenix, Avondale, Buckeye
United States
RALEIGH, NC: Raleigh, Durham
United States
SALT LAKE CITY: Salt Lake City, Ogden, Provo
United States
SAN FRANCISCO-SAN JOSE, CA: San Francisco, Concord, Livermore, Napa, San Jose, Vallejo
United States
SEATTLE, WA: Seattle, Bremerton, Indianola, Marysville
A combined urban area consists of adjacent urban areas that are located within the same labor market area (U.S. Combined Statistical Area)
or equivalent).
5. SMALLER URBAN AREAS (LESS THAN 500,000 POPULATION)
Information is provided for some smaller urban areas. These urban areas are
not
representative of all
urban areas under 500,000. Smaller urban areas are shown (1) to indicate urban areas often shown by
international sources to be larger, (2) where national census authority data is produced for urban areas.
The first instance is relevant to China. The Chinese term "shi" is popularly translated as "city" in English.
Yet, "shi" does not denote urban. Chinese "shi" and equivalent terms are simply divisions of divisions of
provinces or province equivalent (formerly called “prefectures”). China is divided into more than 3,000 "shi,"
most of which are primarily rural (in land area), just as the United States is divided into more than 3,000
counties and France into more than 30,000 communes, with most of their respective land areas typically
being rural.
None of these divisions is inherently urban. Analysts often refer to Chinese "cities" of more than 1,000,000
population that have little urbanization. For example, Laibin is a "shi" in Guanxi, with more than 2 million
residents. The local authorities have designated an urban area of more than 900,000 population. Yet the
urbanization of Laibin is estimated at less than 100,000 residents.
6. GEOGRAPHICAL NOTES
Larger Geographical Areas
West Africa:
Demographia World Urban Areas
uses base population data (2010) from
Africapolis
, where
available (West Africa).
16Africapolis
uses various techniques, including an analysis of satellite photographs
to develop population estimates for built-up urban areas in West Africa. Moreover, the urban are definition
used by
Africapolis
is consistent with the general approach by Western European governments that define
built-up urban areas. The
Africapolis
data is particularly useful in West Africa, where most national
statistical authorities (like those of most nations) do not report urban agglomeration data.
Nigeria:
Unlike other nations of West Africa,
there have been strong criticisms of the Nigerian census for
decades, which makes the
Africapolis
built-up urban area data particularly important in Nigeria. For
example, the most recent federal census (2006) been severely criticized by local officials in Legos state as
having missed many people. The census indicated that Lagos metropolitan area population was
approximately 9 million. By comparison, a local census conducted at about the same time indicated a
population of 17.5 million. Authoritative neutral analysis generally finds lower population levels, more
consistent with data from the federal census.
17The detailed analysis by
Africapolis
is believed to be the
most accurate population estimates for the urban areas of Nigeria.
Democratic Republic of the Congo:
The government recently published provincial population estimates,
which made it possible to produce a far more reliable estimate for the Kinshasa urban area, which
constitutes nearly all of the population of Kinshasa province. Population estimates for other urban areas are
not considered reliable. The last census was more than 30 years ago (1981) and reasonably current urban
population estimates have not been identified.
Pakistan:
Population estimates are not considered reliable.
Census data were reported for Karachi for
2011 in the Indian press, but there is no indication of such results from the Pakistani census authorities. No
other data was reported. The last complete census was in 1998 and recent estimates have not been
identified. A national census is reported to be underway as of March 2017.
Specific Built-Up Urban Areas
The notes below notes identify
some
additional components that (1) might be thought to be separate, (2)
may be classified separate by statistical agencies or are (3) listed to indicate to better describe the
geography of an urban area. No attempt is made to otherwise provide an inventory of municipalities or
other entities in urban areas, because of their large numbers. For example, the Paris urban area has more
than 400 local government authorities. Thus, the lack of a municipality name does not indicate that it is not
included in an urban area.
16
Agencie Francaise de Develloppment,
Africapolis Urbanization Trends: 1950-2020: A Geo-statistical Approach
West Africa,´,
http://www.afd.fr/webdav/site/afd/shared/PUBLICATIONS/THEMATIQUES/autres-publications/BT/Africapolis_Final-Report_EN.pdf.
17
Built-up Urban Area or Geography
Notes
Aachen, Germany
Extends into the Netherlands; Includes Heerlen, Netherlands.
Abuja, Nigeria
Includes Kwamba
Amersfoort, Netherlands
Included in Utrecht.
Amman, Jordan
Includes Az-Zarqa.
Amsterdam, Netherlands
Includes Haarlem
Ansan, Korea
Included in Seoul-Incheon.
Atlanta, GA urban area, USA
Combined urban area. Includes Gainesville & Winder urban areas
Avondale, AZ urban area, USA
Included in Phoenix.
Bahadurgarh, Haryana, India
Included in Delhi.
Barnstable Town, MA urban area USA
Included in Boston-Providence
Basel, Switzerland
Extends into France and Germany
Bataysk, Russia
Included in Rostov.
Bhiwandi, Maharashtra, India
Included in Mumbai (beginning in 2016).
Bogor, Indonesia
Included in Jakarta
Boston-Providence, MA-RI-NH-CT-ME urban area,
USA
Combined urban area. Includes Barnstable Town (MA), Dover
(NH-ME), Boston (MA-NH-RI), Leominster (MA), Manchester (NH) Nashua
(NH-MA), New Bedford (MA), Portsmouth (NH-ME), & Providence
(RI-MA), Worcester (MA-CT) urban areas.
Brasilia, Brazil
Includes Luziana and Gama (GO)
Bremerton, WA urban area, USA
Included in Seattle
Bridgeport, CT urban area, USA
Included in New York.
Buckeye, AZ urban area, USA
Included in Phoenix.
Chanan (Shantou), GD, China
Included in Chaoyang
Changtai, FJ China
Included in Zhangzhou
Chaoyang (Shantou), GD, China
Includes Chaonan
Chiasso, Switzerland
Included in Milan, Italy (single labor market)
Chicago, IL-IN-WI urban area, USA
Combined urban area. Includes Chicago, Kenosha and Round Lake
Beach urban areas
Choloma, Honduras
Included in San Pedro Sula
Chungli, China: Taiwan
Included in Taipei.
Chuzhou, AN China
Includes Quanjiao
Ciudad Juarez, Mexico urban area
Not combined with El Paso: (International Border Controls: Not a labor
market)
Concord, CA urban area, USA
Included in San Francisco-San JOse
Conroe, TX urban area, USA
Included in Houston.
Dallas-Fort Worth, TX urban area, USA
Combined urban area. Includes Denton and McKinney urban areas
Danbury, CT urban area, USA
Included in New York.
Darwin, NT, Australia
Includes Palmerston.
Dashiqiao, LN China
Included in Yingkou
Daye, HUB, China
Included in Huangshui
Delhi, NCT, HA, UP, India
Includes Faridabad, Ghaziabad, Noida, Gurgaon and Bahadurgarh
urban areas and New Delhi.
Denton, TX, urban area USA
Included in Dallas-Fort Worth
Detroit, MI urban area, USA
Not combined with Windsor: (International Border Controls: Not a
labor market)
Dhaka, Bangladesh
Nayaranganj included.
Dongguan, Guangdong, China
2010 census population was well below previous local estimates
Dongyang, ZJ, China
Included in Yiwu (Jinhua)
Dover, NH-ME urban area, USA
Included in Boston-Providence
Dubai, UAE
Includes Sharja
Durham, NC urban area, USA
Included in Raleigh
El Pasa, TX urban area, USA
Not combined with Ciudad Juarez: (International Border Controls: Not
a labor market)
Ezhou, Hubei, China
Includes Huangzhou (Huanggang).
Faridabad, Haryana, India
Included in Delhi.
Foshan, Guangdong, China
Included in Guangzhou-Foshan
Francisco Morato, Sao Paulo, Brazil
Included in Sao Paulo
Fukuoka, Fukuoka, Japan
Shown as a separate urban area. Some sources combine Fukuoka
with Kitakyushu (such as the United Nations). The two urban areas
are not adjacent.
Fushun, LN China
Included in Shenyang
Gainesville, GA urban area, USA
Included in Atlanta
Gama, GO Brazil
Included in Brasilia
Geneva, Switzerland
Extends into France
Ghaziabad, Uttar Pradesh, India
Included in Delhi.
Guangzhou-Foshan, Guangdong, China
Includes Foshan
Gurgaon, Haryana, India
Included in Delhi.
Haarlem, Netherlands
Included in Amsterdam.
Hague, Netherlands
Included in Rotterdam-Hague
Hamilton, ON urban area, Canada
Included in Toronto.
Hebi, Henan, China
Includes Qi
Heerlen, Netherlands
Included in Aachen, Germany.
Helan, NX China
Included in Yinchuan
Himeji, Hyogo, Japan
Included in Osaka-Kobe-Kyoto.
Hitachi, Japan
Included in Mito.
Hong Kong, China
Not combined with Shenzhen: (Border Controls: Not a labor market)
Houston, TX urban area, USA
Combined urban area. Includes Conroe & Texas City
Huangmei (Huanggang), HUB
Included in Jiujiang, JX.
Huangshui, HUB
Includes Daye (county level city)
Huangzhou (Huanggang), Hubei, China
Included in Ezhou.
Hubli, West Bengal, India
Does not include Dharwad.
Huiyang qu (Huizhou), Guangdong, China
Included in Shenzhen.
Huizhou, Guangdong, China
Huicheng qu only
Incheon, South Korea
Included in Seoul-Incheon,
Indianola WA urban area, USA
Included in Seattle
Jakarta, Indonesia
Higher estimate than other sources (such as the United Nations),
which are largely limited to DKI Jakarta. Continuous urbanization
extends into Tangerang, South Tanerang, Borgor, Bekasi and
Karawang.
Jianbizhen (qu), China
Included in Zhenjiang, JS
Jiangyin (Wuxi), GD, China
Included in Zhangjiaggang (Suzhou) JS
Jianshan, HL China
Included in Shuangyashan
Jinjiang, Fuzhou, China
Included in Quanzhou.
Jiujiang, JX, China
Includes Huangmei (Huanggang), HUB.
Jixian, HL China
Included in Shuangyashan
Kalyan, Maharashtra, India
Included in Mumbai (beginning in 2016).
Kangbashi (Ordos), NM, China
Includes Ejin Horo
Karaj, Iran
Included in Tehran.
Karawang, Indonesia
Included in Jakarta
Kenosha, WI, USA
Included in Chicago.
Kissimmee, FL urban area, USA
Included in Orlando.
Kitakyushu, Fukuoka, Japan
Kuala Lumpur, Malaysia
The population is higher other agglomeration estimates (such as the
United Nations), which does not include all of the continuously
developed urban area. Includes Port Klang.
Kwamba, Nigeria
Included in Abuja
Lagos, Nigeria
Demographia uses the Africapolis estimate as the base. See
discussion above on Nigeria.
Leiden, Netherlands
Included in Rotterdam-Hague
Leon, Mexico
Includes Silao
Leonminster, MA urban area USA
Included in Boston-Providence
Lille, France
Extends into Belgium (single labor market)
Livermore, CA urban area, USA
Included in San Francisco-San Jose
Los Angeles, CA urban area, USA
Combined urban area. Includes Riverside-San Bernardino and
Mission Viejo urban areas
Luziana, GO Brazil
Included in Brasilia
Manchester, VT urban area, USA
Included in Boston-Providence
Manila, Philippines
Higher than other estimates, which are largely limited to the National
Capital Region. Continuous urbanization extends into Cavite, Laguna,
Bulucan and Rizal.
Maputo, Monzambique
Includes Matola.
Marysville, WA urban area, USA
Included in Seattle
McKinney, TX urban area, USA
Included in Dallas-Fort Worth.
Mersin, Turkey
Includes Tarsus
Miami, FL, USA
Includes the former urban areas of Fort Lauderdale and West Palm
Beach, which have been incorporated by the US Census Bureau.
Milan, Italy
The population is higher other agglomeration estimates (such as the
United Nations), which does not include all of the continuously
developed urban area, which stretches well into Como, Lecco and
Varese provinces. Extends into Switzerland (single labor market).
includes Chiasso, Switzerland.
Mission Viejo, CA urban area, USA
Included in Los Angeles.
Mito, Japan
Includes Hitachi
Moscow, Russia
Demographia is indebted to Richard Forstall, who has provided local
authority area population data for portions of Moscow Oblast within
the Moscow urban areas. Other estimates (such as the United Nations
estimate) largely limited to the municipality of Moscow,
Mumbai, Maharashtra, India
Includes Kalyan, and the Panvel urban area. As of 2016, also
includes the Census of India urban areas of Bhiwandi, Kalyan,
Vasai-Virar beginning in 2016.
Napa, CA urban area, USA
Included in San Francisco-San Jose
Nara, Nara, Japan
Included in Osaka-Kobe-Kyoto.
Nashua, NH urban area, USA
Included in Boston-Providence
Navi Mumbai, Maharashtra, India
Included in Mumbai.
Nayaranganj, Bangladesh
Included in Dhaka.
New Bedford, MA urban area USA
Included in Boston-Providence
New Delhi, NCT, India
Included in Delhi
New Haven, CT urban area, USA
Included in New York
New York, NY-NJ-CT urban area, USA
Combined urban area. Includes Bridgeport, New Haven, Trenton,
Danbury, Waterbury and Twin Rivers urban areas
Noida, Uttar Pradesh, India
Included in Delhi.
Ogden UT urban area, USA
Included in Salt Lake City
Ordos, NM, China
See (1) Dongsheng or (2) Kangbashi
Osaka-Kobe-Kyoto, Japan
Portions of the prefectures of Osaka, Kobe, Kyoto and Nara area
included. Includes Himeji. United Nations estimates separate
Osaka-Kobe and Kyoto and exclude both Nara and Himeji.
Oshawa, ON urban area, Canada
Included in Toronto.
Palmerston., NT, Australia
Included in Darwin
Panvel, Maharashtra, India
Included in Mumbai.
Phoenix, AZ area, USA
Combined urban area. Includes Avondale and Buckeye urban areas
Pinglu (Yuncheng) SAX China
Included in Sanmenxia
Poinciana, FL urban area, USA
Included in Orlando
Port Klang, Malaysia
Included in Kuala Lumpur.
Portsmouth, NH-ME urban area, USA
Included in Boston-Providence
Providence, RI-MA urban area, USA
Included in Boston-Providence
Provo, UT urban area, USA
Included in Salt Lake City
Qi, Henan, China
Included in Hebi
Quanjiao, AN China
Included in Chuzhou
Quanzhou, Fuzhou, China
Includes Shishi and Jinjiang
Qujing, YN China
Includes Zanyi
Raleigh, NC urban area, USA
Combined urban area. Includes Durham urban area.
Riverside-San Bernardino, CA urban area, USA
Included in Los Angeles.
Rostov, Russia
Includes Bataysk.
Rotterdam-Hague, Netherlands
Includes Leiden
Round Lake Beach, IL, USA
Included in Chicago.
Saarbrucken, Germany
Extends into France
Salt Lake City, UT
Combined urban area. Includes Ogden & Provo urban areas
Salzburg, Austria
Extends into Germany (single labor market)
San Diego, CA urban area, USA
Not combined with Tijuana: (International Border Controls: Not a labor
market)
San Francisco-San Jose, CA urban area, USA
Combined urban area. Includes San Jose, Concord, Livermore, Napa
and Vallejo urban areas.
San Jose, CA urban area, USA
Included in San Francisco-San Jose
San Pedro Sula, Honduras
Includes Choloma.
Sanmenxia, HEN China
Includes Pinglu (SAX)
Sao Paulo, Sao Paulo, Brazil
Includes Francisco Morato.
Seattle, WA urban area, USA
Combined urban area. Includes Bremerton, Indianola & Marysville.
Seoul-Incheon, Korea
Includes Suweon and Ansan.
Shanghai, China
Includes Taicang
Sharja, UAE
Included in Dubai.
Shenyang, LN China
Includes Fushun
Shenzhen, GD, China'
Not combined with Hong Kont: (Border Controls: Not a labor market)
Shenzhen, Guangdong, China
Includes Huiyang qu (Huizhou). 2010 census population was well
below previous local estimates.
Shishi (shi), Fuzhou, China
Included in Quanzhou.
Shuangyashan, HL China
Includes Jianshan & Jixian
Silao, Mexico
Included in Leon
Strausbourg, France
Extends into Germany (single labor market)
Stuttgart, Germany
Lower estimate than some other sources (such as the Millennium City
database)
Suweon, Korea
Included in Seoul-Incheon.
Taicang, China
Included in Shanghai.
Taipei, China: Taiwan
The population is higher than other estimates (such as the United
Nations), which do not include all population within the continuously
developed urban area (especially in Taipei County). Includes
continuous urbanization in New Taipei and Taoyuan.
Taoyuan, China: Taiwan
Included in Taipei.
Tarsus, Turkey
Included in Mersin
Tehran, Iran
Includes Karaj.
Texas City, TX urban area, USA
Included in Houston
Tijuana, Mexico urban area
Not combined with San Diego: (International Border Controls: Not a
labor market)
Tokyo-Yokohama, Japan
Includes large areas of Tokyo, Kanagawa, Chiba and Saitama
prefectures and smaller areas of Gunma, Tochigi and Ibaraki
prefectures.
Toronto, ON urban area, Canada
Combined urban area, Includes Hamilton and Oshawa
Trenton, NJ urban area, USA
Included in New York.
Twin Rivers, NJ urban area, USA
Included in New York.
Utrecht, Netherlands
Includes Amersfoort.
Vallejo, CA urban area, USA
Included in San Francisco-San Jose
Vasai-Virar, Maharashtra
Included in Mumbai (beginning in 2016).
Wenzhou, ZJ China
Includes Yueqing
Windsor, ON urban area, Canada
Not combined with Detroit: (International Border Controls: Not a labor
market)
Worcester, MA urban area, USA
Included in Boston-Providence
Xi'an, Shaanxi, China
Includes Xiangyang.
Xiangyang, Shaanxi, China
Incluced in Xi'an.
Xicheng, Ningxia, China
Included in Yinchuan.
Yanzhou, Jiangsu, China
Includes Jiangdu shi.
Yinchuan, Ningxia, China
Includes Henan, Xicheng and Yongning.
Yingkou, LN China
Includes Dashiqiao
Yiwu (Jinhua), ZJ China
Includes Dongyang.
Yongning, NX China
Included in Yinchuan
Yuciqu (Jinzhong), Shanxi, China
Included in Taiyuan.
Yueqing, ZJ China
Included in Wenzhou
Zanyi, YN China
Included in Qujing
Zhangjiaggang (Suzhou) JS China
Includes Jianyin
Zhangzhou, FJ China
Includes Changtai
Zhenjiang, Jiangsu, China
Includes Jianbizhen qu.
7. METHODOLOGY
The current year population estimate is modeled from the base year population, adjusted by population
projections. Most projections are from the United Nations.
National census authority population land area data is used where it is reported for urban areas.
18For other
urban areas, Demographia uses mapping software to estimate continuous urbanization. Demographia uses
small area population data, where available, to match population estimates to urban land area.
Sources for Base Population & Land Area Estimates
A base year population is provided for all urban areas. The base year estimate uses the methodology
indicated by the coding in the “Source: Population” column.
18
The tables indicate the method used to estimate both the land area and the base year population of each
built-up urban area. The following codes are used:
Source Codes: Population and Land Area
Code Source of Land Area or Base Year Population Estimate
A
National census authority built-up urban area data (land area or population).
B
Demographia l
and area estimate based upon map or satellite photograph analysis.
C
Demographia
population from lower order jurisdictions, with downward adjustment for rural population.
D
Population estimate based upon United Nations agglomeration estimate.
F
Other population estimate or other
Demographia
population estimate..
L
Same as category “C”, based on a local government population estimate.
N
Combined urban area using national census authority population or land area data
W
Africapolis
population or land area estimate
Presentation of Source Codes in Tables:
The source codes are listed in the “Pop:Area Source” column
following this form: “C:B”, where “C” indicates the source from which the base population was estimated
and “B” indicates the source of the land area estimate. In this example, the population base is estimated by
Demographia and the land area data is estimated by Demographia
.
Reliability
The most reliable sources are as follows:
•
National census authorities, where representative agglomeration data is available (such as in the
United States, the United Kingdom, Canada, France, Sweden, Norway, India and Australia).
•
Africapolis population and land area estimates (Source code W), which replicate the results that
would likely be obtained if census authorities in West Africa reported built-up urban area data.
•
Demographia population estimates.
Urban Density Calculation
Demographia World Urban Areas
provides average urban population density data. It is not possible to
reliably coordinate the dates of current population estimates with land area estimates, except in cases
where the built-up urban area population and land area are provided by national statistical authorities
(Source Code A:A).
8. CAUTION: TREND ANALYSIS
Demographia World Urban Areas
is a continuing project and attempts to provide “state of the art” data.
Revisions are made as more accurate satellite photographs and population estimates become available. As
a result,
Demographia World Urban Areas
is not intended for trend analysis.
Year-to-year changes indicated in population and land area may merely reflect better data that was not
available before and may not, therefore indicate a trend. Moreover, the current year population estimates
are nearly always a projection from a base year calculated from census or official estimate data. Changes
in population projection rates can result in substantial current year population estimates that are not related
to actual population growth or loss.
There is little or no historical urban area data and sources are continually improving. Moreover, nearly all of
the data is estimated. Appropriate caution is therefore advised.
9. COVER ILLUSTRATION: FARMGATE, DHAKA
Farmgate in Dhaka, Bangladesh (by author). Farmgate is an important urban transport interchange point in
the core Dhaka, the world’s densest large urban area (see Table 3). Dhaka’s density is so great that the
New York urban area, if as densely populated, would contain one-half billion (500,000,000) residents, more
that the combined population of the United States, Canada and Mexico. Paris would have 130,000,000
residents, approximately the same population as France and the United Kingdom combined. International
densification “model” Portland, Oregon (ranked in this edition as 963
rdin density out of 1,040) would have
60 million residents, approximately the population of the states of California and New York combined.
Surprisingly, there are claims that Dhaka is “sprawling:” (see
The Evolving Urban Form: Dhaka
at
http://www.newgeography.com/content/003004-evolving-urban-form-dhaka
).
10. COMMENTS AND SUGGESTIONS
Demographia wishes to produce the most accurate possible estimates. This edition incorporates changes
from suggestions that were deemed to be appropriate. Comments, suggestions, criticism and data are
welcomed.
[email protected]
Demographia
PO Box 841
Belleville, Illinois 62222 USA
(St. Louis, Missouri-Illinois Urban Area, USA)
+1.618.632.8507
Table 2
BUILT-UP URBAN AREAS BY LAND AREA (URBAN FOOTPRINT)
Urban Areas 500,000 & Over Population
Population Square Square Per Square Per Square Land Area Population Density
Source: Pop.Area Rank Geography Urban Area Estimate Miles Kilometers Mile Kilometer
1 United States New York, NY-NJ-CT 21,445,000 4,585 11,875 4,500 1,700 N:A 2 United States Boston-Providence, MA-RI-NH-CT-ME 7,265,000 3,548 9,189 2,000 800 N:A 3 Japan Tokyo-Yokohama 37,900,000 3,300 8,547 11,500 4,400 C:B 4 United States Atlanta, GA 5,240,000 2,817 7,296 1,700 600 N:A 5 United States Chicago, IL-IN-WI 9,140,000 2,647 6,856 3,400 1,300 N:A 6 United States Los Angeles, CA 15,500,000 2,432 6,299 6,000 2,300 N:A 7 Russia Moscow 16,710,000 2,200 5,698 7,600 2,900 C:B 8 U it d St t D ll F t W th TX 6 475 000 1 998 5 175 2 800 1 100 N A
(See Intro)
112 China Xi'an, SAA 5,740,000 420 1,088 13,700 5,300 L:B 113 United States Las Vegas, NV 2,095,000 417 1,080 4,500 1,700 A:A 114 Spain Barcelona 4,790,000 415 1,075 11,500 4,500 C:B 114 Uzbekistan Tashkent 2,280,000 415 1,075 5,500 2,100 D:B 116 United States Oklahoma City, OK 950,000 411 1,064 2,100 800 A:A 117 South Africa Durban 3,480,000 410 1,062 8,500 3,300 C:B 118 India Chennai, TN 10,265,000 400 1,036 25,700 9,900 A:B 118 United Arab Emirates Abu Dhabi 1,765,000 400 1,036 4,400 1,700 L:B C 120 Italy Naples 3,700,000 395 1,023 9,400 3,600 C:B 121 China Chongqing, CQ 7,990,000 390 1,010 20,500 7,900 L:B 121 Pakistan Karachi 23,545,000 390 1,010 60,400 23,300 C:B 123 Angola Luanda 7,250,000 380 984 19,100 7,400 C:B 123 Brazil Brasilia 3,240,000 380 984 8,500 3,300 C:B 123 Netherlands Rotterdam-Hague 2,670,000 380 984 7,000 2,700 C:B 123 United States Buffalo, NY 930,000 380 984 2,500 1,000 A:A 123 United States Columbia, SC 605,000 380 984 1,400 600 A:A 128 China Dalian LN 4 480 000 375 971 11 900 4 600 C:B 128 China Dalian, LN 4,480,000 375 971 11,900 4,600 C:B 128 Hungary Budapest 2,500,000 375 971 6,700 2,600 C:B 128 Sudan Khartoum 5,345,000 375 971 14,300 5,500 C:B 131 China Changzhou, JS 3,670,000 370 958 9,900 3,800 C:B 131 Mexico Monterrey 4,225,000 370 958 11,400 4,400 C:B 131 Portugal Lisbon 2,700,000 370 958 7,300 2,800 C:B 134 United States Baton Rouge, LA 605,000 367 951 1,600 600 A:A 135 Brazil Campinas 2,725,000 360 932 7,600 2,900 C:B 135 China Ningbo, ZJ 3,600,000 360 932 10,000 3,900 L:B 135 China Ningbo, ZJ 3,600,000 360 932 10,000 3,900 L:B 137 United States McAllen, TX 810,000 358 927 2,000 800 A:A 138 United States Tucson, AZ 870,000 353 914 2,400 900 A:A 139 United States Dayton, OH 725,000 351 909 2,100 800 A:A 140 China Linyi, SD 2,580,000 350 907 7,400 2,800 C:B 140 Nigeria Abuja 2,460,000 350 907 7,000 2,700 W:B 142 United States Springfield, MA-CT 630,000 349 904 1,800 700 A:A 143 United States Allentown, PA-NJ 680,000 346 896 1,900 700 A:A 144 Peru Lima 11,150,000 345 894 32,300 12,500 C:B 145 India Mumbai, MH 22,885,000 340 881 67,300 26,000 C:B 146 Canada Vancouver, BC 2,300,000 338 876 6,700 2,600 A:A 147 United States Tulsa, OK 705,000 336 870 1,900 800 A:A 148 Brazil Porto Alegre 3,460,000 335 868 10,300 4,000 C:B 148 Viet Nam Hanoi 7,785,000 335 868 23,200 9,000 C:B 150 Jordan Amman 4,995,000 330 855 15,100 5,800 C:B 150 United States Cape Coral, FL 630,000 330 855 1,600 600 A:A 152 Australia Adelaide, SA 1,160,000 329 852 3,400 1,300 A:A
S
170 Mexico Guadalajara 4,750,000 310 803 15,300 5,900 C:B 170 Ukraine Dnipropetrovsk 930,000 310 803 3,000 1,200 C:B 174 China Jinan, SD 3,840,000 305 790 12,600 4,900 L:B 175 Germany Cologne-Bonn 2,165,000 300 777 7,200 2,800 C:B 175 Germany Hamburg 2,105,000 300 777 7,000 2,700 C:B 175 Portugal Porto 1,485,000 300 777 5,000 1,900 C:B 175 Russia Novosibirsk 1,655,000 300 777 5,500 2,100 C:B 175 Sri Lanka Colombo 4,175,000 300 777 13,900 5,400 C:B
S Alb NY 296
227 Greece Athens 3,475,000 225 583 15,400 6,000 C:B 227 India Pune, MH 5,945,000 225 583 26,400 10,200 A:B 227 Qatar Doha 1,685,000 225 583 7,500 2,900 C:B 227 Saudi Arabia Khamis Mushayt 735,000 225 583 3,300 1,300 C:B 236 Canada Edmonton, AB 1,085,000 221 573 4,800 1,900 A:A 237 India Kannur, KL 2,285,000 220 570 10,400 4,000 A:B 237 Israel Tel Aviv 3,405,000 220 570 15,500 6,000 C:B 237 Viet Nam Hai Phong 1,150,000 220 570 5,200 2,000 D:B
C C
286 Russia Kazan 1,150,000 170 440 6,800 2,600 C:B 286 Russia Krasnoyarsk 1,010,000 170 440 5,900 2,300 C:B 286 Tunisia Tunis 2,260,000 170 440 13,300 5,100 C:B 286 United States Honolulu, HI 865,000 170 440 4,700 1,800 A:A 296 Canada Québec, QC 715,000 165 428 4,300 1,600 A:A 297 Belarus Minsk 1,990,000 165 427 12,100 4,700 C:B 297 Brazil Salvador 3,270,000 165 427 19,800 7,700 C:B 297 China Haikou, HA 2,155,000 165 427 13,100 5,000 C:B
S C
297 Dominican Republic Santo Domingo 3,725,000 165 427 22,600 8,700 C:B 297 Mexico Merida 1,035,000 165 427 6,300 2,400 C:B 297 Mexico Toluca 1,975,000 165 427 12,000 4,600 C:B 297 Pakistan Rawalpindi-Islamabad 2,670,000 165 427 16,200 6,200 D:B 304 United States Murrieta, CA 530,000 162 420 2,700 1,100 A:A 305 Costa Rica San Jose 1,740,000 160 414 10,900 4,200 C:B 305 Mali Bamako 3,280,000 160 414 20,500 7,900 W:B 305 Mozambique Maputo 2,695,000 160 414 16,800 6,500 C:B 305 Togo Lome 1 790 000 160 414 11 200 4 300 W:B 305 Togo Lome 1,790,000 160 414 11,200 4,300 W:B 305 Viet Nam Da Nang 1,010,000 160 414 6,300 2,400 D:B 310 Sweden Stockholm 1,565,000 160 414 9,500 3,700 A:A 311 China Yingkou, LN 1,630,000 159 412 10,300 4,000 C:B 311 Romania Bucharest 2,115,000 159 412 13,300 5,100 C:B 313 Venezuela Maracaibo 2,100,000 157 407 13,400 5,200 C:B 314 Russia Chelyabinsk 1,155,000 155 401 7,500 2,900 C:B 314 South Korea Busan 3,240,000 155 401 20,900 8,100 C:B 316 China Nantong, JS 1,150,000 153 396 7,500 2,900 C:B 316 China Nantong, JS 1,150,000 153 396 7,500 2,900 C:B 317 Ukraine Kharkov 1,590,000 152 394 10,500 4,000 C:B 318 Bahrain Al-Manamah 1,480,000 150 389 9,900 3,800 C:B 318 China Baoding, HEB 1,380,000 150 389 9,200 3,600 C:B 318 China Weifang, SD 1,705,000 150 389 11,400 4,400 C:B 318 Guatemala Guatemala City 2,450,000 150 389 16,300 6,300 C:B 318 Guinea Conakry 1,735,000 150 389 11,600 4,500 W:B 318 Saudi Arabia Mecca 1,720,000 150 389 11,500 4,400 C:B 318 South Africa Port Elizabeth 1,240,000 150 389 8,300 3,200 C:B 318 Spain Valencia 1,585,000 150 389 10,600 4,100 C:B 326 Armenia Yerevan 1,320,000 145 376 9,100 3,500 C:B 326 China Daqing, HL 1,540,000 145 376 10,600 4,100 C:B 326 Cote d'Ivoire Abidjan 4,980,000 145 376 34,300 13,300 W:B 326 Italy Turin 1,530,000 145 376 10,600 4,100 C:B 326 Russia Rostov 1,080,000 145 376 7,400 2,900 C:B 331 United Kingdom Glasgow 1,235,000 142 368 8,500 3,300 A:A 332 Bangladesh Dhaka 16,820,000 142 368 118,500 45,700 C:B
P i (Ji ) GD
350 India Ahmadabad, GJ 7,645,000 135 350 56,600 21,900 A:B 350 Iran Esfahan 2,480,000 135 350 18,400 7,100 C:B 354 Canada Winnipeg, MB 720,000 133 344 5,400 2,100 A:A 354 Japan Fuji 750,000 130 337 5,800 2,200 C:B 355 Argentina Mendoza 1,020,000 130 337 7,800 3,000 C:B 355 Brazil Manaus 1,975,000 130 337 15,200 5,900 C:B 355 Brazil Vittoria 1,205,000 130 337 9,300 3,600 C:B 355 China Bengbu, AH 930,000 130 337 7,200 2,800 C:B
P
410 China Jiaozuo, HEN 890,000 105 272 8,500 3,300 C:B 410 China Zhuhai, GD 1,620,000 105 272 15,400 6,000 C:B 410 Germany Aachen 545,000 105 272 5,200 2,000 C:B 410 Germany Bremen 635,000 105 272 6,000 2,300 C:B 410 Germany Dresden 740,000 105 272 7,000 2,700 C:B 410 India Indore, MP 2,535,000 105 272 24,100 9,300 A:B 410 India Nagpur, MH 2,755,000 105 272 26,200 10,100 A:B 410 Indonesia Semarang 1,670,000 105 272 15,900 6,100 D:B
S C
514 Oman Muscat 875,000 80 207 10,900 4,200 D:B 514 Pakistan Multan 2,005,000 80 207 25,100 9,700 D:B 514 Philippines Cebu 2,625,000 80 207 32,800 12,700 C:B 514 Saudi Arabia Buraydah 590,000 80 207 7,400 2,800 D:B 514 Spain Las Palmas 675,000 80 207 8,400 3,300 C:B 514 Turkey Bursa 1,940,000 80 207 24,300 9,400 C:B 538 Cameroon Douala 3,180,000 79 205 40,300 15,500 D:B 538 Turkey Mersin 1,370,000 79 205 17,300 6,700 C:B
C C
582 China Shangqiu, HEN 740,000 70 181 10,600 4,100 C:B 582 Congo Brazzaville 1,980,000 70 181 28,300 10,900 D:B 582 India Bhopal, MP 2,180,000 70 181 31,100 12,000 A:B 582 India Kollam, KL 1,490,000 70 181 21,300 8,200 A:B 582 Kazakhstan Astana 750,000 70 181 10,700 4,100 C:B 582 Kyrgyzstan Bishkek 870,000 70 181 12,400 4,800 D:B 582 Malaysia Kuching 740,000 70 181 10,600 4,100 C:B 582 Mexico Reynosa 625,000 70 181 8,900 3,400 C:B
L d
652 China Sanmenxia, HEN-SAX 710,000 61 158 11,600 4,500 C:B 652 Nigeria Port Harcourt 1,960,000 61 158 32,100 12,400 W:B 652 Russia Voronezh 905,000 61 158 14,800 5,700 C:B 655 Brazil Maringa 515,000 60 155 8,600 3,300 C:B 655 Chile Valparaíso-Vina del Mar 885,000 60 155 14,800 5,700 C:B 655 China Akesu, XJ 635,000 60 155 10,600 4,100 C:B 655 China Dandong, LN 820,000 60 155 13,700 5,300 C:B 655 China Hebi, HEN 565,000 60 155 9,400 3,600 C:B
C C