1
SUSTAINABLE COMPETITIVE ADVANTAGES TO
SOLVE
SOCIAL PROBLEM THROUGH SUSTAINABLE
VALUE CREATION IN INDONESIA
Maria Mia Kristanti1)
E-mail : [email protected] 1)
Widya Mandala Catholic University, Surabaya
ABSTRACT
Sustainable value creation is rare. Competitive forces, including innovation, drive returns toward the cost of capital. Organization should be careful about how much they pay for future value creation. Warren Buffett consistently emphasizes that he wants to buy businesses with prospects for sustainable value creation.
A clear understanding of how a company creates shareholder value is core to understanding sustainable value creation in Indonesia, which has minor priority in people-based economy, which should be emphasized on small-medium size organizations. Three broad sources of sustainable value creation is: production advantages, consumer advantages, and external advantages. Sustainable value creation has two dimensions: (1) the magnitude of returns in excess of the cost of capital that a company can generate. Magnitude considers not only the return on investment but also how much a company can invest at an above-cost-of-capital rate. Corporate growth only creates value when a company generates returns on investment that exceed the cost of capital; and (2) the second dimension is how long a company can earn returns in excess of the cost of capital. This concept is also known as sustainable competitive advantage period (SCAP).
Keywords: Sustainable Value Creation, People-Based Economy, Sustainable Competitive Advantage Period (SCAP).
ABSTRAKSI
2
Inti konsep Penciptaan Nilai yang Berkelanjutan terletak pada penciptaan nilai bagi shareholder. Hal ini berlaku untuk sistem ekonomi di Indonesia yang masih menomorduakan ekonomi rakyat, yang seharusnya berbasis pada organisasi berukuran menengah. Sumber Penciptaan Nilai Berkelanjutan adalah: keunggulan produksi, konsumen, dan relasi eksternal. Penciptaan Nilai ini memiliki dua dimensi: (1) tingkat pengembalian yang lebih besar dari biaya modal. Daya tarik ini tidak selalu berkaitan dengan ROI, namun cara investasi perusahaan sesuai biaya modalnya. Perusahaan hanya dapat berkembang, jika menghasilkan ROI lebih besar dari biaya modal, dan (2) dimensi kedua adalah seberapa lama perusahaan mampu menghasilkan pengembalian berlebih dari biaya modalnya. Konsep penting dalam Penciptaan Nilai ini disebut sebagai Periode Keunggulan Bersaing Berkelanjutan. Selain itu Keunggulan Bersaing Berkelanjutan juga memerlukan dukungan dari Keunggulan Pemasaran yang Berkelanjutan, yang dapat membawa UKM pada Keunggulan Global Berkelanjutan.
Kata Kunci: Keunggulan Bersaing Berkelanjutan, Penciptaan Nilai Berkelanjutan, Periode Keunggulan Bersaing Berkelanjutan, Keunggulan memerlukan langkah yang tidak biasa, dengan memprediksikan kondis bisnis
1. Harapan masyarakat luas untuk meraih peluang bisnis lintas
memimpin masyarakat luas keluar dari masalah sosial sekaligus menajamkan kapabilitasnya untuk menghasilkan profit di atas rata-rata pesaing. Mc Kinsey’s (Mc Kinsey’s, 2010) mengekslporasikan empat strategi yang di tujukan untuk hal ini, yaitu: 1. Sustainable value creation 2. Dual capitalism
3 4. Apakah Sustainable Value Creation berpengaruh terhadap Sustainable terdapat lima transformasi tren gobal
yang membentuk keseimbangan
lingkungan bisnis dan dampaknya terhadap pengentasan masalah sosial dari perspektif small-medium size organization di Negara berkembang seperti yang di illustrasikan pada lampiran 1, dengan penjelasan sebagai berikut:
1. Great Rebalancing
Kemajuan pesat ekonomi Negara Cina, India, Malaisya, Thailand dan Negara
berkembang yang lain telah
berkembang juga meningkat dua kali lebih besar dari 27 di tahun 2005 menjadi 58 di tahun 2009. Di kemukakan lebih lanjut bahwa, kebangkitan ekonomi Negara-negara menciptakan leap frog potensial dalam bidang teknologi. Hal ini berdampak terhadap pergeseran ekonomi dan daya
Kelangkaan tenaga kerja berbakat di
Negara berkembang telah
4 global bahan mentah seperti minyak, logam, kayu, dan lahan. Peningkatan penggunaan sumber daya alam namun di ikuti dengan semakin menipisnya sumber daya tersebut, akan berdampak pada efisiensi bisnis. Demikian pula halnya, dengan air, yang membuat
banyak Negara kurang dapat
5 perusahaan terlibat dalam isu sosial, yang akhirnya menimbulkan win-win dan program sosial. Dengan demikian, berbagai masalah sosial seperti kelangkaan tenaga kerja berbakat dan sumberdaya alam di ubah menjadi peluang. Hal ini juga membawa dampak perbaikan isu sosial antara perusahaan dan masyarakat, serta kondisi stagnan dan tidak konsisten, maka situasi ini di sebut sebagai masyarakat yang stagnan di sebabkan karena perbedaan standar aturan bisnis umumnya dan aturan perusahaan.
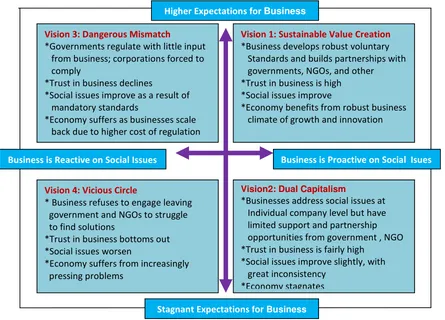
Jika harapan sosial masyarakat luas terhadap bisnis berkembang, sementara perusahaan bersikap reaktif daripada proaktif dalam menghadapi isu sosial, maka hal ini akan menempatkan perusahaan dalam situasi berbahaya. Dangerous mismatch, seperti yang di illustrasikan pada lampiran 2, di
sebabkan karena pemerintah
6
Status quo pada kuadran
dangerous-mismatch dan vicious-circle, selalu merespon terhadap isu sosial sama halnya dengan merespon masalah dalam perusahaan itu sendiri.
2.5.Memaksinalkan Profitabilitas dari Dampak Sosial
Penting sekali bagi perusahaan untuk dapat mengidentifikasi isu sosial strategis yang akan datang, sehingga dengan demikian perusahaan dapat yang berdampak positif terhadap isu
sosial, dapat menyelesaikan
ketegangan antara masyarakat dan tekanan bisnis secara simultan.
Pemilihan isu sosial dimana
perusahaan akan terlibat dapat di dasarkan pada relevansi antara bidang bisnis dan masalah sosial yang muncul.
2. Sustainable Competitive Period Variabel lain dalam penelitian ini periode keunggulan bersaing berkelanjutan, yang muncul dari karakteristik persaingan yang dapat mengendalikan ROI perusahaan melalui pemanfaatan biaya modal. Perusahaan yang dapat menghasilkan ROI tinggi akan menarik pesaing untuk bersedia bekerjasama, sehingga tingkat pengembalian yang berlaku di industri dapat dengan mudah di capai dan melebihi biaya modal yang di keluarkan. Dengan kata lain, sustainable value creation di perlukan untuk mampu mengangkat ROI perusahaan di atas rata-rata. Warren Buffet (Mc Kinsey’s, 2010) menyatakan bahwa perusahaan yang di pillihnya adalah yang memiliki kompetensi untuk mengentaskan masyarakat luas dari masalah sosial dengan disain strategi yang ditujukan untuk mencapai sustainable
competitive advantages. Lebih lanjut di
7
tidak pernah stabil, maka perhitungan terhadap sustainable competitive
period harus di lakukan, dan di
antisipasi serta di perpanjang melalui kontinuitas penciptaan sustainable berperan penting dalam bisnis, karena dengan demikian perusahaan memiliki di ciptakan dengan dasar pemikiran
pemenuhan value-added bagi
masyarakat luas dalam menyelesaikan masalah sosial. Dengan demikian, isu sosial dapat dapat di selesaikan lebih peluang bagi perusahaan skala kecil menengah sekalipun, untuk mampu berekspansi secara global. Pasar global menciptakan tingkat ROI yang lebih besar daripada pasar domestik, melalui lain, sustainable value creation juga melipatgandakan profitabilitas perusahaan melalui peran keterlibatan perusahaan sebagai problem-solver dalam masalah sosial.
III.METODE PENELITIAN
8
lingkupnya secara berturut-turut untuk masing-masing variabel adalah profit, diferensiasi, market leadership, dan customer retention, serta technological acquisition (Credit Suisse, 2002). Sumber data primer di ambil dari kuesioner, dan data sekunder untuk
UKM yang memenuhi kriteria
penelitian di gali dari internet.
IV.ANALISA DAN PEMBAHASAN
Dari berbagai hasil uji statistik seperti yang di illustrasikan pada lampiran 5 hingga lampiran 10 di buktikan bahwa:
Tabel 4.1
Pernyataan Mean Score Std.Deviation
SCA1 4,82 ,389
SCA2 4,91 ,290
SCA3 4,99 ,091
SCA4 4,94 ,235
SCA5 4,94 ,235
SVC1 4,93 ,264
SVC2 4,95 ,219
SVC3 4,99 ,091
SVC4 4,98 ,129
SVC5 4,97 ,222
SCP1 4,98 ,203
SCP2 4,99 ,091
SCP3 4,98 ,129
SCP4 4,97 ,222
SCP5 4,98 ,203
SMA1 4,98 ,203
SMA2 4,99 ,091
SMA3 4,98 ,203
SMA4 4,96 ,201
SMA5 4,96 ,201
SGA1 4,98 ,129
SGA2 4,97 ,222
SGA3 4,97 ,222
SGA4 4,96 ,239
SGA5 4,98 ,157
Sumber: Lampiran 8, diolah.
Rata-rata responden yang menjadi target penelitian ini menyatakan persetujuannya terhadap pernyataan yang di ajukan dalam instrument penelitian seperti yang terlampir pada lampiran 10. Mean-Score yang
9
Tabel 4.2.
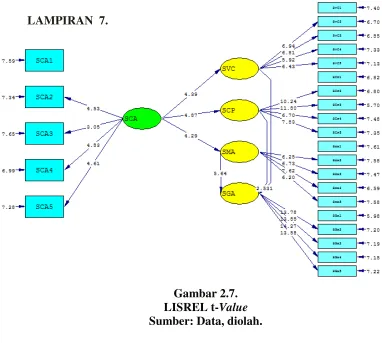
Variabel Laten Indikator Nilai t Cutt-off
Value
Indikator yang di gunakan pada penelitian ini tergolong valid, yang di tunjukkan dengan nilai t yang lebih besar dari cut-off value.
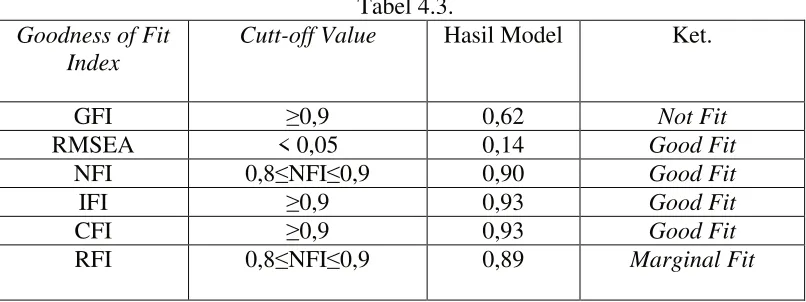
10 Berdasarkan tabel 4.3. tersebut di atas,
dapat di simpulkan bahwa model dalam penelitian ini termasuk Good Fit, yang berarti bahwa model penelitian ini memiliki kelayakan yang baik.
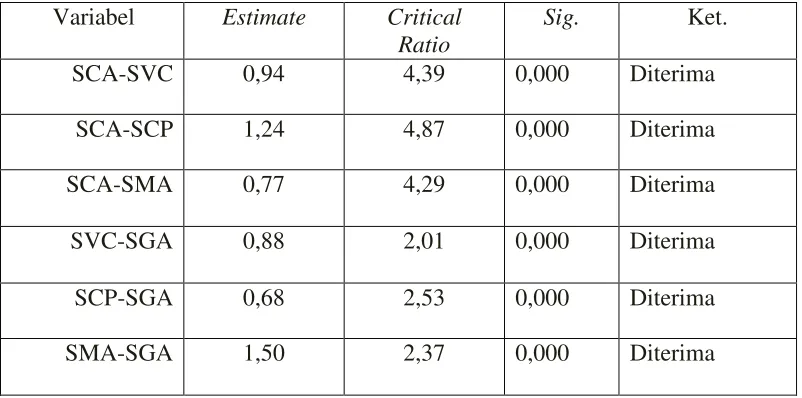
11 1. Sustainable Competitive
Advantages yang di miliki UKM perlu di tindaklanjuti dengan penciptaan Sustainable Value Creation.
2. Sustainable Competitive Advantages juga perlu memperhatikan adanya siklus Sustainable Competitive Period.
3. Selain itu, Sustainable Competitive Advantages tidak boleh mengesampingkan peran Sustainable Marketing Advantages.
4. Jika UKM sungguh-sungguh di manage untuk mengentaskan masalah sosial masyarakat luas dalam hal ekonomi, maka upaya untuk menciptakan Sustainable Competitive Advantages, Sustainable Value Creation, Sustainable Competitive Period ini, akan mampu membawa ekonomi rakyat yang berbasis UKM menjadi organisasi yang
memiliki daya saing dalam ruang lingkup global atau Sustainable Global Advantages, sehingga mampu bertahan dari gelombang krisis ekonomi karena kekuatan perusahaan global.
DAFTAR PUSTAKA
Credit Suisse, First Boston: Equity Research, Measuring The Moat: Assesing the Magnitude and Sustainability of Value Creation, America/Unites States Strategy, Investment Strategy, 16 Desember, 2002.
Mc Kinsey, Pathaway to Sustainable
Value Creation in 2020,
Committee Encouraging Corporate Philanthrophy, New York, 2010.
12 LAMPIRAN 1.
Gambar 2.1.
Five transformative trends pembentuk lingkungan bisnis Sumber: Mc Kinsey, 2010.
Great Rebalancing
*Emerging market gaining larger share of global GDP *Growth of multipolar economy
The Market State
Growing need of states to compete for economic growth and innovation
Competition to attract
Pricing the Planet
*Significant increase in resource demand as emerging markets surge *Growing environmental pressures on business and
Productivity Imperative
*Economic growth in developed
economies increasingly dependent on productivity gains
*Insufficient supply of highly trained talent for rising global demand
13 LAMPIRAN 2.
Gambar 2.2.
Four visions of business and society
Sumber: Mc Kinsey, 2010.
Vision 3: Dangerous Mismatch
*Governments regulate with little input from business; corporations forced to comply
*Trust in business declines
*Social issues improve as a result of mandatory standards
*Economy suffers as businesses scale back due to higher cost of regulation
Vision2: Dual Capitalism
*Businesses address social issues at Individual company level but have limited support and partnership opportunities from government , NGO *Trust in business is fairly high
*Social issues improve slightly, with great inconsistency
*Economy stagnates
Vision 4: Vicious Circle
* Business refuses to engage leaving government and NGOs to struggle to find solutions
*Trust in business bottoms out *Social issues worsen
*Economy suffers from increasingly pressing problems
Vision 1: Sustainable Value Creation
*Business develops robust voluntary Standards and builds partnerships with governments, NGOs, and other *Trust in business is high
*Social issues improve
*Economy benefits from robust business climate of growth and innovation
Business is Reactive on Social Issues Business is Proactive on Social Isues Higher Expectations for Business
14 LAMPIRAN 3.
Gambar 2.3.
Issue ripeness, a tool for picking where to get involved
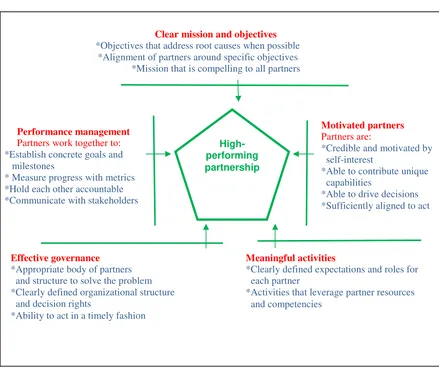
15 LAMPIRAN 4.
Clear mission and objectives
*Objectives that address root causes when possible *Alignment of partners around specific objectives *Mission that is compelling to all partners
Performance management
Partners work together to:
*Establish concrete goals and milestones
* Measure progress with metrics *Hold each other accountable *Communicate with stakeholders
Gambar 2.4.
Requirements for successful collaboration
Sumber: Mc Kinsey, 2010.
High-performing partnership
Motivated partners Partners are:
*Credible and motivated by self-interest
*Able to contribute unique capabilities
*Able to drive decisions *Sufficiently aligned to act
Effective governance
*Appropriate body of partners and structure to solve the problem *Clearly defined organizational structure and decision rights
*Ability to act in a timely fashion
Meaningful activities
*Clearly defined expectations and roles for each partner
19 Gambar 2.7.
LISREL t-Value
Sumber: Data, diolah.
20
LAMPIRAN 8.
Descriptives
Descriptive Statistics
N
Minimu m
Maximu
m Mean
Std. Deviation
SCA1 120 4 5 4,82 ,389
SCA2 120 4 5 4,91 ,290
SCA3 120 4 5 4,99 ,091
SCA4 120 4 5 4,94 ,235
SCA5 120 4 5 4,94 ,235
SVC1 120 4 5 4,93 ,264
SVC2 120 4 5 4,95 ,219
SVC3 120 4 5 4,99 ,091
SVC4 120 4 5 4,98 ,129
SVC5 120 3 5 4,97 ,222
SCP1 120 3 5 4,98 ,203
SCP2 120 4 5 4,99 ,091
SCP3 120 4 5 4,98 ,129
SCP4 120 3 5 4,97 ,222
SCP5 120 3 5 4,98 ,203
SMA1 120 3 5 4,98 ,203
SMA2 120 4 5 4,99 ,091
SMA3 120 3 5 4,98 ,203
SMA4 120 4 5 4,96 ,201
SMA5 120 4 5 4,96 ,201
SGA1 120 4 5 4,98 ,129
SGA2 120 3 5 4,97 ,222
SGA3 120 3 5 4,97 ,222
SGA4 120 3 5 4,96 ,239
SGA5 120 4 5 4,98 ,157
Valid N
(listwise) 120
Frequencies Frequency Table
SCA1
22 18,3 18,3 18,3
98 81,7 81,7 100,0
120 100,0 100,0
4 5 Total Valid
Frequency Percent Valid Percent
29
30
Predictors: (Constant), SMA5, SMA2, SCP2, SVC3, SCA3, SMA3, SMA1, SCP3, SCA2, SCP4, SVC5, SCA5, SVC2, SCA4, SCA1, SMA4, SCP5, SVC1, SCP1
a.
31
32
Excluded Variablesb
.a . . . ,000
SVC4 Model
1
Beta In t Sig.
Partial
Correlation Tolerance
Collinearity Statistics
Predictors in the Model: (Constant), SMA5, SMA2, SCP2, SVC3, SCA3, SMA3, SMA1, SCP3, SCA2, SCP4, SVC5, SCA5, SVC2, SCA4, SCA1, SMA4, SCP5, SVC1, SCP1
a.
Dependent Variable: SGA b.
Residuals Statisticsa
4,19 5,10 4,98 ,112 120
-,273 ,379 ,000 ,063 120
-7,032 1,002 ,000 1,000 120
-3,998 5,547 ,000 ,917 120
Predicted Value Residual
Std. Predicted Value Std. Residual
Minimum Maximum Mean Std. Deviation N
33
LAMPIRAN 9.
L I S R E L 8.70
BY
Karl G. Jöreskog & Dag Sörbom
This program is published exclusively by Scientific Software International, Inc.
7383 N. Lincoln Avenue, Suite 100 Lincolnwood, IL 60712, U.S.A.
Phone: (800)247-6113, (847)675-0720, Fax: (847)675-2140 Copyright by Scientific Software International, Inc., 1981-2004
Use of this program is subject to the terms specified in the Universal Copyright Convention.
Website: www.ssicentral.com
The following lines were read from file C:\Documents and Settings\Maria\My Documents\TY.spl:
PENGARUH SCATERHADAP SGA MELALUI SVC SCP DAN SMA
OBSERVED VARIABLE SCA1 SCA2 SCA3 SCA4 SCA5 SVC1 SVC2 SVC3 SVC4 SVC5 SCP1 SCP2 SCP3 SCP4 SCP5 SMA1 SMA2 SMA3 SMA4 SMA5 SGA1 SGA2 SGA3 SGA4 SGA5
COVARIANCE MATRIX FROM FILE C:\DATA9.COV SAMPLE SIZE 120
LATENT VARIABLE SCA SVC SCP SMA SGA RELATIONSHIPS:
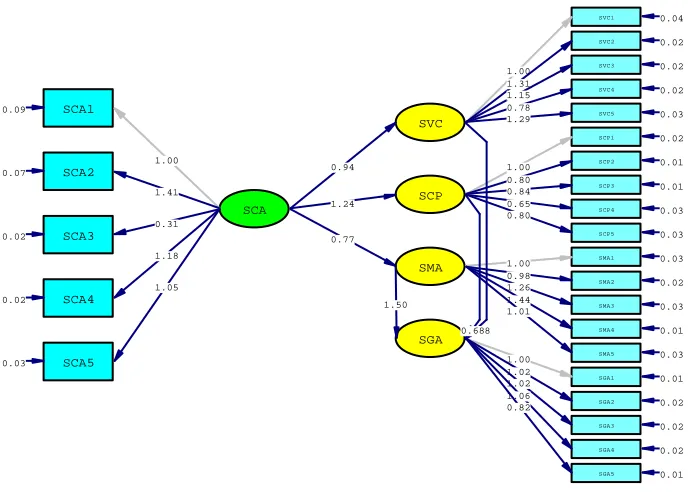
SCA1 = 1*SCA SCA2-SCA5 = SCA SVC1 = 1*SVC SVC2-SVC5 = SVC SCP1 = 1*SCP SCP2-SCP5 = SCP SMA1 = 1*SMA SMA2-SMA5 = SMA SGA1 = 1*SGA SGA2-SGA5 = SGA SVC SCP SMA = SCA SGA = SVC SCP SMA OPTIONS: SS SC EF RS PATH DIAGRAM END OF PROGRAM
34
PENGARUH SCATERHADAP SGA MELALUI SVC SCP DAN SMA
Covariance Matrix
SVC1 SVC2 SVC3 SVC4 SVC5 SCP1 --- --- --- --- --- --- SVC1 0.06
SVC2 0.04 0.06
SVC3 0.02 0.03 0.05
SVC4 0.01 0.02 0.02 0.03
SVC5 0.02 0.03 0.03 0.02 0.07
SCP1 0.02 0.04 0.04 0.02 0.04 0.06 SCP2 0.02 0.03 0.03 0.02 0.03 0.03 SCP3 0.02 0.03 0.03 0.02 0.03 0.03 SCP4 0.02 0.02 0.02 0.01 0.02 0.03 SCP5 0.02 0.03 0.03 0.02 0.03 0.04 SMA1 0.01 0.02 0.02 0.02 0.03 0.03 SMA2 0.02 0.03 0.03 0.02 0.03 0.03 SMA3 0.01 0.03 0.03 0.02 0.03 0.04 SMA4 0.01 0.02 0.03 0.02 0.03 0.03 SMA5 0.01 0.02 0.02 0.01 0.02 0.03 SGA1 0.02 0.03 0.03 0.02 0.04 0.04 SGA2 0.02 0.03 0.04 0.02 0.03 0.04 SGA3 0.02 0.03 0.03 0.02 0.04 0.04 SGA4 0.02 0.03 0.03 0.02 0.04 0.05 SGA5 0.01 0.02 0.02 0.02 0.03 0.03 SCA1 0.04 0.04 0.01 0.01 0.02 0.02 SCA2 0.04 0.04 0.03 0.02 0.04 0.04 SCA3 0.01 0.01 0.00 0.00 0.01 0.01 SCA4 0.04 0.04 0.03 0.02 0.03 0.03 SCA5 0.03 0.03 0.02 0.01 0.03 0.03
Covariance Matrix
SCP2 SCP3 SCP4 SCP5 SMA1 SMA2 --- --- --- --- --- ---
SCP2 0.04
SCP3 0.03 0.03
SCP4 0.02 0.02 0.05
SCP5 0.02 0.02 0.02 0.06
SMA1 0.02 0.02 0.02 0.02 0.05
35 SGA2 0.03 0.03 0.03 0.03 0.03 0.03
SGA3 0.03 0.03 0.03 0.03 0.03 0.03 SGA4 0.03 0.03 0.02 0.04 0.03 0.03 SGA5 0.02 0.03 0.02 0.02 0.03 0.02 SCA1 0.01 0.02 0.02 0.01 0.01 0.01 SCA2 0.03 0.03 0.02 0.03 0.02 0.03 SCA3 0.00 0.01 0.01 0.01 0.00 0.01 SCA4 0.03 0.03 0.02 0.02 0.01 0.02 SCA5 0.02 0.02 0.02 0.02 0.02 0.02
Covariance Matrix
SMA3 SMA4 SMA5 SGA1 SGA2 SGA3 --- --- --- --- --- ---
SMA3 0.06
SMA4 0.03 0.05
SMA5 0.02 0.03 0.05
SGA1 0.04 0.04 0.03 0.05
SGA2 0.04 0.04 0.03 0.04 0.06
SGA3 0.04 0.05 0.03 0.04 0.05 0.06 SGA4 0.05 0.04 0.03 0.04 0.06 0.05 SGA5 0.03 0.04 0.02 0.04 0.04 0.04 SCA1 0.01 0.02 0.01 0.03 0.02 0.02 SCA2 0.03 0.04 0.02 0.04 0.03 0.04 SCA3 0.01 0.01 0.01 0.01 0.01 0.01 SCA4 0.02 0.02 0.02 0.03 0.02 0.03 SCA5 0.03 0.03 0.02 0.03 0.03 0.03
Covariance Matrix
SGA4 SGA5 SCA1 SCA2 SCA3 SCA4 --- --- --- --- --- ---
SGA4 0.07
SGA5 0.04 0.04
SCA1 0.02 0.02 0.12
SCA2 0.04 0.03 0.08 0.11
SCA3 0.01 0.01 0.01 0.01 0.02
SCA4 0.03 0.02 0.04 0.04 0.01 0.06 SCA5 0.03 0.02 0.04 0.04 0.01 0.04
Covariance Matrix
36
PENGARUH SCATERHADAP SGA MELALUI SVC SCP DAN SMA Number of Iterations = 40
LISREL Estimates (Maximum Likelihood) Measurement Equations
SVC1 = 1.00*SVC, Errorvar.= 0.036 , R² = 0.37 (0.0049)
7.40
SVC2 = 1.31*SVC, Errorvar.= 0.021 , R² = 0.64 (0.19) (0.0031)
6.94 6.70
SVC3 = 1.15*SVC, Errorvar.= 0.018 , R² = 0.60 (0.17) (0.0027)
6.81 6.85
SVC4 = 0.78*SVC, Errorvar.= 0.018 , R² = 0.41 (0.13) (0.0025)
5.92 7.33
SVC5 = 1.29*SVC, Errorvar.= 0.033 , R² = 0.51 (0.20) (0.0047)
6.43 7.13
SCP1 = 1.00*SCP, Errorvar.= 0.021 , R² = 0.65 (0.0031)
6.82
SCP2 = 0.80*SCP, Errorvar.= 0.013 , R² = 0.66 (0.078) (0.0020)
10.24 6.80
SCP3 = 0.84*SCP, Errorvar.= 0.0071 , R² = 0.80 (0.071) (0.0012)
11.80 5.70
SCP4 = 0.65*SCP, Errorvar.= 0.033 , R² = 0.34 (0.098) (0.0045)
6.70 7.48
SCP5 = 0.80*SCP, Errorvar.= 0.032 , R² = 0.44 (0.10) (0.0044)
37 SMA1 = 1.00*SMA, Errorvar.= 0.032 , R² = 0.37
(0.0041) 7.61
SMA2 = 0.98*SMA, Errorvar.= 0.024 , R² = 0.43 (0.16) (0.0032)
6.25 7.58
SMA3 = 1.26*SMA, Errorvar.= 0.028 , R² = 0.52 (0.19) (0.0037)
6.73 7.47
SMA4 = 1.44*SMA, Errorvar.= 0.014 , R² = 0.74 (0.19) (0.0021)
7.62 6.59
SMA5 = 1.01*SMA, Errorvar.= 0.027 , R² = 0.42 (0.16) (0.0035)
6.20 7.58
SGA1 = 1.00*SGA, Errorvar.= 0.0063 , R² = 0.87 (0.0011)
5.98
SGA2 = 1.02*SGA, Errorvar.= 0.020 , R² = 0.69 (0.074) (0.0028)
13.78 7.20
SGA3 = 1.02*SGA, Errorvar.= 0.020 , R² = 0.69 (0.074) (0.0027)
13.85 7.19
SGA4 = 1.06*SGA, Errorvar.= 0.020 , R² = 0.71 (0.074) (0.0027)
14.27 7.15
SGA5 = 0.82*SGA, Errorvar.= 0.013 , R² = 0.68 (0.060) (0.0018)
13.58 7.22
SCA1 = 1.00*SCA, Errorvar.= 0.095 , R² = 0.20 (0.013)
7.59
38 SCA2 = 1.41*SCA, Errorvar.= 0.065 , R² = 0.42
(0.31) (0.0089) 4.53 7.34
SCA3 = 0.31*SCA, Errorvar.= 0.018 , R² = 0.11 (0.10) (0.0023)
3.05 7.65
SCA4 = 1.18*SCA, Errorvar.= 0.024 , R² = 0.58 (0.24) (0.0034)
4.83 6.99
SCA5 = 1.05*SCA, Errorvar.= 0.031 , R² = 0.45 (0.23) (0.0043)
4.61 7.28
Structural Equations
SVC = 0.94*SCA, Errorvar.= 0.00014 , R² = 0.99 (0.21) (0.00057)
4.39 0.25
SCP = 1.24*SCA, Errorvar.= 0.0036 , R² = 0.91 (0.26) (0.0016)
4.87 2.20
SMA = 0.77*SCA, Errorvar.= 0.0051 , R² = 0.73 (0.18) (0.0017)
4.29 3.01
SGA = 0.88*SVC + 0.68*SCP + 1.50*SMA, Errorvar.= 0.0034 , R² = 1.08 (0.44) (0.27) (0.27) (0.0014)
2.01 2.53 5.64 2.37
Reduced Form Equations
SVC = 0.94*SCA, Errorvar.= 0.00014, R² = 0.99 (0.21)
4.39
SCP = 1.24*SCA, Errorvar.= 0.0036, R² = 0.91 (0.26)
4.87
SMA = 0.77*SCA, Errorvar.= 0.0051, R² = 0.73 (0.18)
39
SGA = 1.17*SCA, Errorvar.= 0.0098, R² = 0.77 (0.24)
4.95
Variances of Independent Variables SCA
--- 0.02 (0.01) 2.49
Covariance Matrix of Latent Variables
SVC SCP SMA SGA SCA --- --- --- --- ---
SVC 0.02
SCP 0.03 0.04
SMA 0.02 0.02 0.02
SGA 0.03 0.04 0.03 0.04
SCA 0.02 0.03 0.02 0.03 0.02
Goodness of Fit Statistics
Degrees of Freedom = 269
Minimum Fit Function Chi-Square = 915.13 (P = 0.0)
Normal Theory Weighted Least Squares Chi-Square = 893.72 (P = 0.0) Estimated Non-centrality Parameter (NCP) = 624.72
90 Percent Confidence Interval for NCP = (537.84 ; 719.20)
Minimum Fit Function Value = 7.69
Population Discrepancy Function Value (F0) = 5.25 90 Percent Confidence Interval for F0 = (4.52 ; 6.04)
Root Mean Square Error of Approximation (RMSEA) = 0.14 90 Percent Confidence Interval for RMSEA = (0.13 ; 0.15) P-Value for Test of Close Fit (RMSEA < 0.05) = 0.00
Expected Cross-Validation Index (ECVI) = 8.45
90 Percent Confidence Interval for ECVI = (7.72 ; 9.25) ECVI for Saturated Model = 5.46
ECVI for Independence Model = 75.73
Chi-Square for Independence Model with 300 Degrees of Freedom = 8961.80 Independence AIC = 9011.80
Model AIC = 1005.72 Saturated AIC = 650.00
40 Model CAIC = 1217.82
Saturated CAIC = 1880.93
Normed Fit Index (NFI) = 0.90
Non-Normed Fit Index (NNFI) = 0.92 Parsimony Normed Fit Index (PNFI) = 0.81 Comparative Fit Index (CFI) = 0.93
Incremental Fit Index (IFI) = 0.93 Relative Fit Index (RFI) = 0.89
Critical N (CN) = 43.38
Root Mean Square Residual (RMR) = 0.0053 Standardized RMR = 0.088
Goodness of Fit Index (GFI) = 0.6
Adjusted Goodness of Fit Index (AGFI) = 0.55 Parsimony Goodness of Fit Index (PGFI) = 0.52
PENGARUH SCATERHADAP SGA MELALUI SVC SCP DAN SMA Fitted Covariance Matrix
SVC1 SVC2 SVC3 SVC4 SVC5 SCP1 --- --- --- --- --- ---
SVC1 0.06
SVC2 0.03 0.06
SVC3 0.02 0.03 0.05
SVC4 0.02 0.02 0.02 0.03
SVC5 0.03 0.04 0.03 0.02 0.07
41 SCA4 0.03 0.03 0.03 0.02 0.03 0.03
SCA5 0.02 0.03 0.03 0.02 0.03 0.03
Fitted Covariance Matrix
SCP2 SCP3 SCP4 SCP5 SMA1 SMA2 --- --- --- --- --- ---
SCP2 0.04
SCP3 0.03 0.03
SCP4 0.02 0.02 0.05
SCP5 0.03 0.03 0.02 0.06
SMA1 0.02 0.02 0.01 0.02 0.05
SMA2 0.02 0.02 0.01 0.02 0.02 0.04 SMA3 0.02 0.02 0.02 0.02 0.02 0.02 SMA4 0.03 0.03 0.02 0.03 0.03 0.03 SMA5 0.02 0.02 0.01 0.02 0.02 0.02 SGA1 0.03 0.03 0.02 0.03 0.03 0.03 SGA2 0.03 0.03 0.02 0.03 0.03 0.03 SGA3 0.03 0.03 0.02 0.03 0.03 0.03 SGA4 0.03 0.03 0.03 0.03 0.03 0.03 SGA5 0.02 0.03 0.02 0.02 0.02 0.02 SCA1 0.02 0.02 0.02 0.02 0.02 0.02 SCA2 0.03 0.03 0.03 0.03 0.03 0.02 SCA3 0.01 0.01 0.01 0.01 0.01 0.01 SCA4 0.03 0.03 0.02 0.03 0.02 0.02 SCA5 0.02 0.03 0.02 0.02 0.02 0.02
Fitted Covariance Matrix
SMA3 SMA4 SMA5 SGA1 SGA2 SGA3 --- --- --- --- --- ---
SMA3 0.06
SMA4 0.03 0.05
SMA5 0.02 0.03 0.05
SGA1 0.04 0.04 0.03 0.05
SGA2 0.04 0.04 0.03 0.04 0.06
42 Fitted Covariance Matrix
SGA4 SGA5 SCA1 SCA2 SCA3 SCA4 --- --- --- --- --- ---
SGA4 0.07
SGA5 0.04 0.04
SCA1 0.03 0.02 0.12
SCA2 0.04 0.03 0.03 0.11
SCA3 0.01 0.01 0.01 0.01 0.02
SCA4 0.03 0.03 0.03 0.04 0.01 0.06 SCA5 0.03 0.02 0.02 0.03 0.01 0.03
Fitted Covariance Matrix
SCA5 --- SCA5 0.06
Fitted Residuals
SVC1 SVC2 SVC3 SVC4 SVC5 SCP1 --- --- --- --- --- ---
SVC1 0.00
SVC2 0.01 0.00
SVC3 0.00 0.00 0.00
SVC4 -0.01 0.00 0.00 0.00
SVC5 -0.01 0.00 0.00 0.00 0.00
43 Fitted Residuals
SCP2 SCP3 SCP4 SCP5 SMA1 SMA2 --- --- --- --- --- ---
SCP2 0.00
SCP3 0.00 0.00
SCP4 0.00 0.00 0.00
SCP5 0.00 0.00 0.00 0.00
SMA1 0.01 0.01 0.01 0.00 0.00
SMA2 0.00 0.00 0.01 0.01 0.00 0.00 SMA3 0.01 0.00 0.01 0.01 0.00 0.00 SMA4 0.00 0.00 0.00 0.00 0.01 0.00 SMA5 0.00 0.00 0.01 0.00 0.00 0.00 SGA1 0.00 0.00 0.00 0.00 0.00 0.00 SGA2 0.00 0.00 0.00 0.00 0.00 0.00 SGA3 0.00 0.00 0.00 0.00 0.00 0.00 SGA4 0.00 0.00 0.00 0.01 0.00 0.00 SGA5 0.00 0.00 0.00 0.00 0.00 0.00 SCA1 -0.01 -0.01 0.00 -0.01 -0.01 0.00 SCA2 0.00 0.00 0.00 -0.01 0.00 0.00 SCA3 0.00 0.00 0.00 0.00 0.00 0.00 SCA4 0.00 0.00 0.00 0.00 -0.01 0.00 SCA5 0.00 0.00 0.00 -0.01 0.00 0.00
Fitted Residuals
SMA3 SMA4 SMA5 SGA1 SGA2 SGA3 --- --- --- --- --- ---
SMA3 0.00
SMA4 0.00 0.00
SMA5 0.00 0.00 0.00
SGA1 0.00 0.00 0.00 0.00
SGA2 0.01 0.00 0.00 0.00 0.00
44 Fitted Residuals
SGA4 SGA5 SCA1 SCA2 SCA3 SCA4 --- --- --- --- --- ---
SGA4 0.00
SGA5 0.00 0.00
SCA1 -0.01 0.00 0.00
SCA2 0.00 0.00 0.04 0.00
SCA3 0.00 0.00 0.01 0.00 0.00
SCA4 -0.01 -0.01 0.02 0.01 0.00 0.00 SCA5 0.00 0.00 0.01 0.01 0.00 0.01
Fitted Residuals
SCA5 --- SCA5 0.00
Summary Statistics for Fitted Residuals
Smallest Fitted Residual = -0.01 Median Fitted Residual = 0.00 Largest Fitted Residual = 0.04
Stemleaf Plot
- 1|222111000
- 0|99999988887777766666665555555555555555 -
0|4444444444444444444333333333333333333332222222222222222222222222 22211111+70
0|1111111111111111111111111122222222222222222222222333333333333333 33333333+15
0|5555555555555566666666677777777899 1|0000011122
1|5568 2| 2| 3| 3| 4|2
45 Standardized Residuals
SVC1 SVC2 SVC3 SVC4 SVC5 SCP1 --- --- --- --- --- ---
SVC1 - -
SVC2 4.08 - -
SVC3 -1.30 -1.54 - -
SVC4 -2.76 -2.05 2.51 - -
SVC5 -1.88 -0.66 -0.19 -0.98 - -
SCP1 -2.03 -0.55 2.26 1.27 0.49 - - SCP2 -0.09 0.64 3.51 3.93 1.48 0.07 SCP3 -3.31 -3.82 3.90 4.69 1.27 -1.47 SCP4 0.37 -0.03 1.47 -1.03 0.46 -0.35 SCP5 -1.11 -0.74 1.07 1.21 -0.02 5.35 SMA1 -0.62 -1.07 1.74 1.13 2.13 0.94 SMA2 0.30 1.49 2.99 2.61 1.75 3.57 SMA3 -2.16 -0.38 1.22 1.32 1.57 5.11 SMA4 -4.43 -3.59 -1.36 -0.39 1.13 -0.56 SMA5 -1.21 -0.46 -0.75 -1.22 -1.27 1.59 SGA1 -2.29 -0.47 2.92 1.63 2.92 2.11 SGA2 -2.90 -3.57 2.37 1.44 -0.73 2.27 SGA3 -2.93 -1.79 0.40 1.42 0.79 -0.09 SGA4 -3.37 -2.53 -0.30 0.92 0.17 3.39 SGA5 -4.80 -3.23 -1.23 3.60 -0.21 -1.34 SCA1 3.46 1.85 -3.30 -2.58 -1.60 -2.71 SCA2 1.25 -0.16 -2.01 -1.45 -0.56 -1.71 SCA3 0.03 1.20 -3.03 -1.19 -0.75 -0.86 SCA4 5.82 5.78 -2.83 -1.26 -1.66 -1.85 SCA5 1.87 1.04 -2.68 -3.83 1.54 -1.73
Standardized Residuals
SCP2 SCP3 SCP4 SCP5 SMA1 SMA2 --- --- --- --- --- ---
SCP2 - -
SCP3 0.19 - -
SCP4 -0.43 2.40 - -
SCP5 -0.95 -2.31 -1.54 - -
SMA1 2.68 2.85 2.08 -0.43 - -
46 SGA4 0.14 -0.66 -0.27 2.63 1.65 0.67
SGA5 -1.02 1.27 -1.81 -0.16 1.50 -0.51 SCA1 -2.62 -2.11 -0.66 -1.76 -1.23 -0.73 SCA2 -0.69 -1.47 -0.51 -1.24 -0.14 0.39 SCA3 -2.74 -0.15 0.89 0.19 -0.88 0.86 SCA4 -1.13 -2.48 -1.33 -1.90 -2.18 0.24 SCA5 -1.43 -2.62 -0.29 -2.05 0.09 -0.34
Standardized Residuals
SMA3 SMA4 SMA5 SGA1 SGA2 SGA3 --- --- --- --- --- ---
SMA3 - -
SMA4 -1.79 - -
SMA5 -0.30 -1.27 - -
SGA1 -0.09 0.02 0.76 4.33
SGA2 3.23 -2.34 0.80 0.94 4.33
SGA3 0.44 2.51 0.77 0.85 1.19 4.33 SGA4 4.67 -0.76 -0.01 -1.56 5.90 -0.16 SGA5 -1.09 3.68 -1.07 4.92 0.39 0.35 SCA1 -1.58 -1.28 -0.92 -0.73 -2.30 -0.97 SCA2 -0.02 0.10 -0.85 1.02 -1.25 0.33 SCA3 2.17 -0.56 0.70 1.83 -0.64 1.45 SCA4 -1.46 -4.62 -1.55 -2.23 -4.65 -2.95 SCA5 1.02 0.67 -0.60 2.34 -1.19 -1.22
Standardized Residuals
SGA4 SGA5 SCA1 SCA2 SCA3 SCA4 --- --- --- --- --- ---
SGA4 4.33
SGA5 -0.91 4.33
SCA1 -1.78 -1.14 - -
SCA2 -0.77 -0.39 6.00 - -
SCA3 1.20 2.60 1.67 1.11 - -
SCA4 -3.63 -2.59 3.97 1.58 1.32 - - SCA5 -0.23 -0.93 2.39 2.52 1.61 3.28
Standardized Residuals
47 Summary Statistics for Standardized Residuals
Smallest Standardized Residual = -4.80 Median Standardized Residual = 0.00 Largest Standardized Residual = 6.52
Stemleaf Plot
- 4|8764
- 3|88666433320
- 2|999887776666554333322211000
- 1|9998888877766665555544443333333222222222111111000000 -
0|9999999888877777777766666666555554444444333333222222111110000000 00000000+11
0|111111122222222333444444455667777888888999999 1|00001111222223333334444555555556666667778899 2|011122333333344445556667999
3|02344555666799 4|01233333779 5|13889
6|05
48 Residual for SCA4 and SGA5 -2.59
49
PENGARUH SCATERHADAP SGA MELALUI SVC SCP DAN SMA
Qplot of Standardized Residuals 3.5... . .. . . . . . . . . . . . . . . x . . x . . * . . * . . * . . x . . x . . * . . x*x N . . x* x*x x . o . . xx * . r . . *** xxx . m . . xx*x . a . . *x** . l . . *xx* . . **x*x . Q . xx* . u . *x** . a . **xx. . n . *** . . t . **x . . i . x* . . l . x*x*x . . e . * x*x . . s . x*x* . . . xx*xx . . . *xx . . . *x xx . . xxx . . * . . * . . * . . x . . x . . . . . . . . . . . . . . -3.5... -3.5 3.5 Standardized Residuals
50 The Modification Indices Suggest to Add the
Path to from Decrease in Chi-Square New Estimate SVC1 SCP 12.3 -1.62
SVC1 SMA 14.5 -1.01 SVC1 SGA 24.6 -1.08 SVC2 SCP 9.6 -1.25 SVC2 SGA 12.5 -0.64 SVC3 SCP 26.5 1.89 SVC4 SCP 27.0 1.74 SMA1 SGA 23.4 2.07 SMA2 SVC 10.3 0.70 SMA2 SCP 12.6 0.56 SMA3 SCP 12.2 0.61 SMA3 SGA 8.5 1.26 SMA4 SVC 14.1 -0.80 SMA4 SCP 11.3 -0.52 SGA1 SVC 20.1 0.76 SGA1 SCP 12.6 0.43 SVC SCP 21.0 1.51 SCP SVC 21.0 37.84 SCP SMA 19.4 0.91 SCP SGA 19.4 0.61 SMA SCP 19.4 1.30 SMA SGA 20.5 1.92
The Modification Indices Suggest to Add an Error Covariance Between and Decrease in Chi-Square New Estimate SCP SVC 21.0 0.01
51 SGA5 SMA4 9.0 0.00
SGA5 SGA1 13.3 0.00 SCA1 SVC1 12.2 0.02 SCA1 SVC3 10.8 -0.01 SCA2 SCA1 36.0 0.04 SCA3 SVC3 8.9 -0.01 SCA3 SCP2 10.1 0.00 SCA4 SVC1 34.1 0.02 SCA4 SVC2 33.4 0.01 SCA4 SVC3 8.5 -0.01 SCA4 SCA1 15.8 0.02 SCA5 SVC4 14.9 -0.01 SCA5 SCA4 10.8 0.01
PENGARUH SCATERHADAP SGA MELALUI SVC SCP DAN SMA Standardized Solution
LAMBDA-Y
SVC SCP SMA SGA --- --- --- ---
SVC1 0.14 - - - - - - SVC2 0.19 - - - - - - SVC3 0.17 - - - - - - SVC4 0.11 - - - - - - SVC5 0.19 - - - - - - SCP1 - - 0.20 - - - - SCP2 - - 0.16 - - - - SCP3 - - 0.17 - - - - SCP4 - - 0.13 - - - - SCP5 - - 0.16 - - - - SMA1 - - - - 0.14 - - SMA2 - - - - 0.13 - - SMA3 - - - - 0.17 - - SMA4 - - - - 0.20 - - SMA5 - - - - 0.14 - - SGA1 - - - - - - 0.20 SGA2 - - - - - - 0.21 SGA3 - - - - - - 0.21 SGA4 - - - - - - 0.22 SGA5 - - - - - - 0.17
52 SCA3 0.05
SCA4 0.18 SCA5 0.16
BETA
SVC SCP SMA SGA --- --- --- ---
SVC - - - - - - - - SCP - - - - - - - - SMA - - - - - - - - SGA -0.62 0.66 1.00 - -
GAMMA SCA --- SVC 1.00 SCP 0.95 SMA 0.85 SGA - -
Correlation Matrix of ETA and KSI
SVC SCP SMA SGA SCA --- --- --- --- ---
SVC 1.00
SCP 0.95 1.00
SMA 0.85 0.82 1.00
SGA 0.87 0.89 1.02 1.00
SCA 1.00 0.95 0.85 0.88 1.00
PSI
Note: This matrix is diagonal.
SVC SCP SMA SGA --- --- --- ---
0.01 0.09 0.27 -0.08
Regression Matrix ETA on KSI (Standardized)
53
PENGARUH SCATERHADAP SGA MELALUI SVC SCP DAN SMA Completely Standardized Solution
LAMBDA-Y
SVC SCP SMA SGA --- --- --- ---
SVC1 0.61 - - - - - - SVC2 0.80 - - - - - - SVC3 0.78 - - - - - - SVC4 0.64 - - - - - - SVC5 0.72 - - - - - - SCP1 - - 0.81 - - - - SCP2 - - 0.81 - - - - SCP3 - - 0.89 - - - - SCP4 - - 0.58 - - - - SCP5 - - 0.66 - - - - SMA1 - - - - 0.61 - - SMA2 - - - - 0.65 - - SMA3 - - - - 0.72 - - SMA4 - - - - 0.86 - - SMA5 - - - - 0.65 - - SGA1 - - - - - - 0.93 SGA2 - - - - - - 0.83 SGA3 - - - - - - 0.83 SGA4 - - - - - - 0.84 SGA5 - - - - - - 0.82
LAMBDA-X
SCA --- SCA1 0.45 SCA2 0.65 SCA3 0.33 SCA4 0.76 SCA5 0.67
BETA
SVC SCP SMA SGA --- --- --- ---
54 SMA - - - - - - - -
SGA -0.62 0.66 1.00 - -
GAMMA
SCA --- SVC 1.00 SCP 0.95 SMA 0.85 SGA - -
Correlation Matrix of ETA and KSI
SVC SCP SMA SGA SCA --- --- --- --- ---
SVC 1.00
SCP 0.95 1.00
SMA 0.85 0.82 1.00
SGA 0.87 0.89 1.02 1.00
SCA 1.00 0.95 0.85 0.88 1.00
PSI
Note: This matrix is diagonal.
SVC SCP SMA SGA --- --- --- ---
0.01 0.09 0.27 -0.08
THETA-EPS
SVC1 SVC2 SVC3 SVC4 SVC5 SCP1 --- --- --- --- --- ---
0.63 0.36 0.40 0.59 0.49 0.35
THETA-EPS
SCP2 SCP3 SCP4 SCP5 SMA1 SMA2 --- --- --- --- --- ---
0.34 0.20 0.66 0.56 0.63 0.57 THETA-EPS
SMA3 SMA4 SMA5 SGA1 SGA2 SGA3 --- --- --- --- --- ---
55 THETA-EPS
SGA4 SGA5 --- --- 0.29 0.32
THETA-DELTA
SCA1 SCA2 SCA3 SCA4 SCA5 --- --- --- --- ---
0.80 0.58 0.89 0.42 0.55
Regression Matrix ETA on KSI (Standardized)
SCA --- SVC 1.00 SCP 0.95 SMA 0.85 SGA 0.88
PENGARUH SCATERHADAP SGA MELALUI SVC SCP DAN SMA Total and Indirect Effects
Total Effects of KSI on ETA SCA
--- SVC 0.94 (0.21) 4.39
SCP 1.24 (0.26) 4.87
SMA 0.77 (0.18) 4.29
56 Indirect Effects of KSI on ETA
SCA --- SVC - -
SCP - -
SMA - -
SGA 1.17 (0.24) 4.95
Total Effects of ETA on ETA
SVC SCP SMA SGA --- --- --- ---
SVC - - - - - - - -
SCP - - - - - - - -
SMA - - - - - - - -
SGA 0.88 0.68 1.50 - - (0.44) (0.27) (0.27) 2.01 2.53 5.64
Largest Eigenvalue of B*B' (Stability Index) is 3.469
Total Effects of ETA on Y
SVC SCP SMA SGA --- --- --- --- SVC1 1.00 - - - - - -
SVC2 1.31 - - - - - - (0.19)
6.94
SVC3 1.15 - - - - - - (0.17)
57
SVC4 0.78 - - - - - - (0.13)
5.92
SVC5 1.29 - - - - - - (0.20)
6.43
SCP1 - - 1.00 - - - -
SCP2 - - 0.80 - - - - (0.08)
10.24
SCP3 - - 0.84 - - - - (0.07)
11.80
SCP4 - - 0.65 - - - - (0.10)
6.70
SCP5 - - 0.80 - - - - (0.10)
7.83
SMA1 - - - - 1.00 - -
SMA2 - - - - 0.98 - - (0.16) 6.25
SMA3 - - - - 1.26 - - (0.19) 6.73
SMA4 - - - - 1.44 - - (0.19) 7.62
58 SGA1 0.88 0.68 1.50 1.00
(0.44) (0.27) (0.27) 2.01 2.53 5.64
SGA2 0.89 0.69 1.53 1.02 (0.45) (0.28) (0.28) (0.07) 2.00 2.51 5.42 13.78
SGA3 0.90 0.69 1.53 1.02 (0.45) (0.28) (0.28) (0.07) 2.00 2.51 5.42 13.85
SGA4 0.93 0.72 1.59 1.06 (0.46) (0.29) (0.29) (0.07) 2.00 2.51 5.45 14.27
SGA5 0.72 0.56 1.23 0.82 (0.36) (0.22) (0.23) (0.06) 2.00 2.51 5.41 13.58
Indirect Effects of ETA on Y
SVC SCP SMA SGA --- --- --- --- SVC1 - - - - - - - -
SVC2 - - - - - - - -
SVC3 - - - - - - - -
SVC4 - - - - - - - -
SVC5 - - - - - - - -
SCP1 - - - - - - - -
SCP2 - - - - - - - -
SCP3 - - - - - - - -
SCP4 - - - - - - - -
59 SMA1 - - - - - - - -
SMA2 - - - - - - - -
SMA3 - - - - - - - -
SMA4 - - - - - - - -
SMA5 - - - - - - - -
SGA1 0.88 0.68 1.50 - - (0.44) (0.27) (0.27) 2.01 2.53 5.64
SGA2 0.89 0.69 1.53 - - (0.45) (0.28) (0.28) 2.00 2.51 5.42
SGA3 0.90 0.69 1.53 - - (0.45) (0.28) (0.28) 2.00 2.51 5.42
SGA4 0.93 0.72 1.59 - - (0.46) (0.29) (0.29) 2.00 2.51 5.45
SGA5 0.72 0.56 1.23 - - (0.36) (0.22) (0.23) 2.00 2.51 5.41
Total Effects of KSI on Y
SCA --- SVC1 0.94 (0.21) 4.39
SVC2 1.24 (0.25) 4.90
60 4.86
SVC4 0.73 (0.16) 4.50
SVC5 1.22 (0.26) 4.71
SCP1 1.24 (0.26) 4.87
SCP2 0.99 (0.20) 4.87
SCP3 1.04 (0.21) 5.02
SCP4 0.81 (0.19) 4.27
SCP5 0.99 (0.22) 4.52
SMA1 0.77 (0.18) 4.29
SMA2 0.75 (0.17) 4.40
SMA3 0.96 (0.21) 4.56
61 SMA5 0.77
(0.18) 4.38
SGA1 1.17 (0.24) 4.95
SGA2 1.19 (0.25) 4.80
SGA3 1.20 (0.25) 4.80
SGA4 1.24 (0.26) 4.82
SGA5 0.96 (0.20) 4.79
PENGARUH SCATERHADAP SGA MELALUI SVC SCP DAN SMA Standardized Total and Indirect Effects
Standardized Total Effects of KSI on ETA
SCA --- SVC 1.00 SCP 0.95 SMA 0.85 SGA 0.88
Standardized Indirect Effects of KSI on ETA
62 Standardized Total Effects of ETA on ETA
SVC SCP SMA SGA --- --- --- --- SVC - - - - - - - - SCP - - - - - - - - SMA - - - - - - - - SGA -0.62 0.66 1.00 - -
Standardized Total Effects of ETA on Y
SVC SCP SMA SGA --- --- --- --- SVC1 0.14 - - - - - - SVC2 0.19 - - - - - - SVC3 0.17 - - - - - - SVC4 0.11 - - - - - - SVC5 0.19 - - - - - - SCP1 - - 0.20 - - - - SCP2 - - 0.16 - - - - SCP3 - - 0.17 - - - - SCP4 - - 0.13 - - - - SCP5 - - 0.16 - - - - SMA1 - - - - 0.14 - - SMA2 - - - - 0.13 - - SMA3 - - - - 0.17 - - SMA4 - - - - 0.20 - - SMA5 - - - - 0.14 - - SGA1 -0.13 0.14 0.21 0.20 SGA2 -0.13 0.14 0.21 0.21 SGA3 -0.13 0.14 0.21 0.21 SGA4 -0.13 0.14 0.22 0.22 SGA5 -0.10 0.11 0.17 0.17
Completely Standardized Total Effects of ETA on Y
63 SCP4 - - 0.58 - - - -
SCP5 - - 0.66 - - - - SMA1 - - - - 0.61 - - SMA2 - - - - 0.65 - - SMA3 - - - - 0.72 - - SMA4 - - - - 0.86 - - SMA5 - - - - 0.65 - - SGA1 -0.58 0.62 0.94 0.93 SGA2 -0.51 0.55 0.83 0.83 SGA3 -0.51 0.55 0.83 0.83 SGA4 -0.52 0.56 0.84 0.84 SGA5 -0.51 0.55 0.83 0.82
Standardized Indirect Effects of ETA on Y
SVC SCP SMA SGA --- --- --- --- SVC1 - - - - - - - - SVC2 - - - - - - - - SVC3 - - - - - - - - SVC4 - - - - - - - - SVC5 - - - - - - - - SCP1 - - - - - - - - SCP2 - - - - - - - - SCP3 - - - - - - - - SCP4 - - - - - - - - SCP5 - - - - - - - - SMA1 - - - - - - - - SMA2 - - - - - - - - SMA3 - - - - - - - - SMA4 - - - - - - - - SMA5 - - - - - - - - SGA1 -0.13 0.14 0.21 - - SGA2 -0.13 0.14 0.21 - - SGA3 -0.13 0.14 0.21 - - SGA4 -0.13 0.14 0.22 - - SGA5 -0.10 0.11 0.17 - -
64 SVC SCP SMA SGA
--- --- --- --- SVC1 - - - - - - - - SVC2 - - - - - - - - SVC3 - - - - - - - - SVC4 - - - - - - - - SVC5 - - - - - - - - SCP1 - - - - - - - - SCP2 - - - - - - - - SCP3 - - - - - - - - SCP4 - - - - - - - - SCP5 - - - - - - - - SMA1 - - - - - - - - SMA2 - - - - - - - - SMA3 - - - - - - - - SMA4 - - - - - - - - SMA5 - - - - - - - - SGA1 -0.58 0.62 0.94 - - SGA2 -0.51 0.55 0.83 - - SGA3 -0.51 0.55 0.83 - - SGA4 -0.52 0.56 0.84 - - SGA5 -0.51 0.55 0.83 - -
Standardized Total Effects of KSI on Y
65 SGA4 0.19
SGA5 0.15
Completely Standardized Total Effects of KSI on Y
SCA --- SVC1 0.60 SVC2 0.79 SVC3 0.77 SVC4 0.64 SVC5 0.71 SCP1 0.77 SCP2 0.77 SCP3 0.85 SCP4 0.56 SCP5 0.63 SMA1 0.52 SMA2 0.56 SMA3 0.61 SMA4 0.73 SMA5 0.55 SGA1 0.82 SGA2 0.73 SGA3 0.73 SGA4 0.74 SGA5 0.72
Time used: 0.313 Seconds
66
Responden yang budiman,
Saya adalah staff edukasi Fakultas Bisnis bidang Pemasaran di Unika WIDYA MANDALA Surabaya, yang sedang meneliti mengenai KEUNGGULAN BERSAING BERKELANJUTAN UNTUK MENGATASI MASALAH SOSIAL MELALUI PENCIPTAAN NILAI BERKELANJUTAN DI INDONESIA pada PRODUK USAHA KECIL MENENGAH INDONESIA.
Saya ingin meneliti sejauh mana KEUNGGULAN BERSAING PRODUK LOKAL INDONESIA yang DI BUAT OLEH PERUSAHAAN KECIL MENENGAH dapat mengatasi kesenjangan sosial melaui STRATEGI PENCIPTAAN NILAI BERKELANJUTAN, terutama pada produk UKM Bapak/Ibu/Saudara sekalian.
Tujuan penelitian ini hanya bersifat untuk pengembangan ilmu strategi dan pemasaran, dan tidak bermaksud personal apapun. Informasi yang anda sampaikan akan aman, dan identitas anda tidak akan dipublikasikan. Atas kerjasama dan perhatiannya, peneliti mengucapkan banyak terimakasih.
Berikut ini adalah daftar pertanyaan yang kami buat untuk kepentingan pengembangan UKM di Indonesia. Mohon Bapak/Ibu/ Saudara amati dengan seksama. Selanjutnya isilah beberapa pertanyaan berikut ini.
INSTRUKSI: BERIKANLAH TANDA SILANG “X” PADA JAWABAN YANG ANDA PILIH.
SS Sangat
Setuju
S Setuju
N Netral
TS Tidak Setuju
STS Sangat Tidak
Setuju
REPUTASI UKM
No. Pertanyaan Ya Tidak
1. Apakah Anda memproduksi produk-produk UKM di Indonesia
2. Apakah Anda memproduksi minimal rata-rata 15 produk UKM dalam sebulan
KETERANGAN IDENTITAS RESPONDEN
No. Informasi
67 3. Lama UKM Berdiri
4. Rata-rata jumlah pelanggan
A. KEUNGGULAN BERSAING BERKELANJUTAN (SCA)
No. Pertanyaan SS S N TS STS
1. Perusahaan memiliki keungulan produksi 2. Terdapat ketidakstabilan pada struktur bisnis 3. Terdapat kompleksitas koordinasi
4. Perusahaan memiliki patents ataupun merek dagang lainnya
5. Terdapat skala ekonomis
B. PENCIPTAAN NILAI BERKELANJUTAN (SVC)
No. Pertanyaan SS S N TS STS
1. Terdapat keunggulan konsumen 2. Terdapat diferensiasi
3. Konsumen lebih menyukai produk perusahaan tetap kompetitif
4. Banyak atribut produk yang dipertimbangkan konsumen
5. Konsumen dapat menggunakan produk untuk trial (coba-coba)
C. PERIODE KEUNGGULAN BERSAING BERKELANJUTAN (SCP)
No. Pertanyaan SS S N TS STS
1. Terdapat siklus persaingan
2. Perusahaan menikmati pengembalian berkisar pada biaya modal
3. Tingkat pengembalian modal selalu meningkat
4. Investasi selalu meningkat
5. Pangsa pasar cenderung meningkat
D. KEUNGGULAN PEMASARAN BERKELANJUTAN (SMA)
No. Pertanyaan SS S N TS STS
68 2. Konsumen memiliki ikatan emosional
dengan produk
3. Konsumen percaya pada produk
4. Produk menunjukan status sosial yang lebih baik
5. Biaya pemasok dapat di kurangi karena reputasi produk
E. KEUNGGULAN BERSAING BERKELANJUTAN GLOBAL (SGA)
No. Pertanyaan SS S N TS STS
1. Industri rentan terhadap kemajuan teknologi 2. Teknologi baru mempercepat perbaikan
produk
3. Teknologi membantu memenuhi kebutuhan pasar
4. Perusahaan memiliki posisi mantap dalam dekade terakhir