OPTIMIZATION OF MICROFILTRATION MEMBRANE CLEANING PROCESS IN PRODUCED WATER TREATMENT
Anggun Puspitarini Siswanto and Ahmad Dzul Aufa Chemical Engineering Department, Diponegoro University
Jln. Prof. Sudharto, Tembalang, Semarang, 50239, Telp/Fax: (024)7460058 Supervisor: Dr. I Nyoman Widiasa, ST., MT
Email: [email protected]
Abstract
Produced water is contaminated water that is extracted together with the oil in oil production operations. Produced water is a mixture of organic and inorganic material. To remove dispersed oil in produced water can use membrane technology, especially microfiltration membrane. The use of membrane filtration in produced water process can be cause fouling in membrane. Fouling is a process resulting in loss of performance of a membrane due to deposition of suspended or dissolved. One of way to treat fouling in membrane is cleaning process. This research investigates the use of microfiltration membrane in produced water treatment and its cleaning process. The purposes of this research are to determine microfiltration membrane cleaning effect of produced water using NaOH as cleaning solution, to determine concentration effect of chemical cleaning agent in membrane cleaning process as well as to determine cleaning period effect of membrane cleaning process. This research used NaOH as cleaning solution. It will be determined the effectiveness of cleaning used NaOH solution. Concentration variables are: 0.1%, 0.3% and 0.5%. Moreover the cleaning period variables are 15 minutes and 30 minutes. Analysis procedure was done by determine the recovery flux permeat of process. According to the results previously analyzed, the following conclusions can be stated: NaOH gives satisfied effectiveness in microfiltration membrane cleaning process. In this research, we use NaOH as cleaning agent for removing the organic fouling caused by produced water. The NaOH concentration as cleaning agent which increases the flux highest is 0.1% NaOH and cleaning period 15 minutes. In this condition, the flux increase about 66.66% in first cleaning and 35.27% in second cleaning.
Keywords: microfiltration, cleaning process and produced water.
INTRODUCTION
system based on gravity separation (skimmer and corrugated plate interceptor or CPI), flotation [5] and centrifugal separation (hydrocyclone) can separate free oil content in produced water [6]. Furthermore, to remove dispersed oil in produced water can use membrane technology, especially ultrafiltration/microfiltration membrane.
The use of membrane filtration in produced water process can be cause fouling in membrane. Fouling is a process resulting in loss of performance of a membrane due to deposition of suspended or dissolved [7]. The effect of fouling is decrease of permeat rate and increase of pressure drop. There are 3 kinds of foulant: organic foulant, inorganic foulant and biology foulant. Membrane fouling occurs through one or more of the following mechanisms: (i) accumulation of solute and gradual irreversible changes in the polarized layer (such as cake formation), (ii) surface adsorption: deposition of solutes and (iii) adsorption: deposition of solute within the membrane. There are many factors contributing to fouling including surface properties (chemistry, morphology, etc.), hydrodynamic conditions, ionic strength and solute concentration [8].
In addition to hydraulic cleaning, chemical cleaning in which cleaning agents are used is a common way to remove foulants. Although chemical cleaning is a useful way to restore membrane performance, membrane cleaning procedures are often based on rules of thumb and are usually conservative [9]. One of way to treat fouling in membrane is cleaning process. It needs research to know the optimization in microfiltration membrane cleaning on produced water treatment. An optimum membrane cleaning needs a comprehensive understanding about interaction fouling, membrane and cleaning solution as well as effect of operation condition in cleaning process, such as: cleaning solution concentration, pH [10], temperature [11] and cleaning period.
This research investigates the use of microfiltration membrane in produced water treatment and its cleaning process. The purposes of this research are to determine microfiltration membrane cleaning effect of produced water using NaOH as cleaning solution, to determine concentration effect of chemical cleaning agent in membrane cleaning process as well as to determine time effect of membrane cleaning process.
MATERIALS AND METHOD
Materials
The primary raw material for research, produced water, were made as synthetic produced water with 100 ppm oil content. The demineralised water was taken from Water Treatment Laboratory in Chemical Engineering Department. The chemical materials used were purchased from Indrasari Store Semarang.
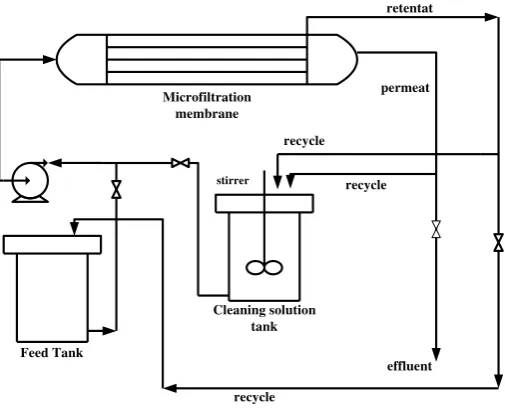
retentat
recycle
permeat
Feed Tank
Microfiltration membrane
Cleaning solution tank
stirrer
effluent recycle recycle
Figure 1. Design of Filtration and Cleaning Microfiltration Membrane
Experimental Setup
Experimental procedure consisted in the following three stages:
1) Water permeability before cleaning. Membranes were tested to determine the initial water permeability with demineralized water. All the samples were taken from the same flat sheet MF module, from different variables in the module representing the research variable. Six membrane samples were tested for each variable. The permeate flow of each sample was measured every 5 min during 30 minutes. Each experiment was done three times. The permeate flux was then calculated for each membrane.
2) Chemical cleaning. The produced water feed was run after the calculation of demineralized water flux. It was done three times to calculate the produced water flux. The next experimental setup is cleaning process. The chemicals used in the experiments were chosen according to the membrane literature’s recommendations for organic fouling, NaOH solution, as well as a consequence of the results obtained in the previous research. The different concentrations of chemical cleaning agent were recirculated in MF membrane module at a pressure of 0 atm.
RESULT AND DISCUSSION
Characteristic of Feed
Analysis of feed characterization done by determine the turbidity number. We use synthetic produced water as feed with oil content 100 ppm. The determination of turbidity done by using Orbeco-Helligs turbidimeter with standard value is NTU. As comparison, we also determine the turbidity of produced water sample taken from Kawengan Reservoir, Cepu. Sample the cooagulate with PAC 100 ppm and filtered by sand filter. The turbidity result can be show on Table 4.1.
.Table 4.1 Turbidity of Produced water
Sample Turbidity (NTU)
Synthetic produced water 100 ppm 1,4 – 3,6
Produced water SPU Kawengan 5,64
Membrane Permeability
The performance of membrane separation processes can be generally expressed by membrane permeability and selectivity. Bigger the membrane permeability and selectivity value means the membrane has better performance [12]. Membrane permeability indicates the ability of membrane to pass the water [13]. This research used flux of pure demineralized water as parameter, which is 423.225 lt/m2.hour. Mulder [14] believes that the permeability of membrane related to the selectivity and diffusivity of its membrane.
Figure 4.1. Flux Profile of Demineralized Water
In Figure 4.1 show that the flux of demineralized water is decrease but becomes stable in 40 minutes. Membrane was tested to determine the initial water permeability within 60 minutes and the flux determine for each 5 minutes. Permeability and selectivity in membrane process is an emerging factor therefore to maintain its stabilization the membrane cleanness should be holds on [15]. In
0 100 200 300 400 500 600 700 800 900
5 10 15 20 25 30 35 40 45 50 55 60
F
lu
x
(
lt
/m
2.
h
ou
r)
tested membrane, the flux of pure demineralized water initially determine which the value will be use as reference of membrane permeability [16].
Characteristic of Flux Degradation
This research uses synthetic produced water with oil content 100 ppm as feed. Produced water is water formed by substrate from oil production which is extracted together with oil and gas in to surface area [17] (Patin, 1999). Produced water contains organic compound in form of three different kind of oil, such as dispersed oil, dissolved oil and free oil [18] (Yang dan Tulloch, 2002). This organic compound becomes the most significant factor effect flux degradation [19] (Lahoussine-Turcaud, dkk, 1990). As shown in Fig 4.2, there is flux degradation while the filtration process. This flux degradation caused by fouling in the membrane surface.
Fig 4.2. Flux profile of produced water
Membrane fouling occurs through one or more of the following mechanisms: (i) accumulation of solute and gradual irreversible changes in the polarized layer (such as cake formation), (ii) surface adsorption: deposition of solutes and (iii) adsorption: deposition of solute within the membrane [8]. In Fig 4.1 flux of produced water is plotted versus the cleaning period. The figure shows that the produced water flux decrease in every period. In the first 10 minutes, flux determined was 358.794 lt/m2.hour while in 20 minutes the flux becomes 271.622 lt/m2.hour and in the last 30 minutes the flux of produced water was calculated 219.193 lt/m2.hour.
Characteristic of Permeate
Analysis also done for determining the flux of synthetic produced water after cleaning process. It gives different range of turbidity value from 0,95-1,15 NTU. Complete data abaout turbidity value of feed and permeat describe in Table 4.2.
0 50 100 150 200 250 300 350 400
10 20 30
F
lux
(
lt
/m
2.
hou
r)
Table 4.2 Turbidity value of synthetic produced water feed
Running Turbidity before filtration (NTU)
Turbidity after filtration (NTU)
% Turbidity degradation
1 3,6 1,13 68,61
2 1,4 0,96 31,43
3 1,9 1,10 42,11
4 1,6 1,02 36,25
5 1,7 1,07 37,06
6 1,6 0,98 38,75
In Table 4.2 show that higher turbidity value of feed the percent turbidity degradation also higher. The table also indicate that the permeate turbidity relatively stable under 1.15 NTU. As stated by Durham dan Walton [20] that the microfiltration membrane can reduce the value of suspended solid, microorganism and turbidity in waste water.
Membrane Cleaning
Cleaning Concentration Solution 0.1% NaOH
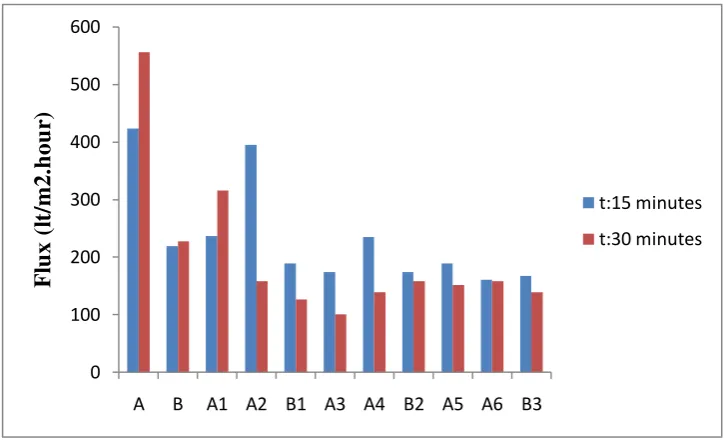
Fig. 4.3 shows the flux profile at cleaning concentration solution 0.1% NaOH. It contains several results such as: flux of pure demineralized water, flux of initial produced water, flux of demineralized water before cleaning, flux of demineralized water after cleaning and flux of produced water after cleaning.
Fig 4.3. Flux Profile at cleaning concentration solution 0,1% NaOH with parameters: pure demineralized water (A), initial produced water (B), demineralized water before cleaning
(A1, A3, A5), demineralized water after cleaning (A2, A4, A6), produced waterafter
cleaning (B1, B2, B3)
0 100 200 300 400 500 600
A B A1 A2 B1 A3 A4 B2 A5 A6 B3
F
lux
(
lt
/m
2.
hou
r)
t:15 minutes
The experimental data is graphically represented in Fig 4.3, showing the flux profile of each parameter. When the cleaning period is 15 minutes, the flux of demineralized water before cleaning is 236.87 lt/m2.hour and the flux after cleaning is 394,79 lt/m2.jam. It indicates the flux increment about 66.66%. The flux increment is also shown on second cleaning. Nevertheless, the flux decrease on third cleaning. In cleaning period 30 minutes, the flux of demineralized water after first cleaning is lower than the flux before cleaning. Moreover, the flux of demineralized water increased after second and third cleaning.
Cleaning Concentration Solution 0.3% NaOH
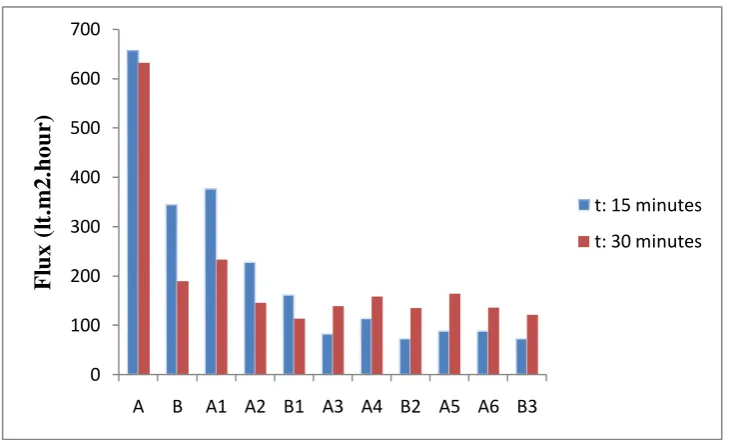
Fig. 4.4 shows the flux profile at cleaning concentration solution 0.3% NaOH. It contains several results such as: flux of pure demineralized water, flux of initial produced water, flux of demineralized water before cleaning, flux of demineralized water after cleaning and flux of produced water after cleaning.
Fig 4.4. Flux Profile at cleaning concentration solution 0,3% NaOH with parameters: pure demineralized water (A), initial produced water (B), demineralized water before cleaning
(A1, A3, A5), demineralized water after cleaning (A2, A4, A6), produced waterafter
cleaning (B1, B2, B3)
Fig 4.4 represents the flux profile at cleaning concentration solution 0.3% NaOH with cleaning period 15 minutes and 30 minutes. Based on the data, the increase of cleaning period does not effect to the increase of flux. On the other hand, it shows the fluctuation of flux. It means that longer cleaning period can not increase the cleaning optimization. As stated by Delijani dan Koshky [21] that cleaning process which conduct on multi stage more optimum compare with single stage in the same total amount of cleaning period.
0 100 200 300 400 500 600 700
A B A1 A2 B1 A3 A4 B2 A5 A6 B3
F
lux
(
lt
.m
2.
hou
r)
t: 15 minutes
Cleaning Concentration Solution 0.5% NaOH
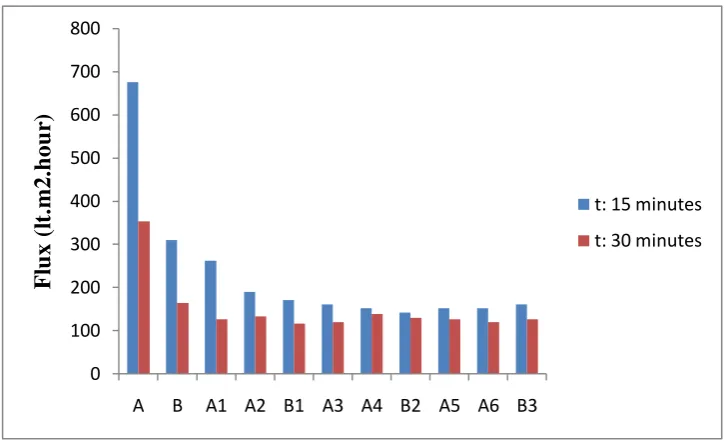
Fig. 4.5 shows the flux profile at cleaning concentration solution 0.5% NaOH. It contains several results such as: flux of pure demineralized water, flux of initial produced water, flux of demineralized water before cleaning, flux of demineralized water after cleaning and flux of produced water after cleaning.
Fig 4.5. Flux Profile at cleaning concentration solution 0,5% NaOH with parameters: pure demineralized water (A), initial produced water (B), demineralized water before cleaning
(A1, A3, A5), demineralized water after cleaning (A2, A4, A6), produced waterafter
cleaning (B1, B2, B3)
In Fig 4.5 the flux profile is plotted by several research variables. The figure shows that in cleaning period 15 minutes, the flux of demineralized water after cleaning decreased relatively. While in cleaning period 30 minutes, there is a fluctuation of demineralized water flux. From the result above, the increment of cleaning agent concentration does not increase the flux but it decrease the flux. It is because of the cleaning agent compatibility with membrane. Membrane with high tolerance of chemicals will not influenced by chemical concentration increase so there is more possible alternative to choose the cleaning agents [22]. The opposite condition will be happen if the membrane tolerance to chemical is low.
Based on the research result, cleaning agent with concentration 0.1% NaOH and cleaning period 15 minutes give optimum flux increment. It is because the cleaning process occur in range of pH as allowed for membrane cleaning process (maximum pH=12). Higher pH is not allowed for this condition. In fact, fouling phenomenon can not be avoids then it needs a periodic cleaning process to maintain the membrane performance.
0 100 200 300 400 500 600 700 800
A B A1 A2 B1 A3 A4 B2 A5 A6 B3
F
lux
(
lt
.m
2.
hou
r)
t: 15 minutes
CONCLUSION
According to the results previously analyzed, the following conclusions can be stated: NaOH gives satisfied effectiveness in microfiltration membrane cleaning process. In this research, we use NaOH as cleaning agent for removing the organic fouling caused by produced water. The NaOH concentration as cleaning agent which increases the flux highest is 0.1% NaOH and cleaning period 15 minutes. In this condition, the flux increase about 66.66% in first cleaning and 35.27% in second cleaning.
REFFERENCES
[1] Sumihar H.D. Silalahi, TorOve Leiknes, Cleaning strategies in ceramic microfiltration membranes fouled by oil and particulate matter in produced water, Desalination 236 (2009) 160–169.
[2] Fakhru’l-Razi Ahmadun, Alireza Pendashteh, Luqman Chuah Abdullah,
Dayang Radiah Awang Biak, Sayed Siavash Madaeni, Zurina Zainal Abidin, Review of technologies for oil and gas produced water treatment, Journal of Hazardous Materials 170 (2009) 530–551
[3] Laraway, James W., Richard E. Weber and Donald J. Thomas, 2009, Water Treatment Process for Oilfield Produced Water, United States Patent, US 7.520.993.
[4] Lindau J. and Jonsson A.-S., Cleaning of ultrafiltration membranes after treatment of oily waste water. Journal of Membrane Science 87 (1994) 71-78.
[5] Broussard, Paul C, Sr and Paul C. Boussard, Jr, 2002, Flotation Apparatus for Clarifying Produced Water, United States Patent, US 6.337.023 B1.
[6] Cheryan, M. and N. Rajagopalan, 1998, Membrane Processing of Oily Streams,Journal of Membrane Science 151, pp 13-28.
[7] Rahimpour, A, S. S. Madaeni dan Y. Mansourpanah. High performance polyethersulfone UF membrane for manufacturing spiral wound module: preparation, morphology, performance, and chemical cleaning. Polymer Advance Technology, 18 (2007) 403–410.
[8] E. Aoustin, A.I. Schäfer, A.G. Fane and T.D. Waite, Ultrafiltration of natural organic matter, Separ. Purif. Technol., 22–23 (2001) 63–78.
[10]Lobo, A., A. Cambiella, J. M. Benito, C. Pazos and J. Coca, 2006, Ultrafiltration of Oil-in-Water With Ceramics Membrane: Influence of pH and Cross Flow Velocity, Journal of Membrane Science 278, 328-334.
[11]Busca, A., N. Hilal and B.P. Atkin, 2003, Optimisation of Washing Cycle on Ultrafiltration Membranes Used n Treatment of Metalworking Fluids, Desalination 156, 199-207.
[12]Radiman, Cynthia, L, Yuliany dan Veinardi Suendo. Pengaruh Media Perendam Terhadap Permeabilitas Membran Polisulfon. Jurnal Matematika dan Sains Vol. 7 No. 2, Oktober 2002, hal 77 – 83.
[13]Uju, Tati Nurhayati, Bustami Ibrahim, Wini Trilaksani dan Maglory Siburian. Karakterisasi Dan Recovery Protein Dari Air Cucian Minced Fish Dengan Membran Reverse Osmosis. Jurnal Pengolahan Hasil Perikanan Indonesia Vol XII Nomor 2 Tahun 2009.
[14]Mulder, M. 1996. Basic Principles of Membrane Technology, 2nd edition. Kluwer Academic Publishers: Netherlands.
[15]Arnal, J.M, B. Garcia-Fayos, M. Sancho, G. Verdu. Ultrafiltration membrane cleaning with different chemical solutions after treating surface water. Desalination and Water Treatment 7 (2009) 198–205.
[16]Muthukumaran, S, K.Yang, A.Seuren, S.Kentish, M.Ashokkumar, G.W.Stevens, F.Grieser. The Use of Ultrasonic Cleaning for Ultrafiltration Membranes in The Dairy Industry. Separation and Purification Technology 39 (2004) 99-107.
[17]Patin, S. 1999. Environmental impact of the offshore oil and gas industry.
New York: Ecomonitor Publishing. Page: 401.
[18]Yang, M. dan Tulloch S. 2002. Oil-in-water monitoring-where are we heading?. Presentation at the Oil-in-Water Workshop, 23 May.
[19]Lahoussine-Turcaud, M.R., Wiesner, dan J. Y. Bottero. 1990. Fouling in Tangential- Flow Ultrafiltration: The Effect of Colloid Size and Coagulation Pretreatment. J. of Membrane Science. 52. 173-190
[20]Durham B, Walton A. 1999. Membrane pretreatment of reverse osmosis: long-term experience on difficults waters. Desalination 122(2):157-170.
[21]Delijani, Farid & Fateme Ekhtiary Koshky. 2010. Chemical cleaning of RO fouled module with oxalic acid. Middle-East Journal of Scientific Research 6 (6): 544-549.
[22]Liu, Charles, Scott Caothien, Jennifer Hayes, Tom Caothuy, Takehiko Otoyo, dan Takashi Ogawa. 2010. Membrane chemical cleaning: From art to science.