Contribution of Agricultural Sector and Sub Sectors on Indonesian Economy
Refa’ul Khairiyakh
*, Irham, Jangkung Handoyo Mulyo
Social Economy of Agriculture, Faculty of Agriculture, Universitas Gadjah Mada, Yogyakarta
*email: rvieriya@yahoo.com
ABSTRACT
This research aimed to analyze trend of agricultural GDP and agricultural contribution in Indonesia, and identify the role of agricultural sector and sub sectors in provinces of Indonesia. Source of data this research use linear trend analysis to analyze trend agricultural Gross Domestic Product (GDP) and agricultural contribution. Location Quotient (LQ), Dynamic Location Quotient (DLQ), and combination LQ and DLQ is used to identify the role of agricultural sector and sub sectors. The analysis found that agricultural GDP in Indonesia has increasing trend while agricultural contribution has decreasing trend. Agricultural sector is basic sector in 29 provinces in Indonesia. Farm food crop is leading sub sector in 6 provinces, farm non food crops is leading sub sector in 14 provinces, livestock is leading sub sector in 3 provinces, forestry is leading sub sector in 1 provinces, fishery is leading sub sector in 5 provinces.
Keywords:Agricultural Sector, Linear Trend, LQ and DLQ
INTRODUCTION
Agricultural sector has a vital role in national economy through its of Gross Domestic Product (GDP), foreign exchange, provision of food and raw materials, poverty alleviation; provide employment where agricultural sector can absorb more than 35% of total workforce, and the increase in people’s income. Beside its direct contributions, the agricultural sector also has indirect contribution of multiplier effect which is the input-output linkages between industries, consumption and investment. The multiplier impact is relatively large so that the agricultural sector as the main sector deserves national economic development (Anonim, 2006).
Agricultural development in Indonesia will be faster if it is supported by development planning in the regional and national. One of determinant factors on agricultural development among others policy and programs. Appropriate policies and programs of agricultural development is a principal source of agricultural progress in order to make agricultural development can be done well
Since appropriate policy and program is critical, the government should be careful to take decisions about policies and programs of agricultural development. For this purpose, Indonesian government needs information about the condition of the agricultural sector both nationally and regionally. By this way, it is
expected that implementation of policies and programs of agricultural development will be more effective and efficient. This research aimed to analyze trend of agricultural GDP trend of agricultural contribution on GDP in Indonesia during the last 20 years, and identify the role of agricultural sector and sub sector in each provinces of Indonesia.
MATERIALS AND METHODS
Trend of agricultural GDP and agricultural contribution on GDP during the last 20 years is analyzed by linear trend with the equation as follows:
Y = β0+β1T +μ
Where:
Y = Agricultural GDP or Agricultural Contribution
β0 = Constant
β1 = Coefficient of regression
T = Period of study (1993-2012) µ = Error
LQ≤ 1, it means that agricultural sector is non basic sector.
Determinate of agricultural basic sub sectors in the region after not only use LQ analysis but also use DLQ analysis and combination both of them to identify of agricultural classification. Dynamic Location Quotient (DLQ) is the modification of LQ. DLQ accommodate the growth rate from time to time (Kuncoro, 2012). DLQ of agricultural sector can be formulated as:
national level
t = difference between last year and beginning year
The criteria:
DLQ >1, it means agricultural sub sector is expectable to be basic sector in the future.
DLQ < 1, it means agricultural sub sector is not expectable to be basic sector in the future.
Table 1.The Agricultural Sector Classification Based on the Composite LQ and DLQ
Criteria
LQ > 1
LQ < 1
DLQ > 1
DLQ < 1
Leading
Prospective
Potential
Disadvantaged
Source:Kuncoro, 2012The explanation:
a. If DLQ>1 and LQ>1 (leading sector) implies that agricultural sub sectors have not been repositioning yet, it means the basic sector in the present will be basic sector in the future. b. If DLQ<1 and LQ>1 (prospective sector)
implies that agricultural sub sectors have been repositioning and it cannot be basic sector in the future.
c. If DLQ>1 and LQ<1 (potential sector) implies that agricultural sub sectors have been
repositioning from non basic sector to be basic sector in the future.
d. If DLQ<1 and LQ< (disadvantaged sector) implies that agricultural sub sectors are not repositioning and it is still being non basic sector.
RESULTS AND DISCUSSION
Trend of Agricultural GDP and Agricultural Contribution in Indonesia
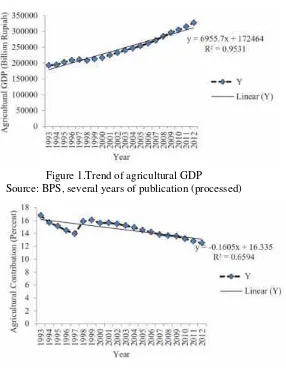
Agricultural sector has important role in Indonesia. The role of its such as produce of foods, contributor on GDP, contributor on foreign exchange, the largest absorption of labor, and multiplier effect. For that, Indonesian government is trying to develop agricultural sector. Performance of agricultural development can be seen from trend of agricultural GDP.
Figure 1.Trend of agricultural GDP
Source: BPS, several years of publication (processed)
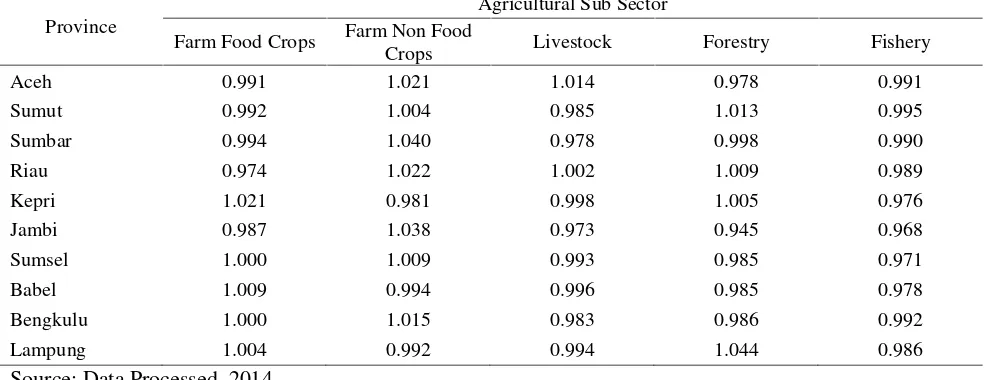
Figure 2.Trend of agricultural contribution on GDP Source: BPS, several years of publication (processed)
Agricultural GDP of Indonesia is formed by five agricultural sub sectors. Farm food crops is the largest contributor on agricultural GDP of Indonesia with average is 50.61% during 1993-2012. Farm non food crops contribute 15.40% on agricultural GDP of Indonesia then there are fishery, livestock, and forestry.
Agricultural contribution on GDP of Indonesia has tendency decrease during 1993-2012. Since 1993 until 1997, agricultural contribution on GDP of Indonesia is decline from year to year. But, economic crisis that is started in 1997 made agricultural contribution increased. Figure 2 shows the decreasing trend of agricultural contribution on GDP of Indonesia. The curve moves from upper right to lower left. Trend of agricultural GDP which increase and trend agricultural contribution which decrease show that economic development in Indonesia is going well. Kuznets cit Sukirno (2011) said that
economic development will change the economic structure in a country. The change of economic structure is showed by decreasing of agricultural contribution on economy.
The Role of Agricultural Sector and Sub Sectors in Indonesia
a. Sumatera
Notes:
1 : Farm Food Crops 3 : Livestock 5 : Fishery 2 : Farm Non Food Crops 4 : Forestry
Table 2.The Average of DLQ Value of Agricultural Sub Sectors by Province in Sumatera
Province
Agricultural Sub Sector
Farm Food Crops Farm Non Food
Crops Livestock Forestry Fishery
Aceh 0.991 1.021 1.014 0.978 0.991
Sumut 0.992 1.004 0.985 1.013 0.995
Sumbar 0.994 1.040 0.978 0.998 0.990
Riau 0.974 1.022 1.002 1.009 0.989
Kepri 1.021 0.981 0.998 1.005 0.976
Jambi 0.987 1.038 0.973 0.945 0.968
Sumsel 1.000 1.009 0.993 0.985 0.971
Babel 1.009 0.994 0.996 0.985 0.978
Bengkulu 1.000 1.015 0.983 0.986 0.992
Lampung 1.004 0.992 0.994 1.044 0.986
Source: Data Processed, 2014
Base on DLQ value in table 2, it is known that fishery sub sector in all provinces in Sumatera cluster has DLQ value smaller than 1. It means that the growth of fishery sub sector in provinces in Sumatera cluster is lower than the growth of fishery sub sector in national level. It also means that fishery sub sector in provinces in Sumatera cluster cannot be basic sub sector in the future if economic condition does not change.
Farm non food crops sub sector is leading sector in 7 provinces in Sumatera cluster. This is not surprising, given the focus of agricultural development in Sumatera cluster is farm non food crops especially palm oil plantations.Development of farm non food crops in Sumatera cluster is effort of government to accelerating economic growth in there. But, this can cause problems in the future if it is not accompanied by development of other sub sectors. The problems that have appeared at this time are the conversion of farm
food crops land and forests to plantation especially palm oil plantation (Table 3).
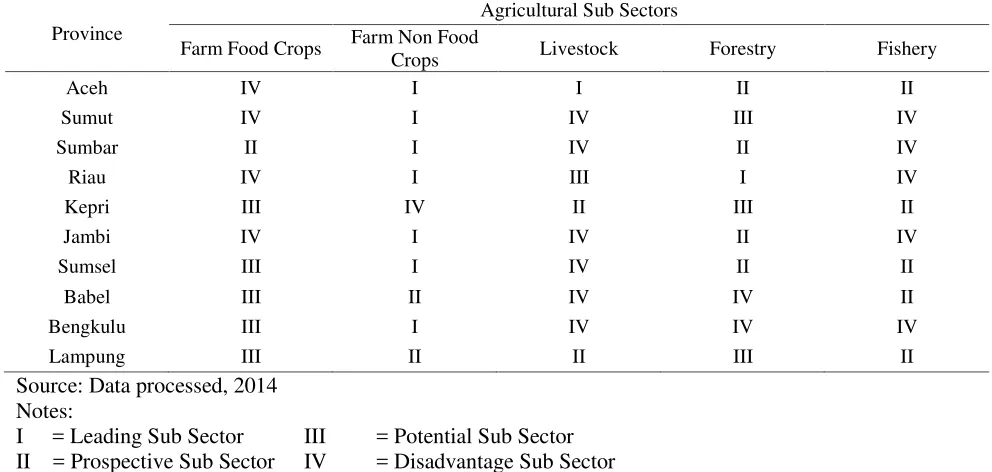
Table 3.Classification of Agricultural Sub Sector Base on LQ and DLQ Value by Province in Sumatera
Province
Agricultural Sub Sectors
Farm Food Crops Farm Non Food
Crops Livestock Forestry Fishery
Aceh IV I I II II
Sumut IV I IV III IV
Sumbar II I IV II IV
Riau IV I III I IV
Kepri III IV II III II
Jambi IV I IV II IV
Sumsel III I IV II II
Babel III II IV IV II
Bengkulu III I IV IV IV
Lampung III II II III II
Source: Data processed, 2014 Notes:
I = Leading Sub Sector III = Potential Sub Sector II = Prospective Sub Sector IV = Disadvantage Sub Sector
b. Jawa
Table 4.The Average of LQ Value Agricultural Sector and Sub Sectors by Province in Java
Province Agricultural Sub Sectors Agricultural Sector
1 2 3 4 5
DKI Jakarta 0.998 0.846 0.505 0.000 2.071 0.01 Jawa Barat 1.495 0.358 1.054 0.214 0.328 1.04 Banten 1.227 0.510 1.673 0.096 0.604 0.58 Jawa Tengah 1.434 0.680 0.865 0.262 0.401 1.43 DI Yogyakarta 1.506 0.172 1.409 0.660 0.128 1.30 Jawa TImur 1.128 1.082 1.267 0.250 0.586 1.21 Source: Data processed, 2014
Notes:
1 : Farm Food Crops 3 : Livestock 5 : Fishery
2 : Farm Non Food Crops 4 : Forestry
Table 5.The Average of DLQ Value of Agricultural Sub sectorsby Province in Jawa
Province
Agricultural Sub Sectors Farm Food
Crops
Farm Non Food
Crops Livestock Forestry Fishery DKI Jakarta 0.982 1.034 0.957 0.000 1.005 Jawa Barat 1.004 0.987 0.999 0.995 0.995
Banten 0.991 1.005 1.020 1.025 1.006
Jawa Tengah 1.002 0.969 1.029 1.003 0.988 DI Yogyakarta 1.001 0.978 0.971 1.314 1.036 Jawa TImur 1.003 0.979 1.003 1.007 0.946 Source: Data processed, 2014
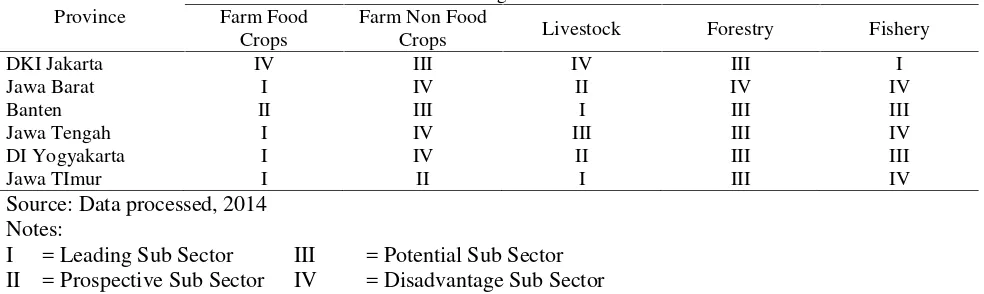
Farm food crops have DLQ value more than 1 in 4 provinces in Jawa cluster. Those provinces are Jawa Barat, Jawa Tengah, DI Yogyakarta, and Jawa Timur. DLQ value of farm food crop in DKI Jakarta and Banten are smaller than 1. It means that farm food crops in DKI Jakarta and Banten cannot be basic sub sector in the future. Farm non
food crops have DLQ value more than 1 in DKI Jakarta and Banten (Table 5).
Notes:
I = Leading Sub Sector III = Potential Sub Sector II = Prospective Sub Sector IV = Disadvantage Sub Sector
c. Bali and Nusa Tenggara
Economic development in Bali and Nusa Tenggara cluster was going well. It can be seen from trend agricultural GRDP which has increasing trend and trend of agricultural contribution which has decreasing trend in all of the provinces in Bali and Nusa Tenggara cluster. Base on table 7, Agricultural sector is basic sector
in all of Bali and Nusa Tenggara cluster. Farm food crops are basic sub sector in Nusa Tenggara Barat and Nusa Tenggara Timur. Sub sectors which are become focus on MP3EI that is livestock is basic in Bali, Nusa Tenggara Barat, and Nusa Tenggara Timur. Fishery is basic sub sector in Bali.
Table 7.The Average of LQ Value of Agricultural Sector and Sub Sectors by Province in Bali and Nusa Tenggara
Province Agricultural Sub Sectors Agricultural Sector
1 2 3 4 5
Bali 0.988 0.309 2.025 0.004 1.246 1.49 NTB 1.207 0.752 1.135 0.125 0.861 2.06 NTT 1.020 0.671 2.331 0.103 0.637 2.92 Source: Data processed, 2014
Notes:
1 : Farm Food Crops 3 : Livestock 5 : Fishery 2 : Farm Non Food Crops 4 : Forestry
Base on table 7, it is known that farm non food crops and forestry are not basic sector in all provinces of Bali and Nusa Tenggara cluster. But farm food crops can be basic sector in the future in Nusa Tenggara Barat while forestry can be basic sector in the future in Bali and Nusa Tenggara Timur. Those are base on DLQ value on table 8.
Base on table 8, it is known that fishery sub sector has DLQ value smaller than 1 in all provinces of Bali and Nusa Tenggara cluster. It means that the growth of fishery sub sector is lower in provinces of Bali and Nusa Tenggara cluster is lower than the growth of its in national level. It also means that if economic
condition is same with this time, fishery can be basic sector in the future.
Farm food crops sub sector is leading sector in Nusa Tenggara Barat and Nusa Tenggara Timur. Livestock is leading sub sector in Bali and Nusa Tenggara Timur. The potential sub sector in Bali is fishery while in Nusa Tenggara Barat is livestock (Table 9).
d. Kalimantan
Selatan which fluctuated. Decreasing of agricultural contribution is cause by exploration of mining resource in Kalimantan.
Base on LQ value on table 10, agricultural sector is basic sector in 3 provinces in Kalimantan cluster. Those are Kalimantan Barat, Kalimantan Tengah, and Kalimantan Selatan. Farm non food crops is basic sub sector in Kalimantan Barat,
Kalimantan Tengah, and Kalimantan Selatan with superior commodity is palm oil. Base on BPS (2008), 80% of farm food crops GRDP of Kalimantan contribute from palm oil while 53% of plantation land area in Kalimantan is also palm oil. Forestry sub sector is basic sub sector in all provinces of Kalimantan cluster.
Table 8.The Average of DLQ Value of Agricultural Sub Sectors by Province in Bali and Nusa Tenggara
Province
Agricultural Sub Sectors Farm Food
Crops
Farm Non Food
Crops Livestock Forestry Fishery
Bali 0.999 0.991 1.001 1.121 0.993
NTB 1.002 1.002 0.999 0.956 0.989
NTT 1.010 0.972 1.011 1.021 0.997
Source: Data processed, 2014
Table 9.Classification of Agricultural Sub Sectors Base on LQ and DLQ Value by Province in Bali and Nusa Tenggara
Province
Agricultural Sub Sectors Farm Food
Crops
Farm Non Food
Crops Livestock Forestry Fishery
Bali IV IV I III II
NTB I III II IV IV
NTT I IV I III IV
Source: Data processed, 2014 Notes:
I = Leading Sub Sector III = Potential Sub Sector II = Prospective Sub Sector IV = Disadvantage Sub Sector
Table 10.The Average of LQ Value of Agricultural Sector and Sub Sectors by Province in Kalimantan
Province Agricultural Sub Sectors Agricultural Sector
1 2 3 4 5
Kalbar 0.759 1.988 0.864 1.366 0.538 1.76 Kalteng 0.356 2.023 0.695 3.194 1.124 2.45 Kalsel 0.945 1.353 0.463 1.004 1.368 1.63 Kaltim 0.322 0.710 0.798 6.232 1.279 0.48 Source: Data processed, 2014
Notes:
1 : Farm Food crops 3 : Livestock 5 : Fishery
2 : Farm Non Food crops 4 : Forestry
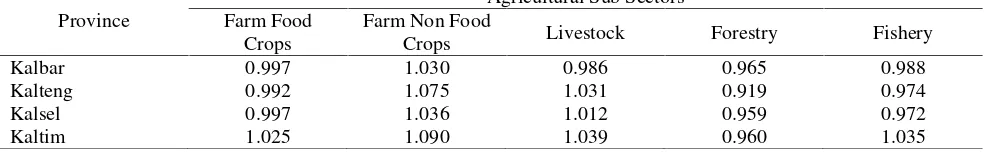
Table 11.The Average of DLQ Value of Agricultural Sub Sectors by Province in Kalimantan
Province
Agricultural Sub Sectors Farm Food
Crops
Farm Non Food
Crops Livestock Forestry Fishery
Kalbar 0.997 1.030 0.986 0.965 0.988
Kalteng 0.992 1.075 1.031 0.919 0.974
Kalsel 0.997 1.036 1.012 0.959 0.972
Kaltim 1.025 1.090 1.039 0.960 1.035
Kaltim III III III II I Source: Data processed, 2014
Notes:
I = Leading Sub Sector III = Potential Sub Sector II = Prospective Sub Sector IV = Disadvantage Sub Sector
Classification of agricultural sub sector on table 12 show that farm food crops is leading sub sector in Kalimantan Barat, Kalimantan Tengah, and Kalimantan Selatan. In Kalimantan cluster, forestry sub sector is repositioning as non basic sub sector in the future (classification II).
e. Sulawesi
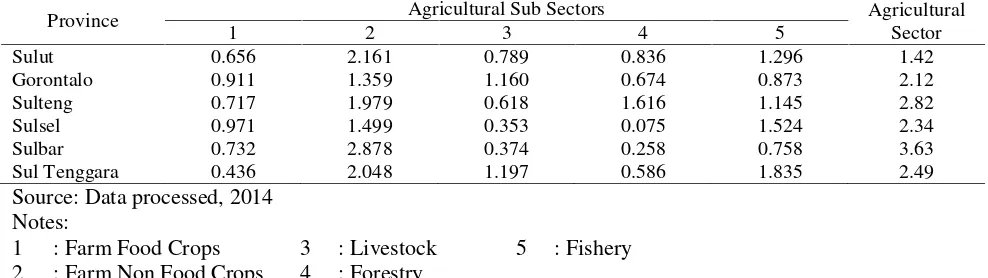
Base on table 13, Agricultural sector is basic sector in all provinces of Sulawesi cluster where farm food crops as be basic sub sector. Farm food crop is not being basic sub sector in Sulawesi cluster. Farm non food crop is basic sub sector in all provinces of Sulawesi cluster.
Table 13.The Average of LQ Value of Agricultural Sector and Sub Sectors by Province in Sulawesi
Province Agricultural Sub Sectors Agricultural Sector
1 2 3 4 5
Sulut 0.656 2.161 0.789 0.836 1.296 1.42 Gorontalo 0.911 1.359 1.160 0.674 0.873 2.12 Sulteng 0.717 1.979 0.618 1.616 1.145 2.82 Sulsel 0.971 1.499 0.353 0.075 1.524 2.34 Sulbar 0.732 2.878 0.374 0.258 0.758 3.63 Sul Tenggara 0.436 2.048 1.197 0.586 1.835 2.49 Source: Data processed, 2014
Notes:
1 : Farm Food Crops 3 : Livestock 5 : Fishery
2 : Farm Non Food Crops 4 : Forestry
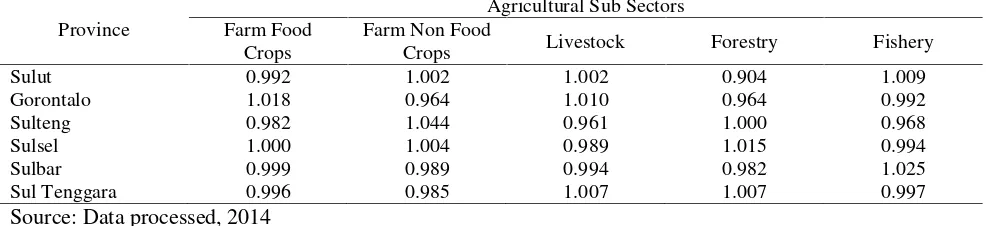
Base on table 14, it is known that DLQ value of farm food crops is more than one in Gorontalo and Sulawesi Selatan. It means that the growth of farm food crops in there is faster than its growth in national level. Although, farm non food crops is basic sub sector in all provinces of Sulawesi cluster but just in 3 provinces farm non food crops has DLQ value more than 1. Those provinces are Sulawesi Utara, Sulawesi Tengah, and Sulawesi Selatan.
Classification of agricultural sub sector base on LQ and DLQ value can be seen on table 15. Farm food crops sub sector is not leading sub
Sulawesi Barat and Sulawesi Tenggara. Fishery is leading sub sector in Sulawesi Utara.
f. Maluku and Papua
Papua and Maluku cluster consist of 4 provinces; those are Maluku, Maluku Utara, Papua, and Papua Barat. Agricultural GRDP has increasing trend in Maluku Utara, Papua, and Papua Barat while agricultural contribution has decreasing trend only in Papua. It means that
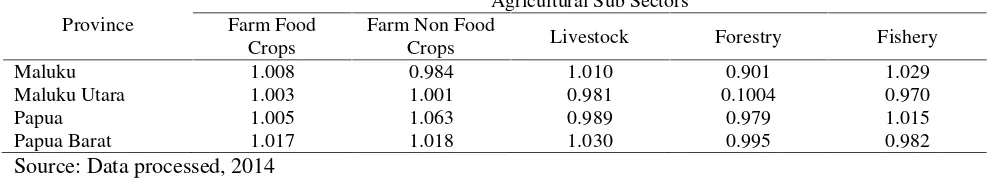
economic development in Papua is better than 3 others provinces. Base on table 16, agricultural sector is basic sector in all provinces of Papua and Maluku cluster. From 5 agricultural sub sectors, there are 3 sub sectors which is basic sub sector. Farm non food crop is basic sub sector in Maluku, while forestry and fishery are basic sub sectors in Maluku, Papua, and Papua Barat.
Table 14.The Average of DLQ Value of Agricultural Sub Sectors by Province in Sulawesi
Province
Sulut 0.992 1.002 1.002 0.904 1.009
Gorontalo 1.018 0.964 1.010 0.964 0.992
Sulteng 0.982 1.044 0.961 1.000 0.968
Sulsel 1.000 1.004 0.989 1.015 0.994
Sulbar 0.999 0.989 0.994 0.982 1.025
Sul Tenggara 0.996 0.985 1.007 1.007 0.997 Source: Data processed, 2014
Table 15.Classification of Agricultural Sub Sectors Base on LQ and DLQ by Province in Sulawesi
Province
Gorontalo III II I IV IV
Sulteng IV I IV I II
Sulsel III I IV III II
Sulbar IV II IV IV III
Sul Tenggara IV II I III II
Source: Data processed, 2014 Notes:
I = Leading Sub Sector III = Potential Sub Sector II = Prospective Sub Sector IV = Disadvantage Sub Sector
Table 16.The Average of LQ Value Agricultural Sector and Sub Sectors by Province in Maluku and Papua
Province Agricultural Sub Sectors Agricultural Sector
1 2 3 4 5
Maluku 0.480 1.453 0.274 1.622 2.709 2.21 Maluku Utara 0.531 3.211 0.311 0.964 0.852 2.58 Papua 0.956 0.239 0.558 2.769 1.466 1.05 Papua Barat 0.351 0.631 0.451 4.734 2.376 1.86 Source: Data processed, 2014
Notes:
1 : Farm Food Crops 3 : Livestock 5 : Fishery
2 : Farm Non Food Crops 4 : Forestry
DLQ value of farm food crops in all provinces of Papua and Maluku cluster is bigger than 1, it means that the growth of farm food crops is faster than its growth in national level. Farm non food crops have DLQ value more than 1 in Maluku
Crops Crops Livestock Forestry Fishery
Maluku III II III II I
Maluku Utara III I IV III IV
Papua III III IV II I
Papua Barat III III III II II
Source: Data processed, 2014 Notes:
I = Leading Sub Sector III = Potential Sub Sector II = Prospective Sub Sector IV = Disadvantage Sub Sector
Base on classification of agricultural sub sector on table 18, it is known that farm food crops is leading sub sector in Maluku Utara while fishery is leading sub sector in Maluku and Papua. Leading sub sector means that the sub sector is basic sub sector this time and can be basic sub sector in the future. Farm food crops are potential sub sector which can develop in all provinces of Papua and Maluku cluster.
CONCLUSION
1. Agricultural GDP in Indonesia has increasing trend while agricultural contribution in Indonesia has decreasing trend. It is showed that economic development in Indonesia is going well.
2. Agricultural sector is basic sector in 29 provinces. Those are Aceh, Sumatera Utara, Sumatera Barat, Riau, Jambi, Sumatera Selatan, Kep. Bangka Belitung, Bengkulu, Lampung, Jawa Barat, Jawa Tengah, DI Yogyakarta, Jawa Timur, Bali, Kalimantan Barat, Kalimantan Tengah, Kalimantan
Selatan, Sulawesi Utara, Gorontalo, Sulawesi Tengah, Selawesi Barat, Sulawesi Selatan, Sulawesi Tenggara, Nusa Tenggara Barat, Nusa Tenggara Timur, Maluku, Maluku Utara, Papua, and Papua Barat. Farm food crop is leading sub sector in 6 provinces, farm non food crops is leading sub sector in 14 provinces, livestock is leading sub sector in 3 provinces, forestry is leading sub sector in 1 provinces, fishery is leading sub sector in 5 provinces.
REFERENCES
Anonim. 2006. Rencana Strategis Kementerian Pertanian 2005-2009. Kementerian Pertanian. www.pertanian.go.id accessed: 3/12/2013 Kuncoro, Mudrajad. 2012. Perencanaan Daerah.
Salemba Empat. Jakarta
Sukirno, Sadono. 2011. Ekonomi Pembangunan cetakan ke-4. Kencana Prenada Media Grop. Jakarta