Oracle® Fusion Middleware
Configuring and Using the Diagnostics Framework for Oracle
WebLogic Server
11
g
Release 1 (10.3.5)
E13714-04April 2011
Oracle Fusion Middleware Configuring and Using the Diagnostics Framework for Oracle WebLogic Server, 11g Release 1 (10.3.5)
E13714-04
Copyright © 2007, 2011, Oracle and/or its affiliates. All rights reserved.
This software and related documentation are provided under a license agreement containing restrictions on use and disclosure and are protected by intellectual property laws. Except as expressly permitted in your license agreement or allowed by law, you may not use, copy, reproduce, translate, broadcast, modify, license, transmit, distribute, exhibit, perform, publish, or display any part, in any form, or by any means. Reverse engineering, disassembly, or decompilation of this software, unless required by law for interoperability, is prohibited.
The information contained herein is subject to change without notice and is not warranted to be error-free. If you find any errors, please report them to us in writing.
If this software or related documentation is delivered to the U.S. Government or anyone licensing it on behalf of the U.S. Government, the following notice is applicable:
U.S. GOVERNMENT RIGHTS Programs, software, databases, and related documentation and technical data delivered to U.S. Government customers are "commercial computer software" or "commercial technical data" pursuant to the applicable Federal Acquisition Regulation and agency-specific supplemental regulations. As such, the use, duplication, disclosure, modification, and adaptation shall be subject to the restrictions and license terms set forth in the applicable Government contract, and, to the extent applicable by the terms of the Government contract, the additional rights set forth in FAR 52.227-19, Commercial Computer Software License (December 2007). Oracle USA, Inc., 500 Oracle Parkway, Redwood City, CA 94065.
This software is developed for general use in a variety of information management applications. It is not developed or intended for use in any inherently dangerous applications, including applications which may create a risk of personal injury. If you use this software in dangerous applications, then you shall be responsible to take all appropriate fail-safe, backup, redundancy, and other measures to ensure the safe use of this software. Oracle Corporation and its affiliates disclaim any liability for any damages caused by use of this software in dangerous applications.
Oracle is a registered trademark of Oracle Corporation and/or its affiliates. Other names may be trademarks of their respective owners.
Contents
Preface
... ixDocumentation Accessibility ... ix Conventions ... ix
1
Introduction and Roadmap
1.1 What Is the WebLogic Diagnostics Framework? ... 1-1 1.2 Document Scope and Audience... 1-2 1.3 Guide to This Document... 1-2 1.4 Related Documentation... 1-4 1.5 Samples and Tutorials ... 1-4 1.5.1 Avitek Medical Records Application (MedRec) and Tutorials... 1-4 1.5.2 WLDF Samples Available for Download... 1-4 1.6 New and Changed Features in this Release... 1-4
2
Overview of the WLDF Architecture
2.1 Overview of the WebLogic Diagnostics Framework... 2-1 2.2 Data Creation, Collection, and Instrumentation ... 2-2 2.3 Archive ... 2-3 2.4 Watch and Notification ... 2-4 2.5 Data Accessor ... 2-5 2.6 Monitoring Dashboard and Request Performance Pages ... 2-5 2.6.1 Monitoring Dashboard ... 2-5 2.6.2 Diagnostics Request Performance Page ... 2-6 2.7 Diagnostic Image Capture ... 2-6 2.8 How It All Fits Together ... 2-7
3
Using WLDF with Oracle JRockit Flight Recorder
iv
3.5.1 JFR Graphical User Interface... 3-6 3.5.2 Analyzing Execution Flow — A Sample Walkthrough ... 3-7 3.5.2.1 Displaying Event Data for a Product Subcomponent ... 3-8 3.5.2.2 Viewing the Event Log to Display Details... 3-8 3.5.2.3 Tracking Execution Flow by Analyzing an Operative Set... 3-10 3.5.2.4 Expanding the Operative Set and Viewing Correlated Diagnostic Data ... 3-11 3.5.3 Changing the Location of Temporary JFR Files ... 3-12
4
Understanding WLDF Configuration
4.1 Configuration MBeans and XML... 4-1 4.2 Tools for Configuring WLDF ... 4-2 4.3 How WLDF Configuration Is Partitioned ... 4-2 4.3.1 Server-Level Configuration... 4-2 4.3.2 Application-Level Configuration ... 4-3 4.4 Configuring Diagnostic Image Capture and Diagnostic Archives... 4-3 4.5 Configuring Diagnostic Image Capture for JRockit Flight Recorder ... 4-4 4.6 Configuring Diagnostic System Modules ... 4-4 4.6.1 The Diagnostic System Module and Its Resource Descriptor ... 4-5 4.6.2 Referencing the Diagnostics System Module from Config.xml... 4-5 4.6.3 The DIAG_MODULE.xml Resource Descriptor Configuration ... 4-6 4.6.4 Managing Diagnostic System Modules ... 4-7 4.6.5 More Information About Configuring Diagnostic System Resources ... 4-7 4.7 Configuring Diagnostic Modules for Applications ... 4-7 4.8 WLDF Configuration MBeans and Their Mappings to XML Elements... 4-8
5
Configuring and Capturing Diagnostic Images
5.1 How to Initiate Image Captures ... 5-1 5.2 Configuring Diagnostic Image Captures... 5-1 5.2.1 Configuring WLDF Diagnostic Volume... 5-2 5.2.2 WLST Commands for Generating an Image Capture ... 5-2 5.3 How Diagnostic Image Capture Is Persisted in the Server's Configuration ... 5-3 5.4 Content of the Captured Image File... 5-3 5.4.1 Data Included in the Diagnostics Image Capture File ... 5-4 5.4.2 WLST Online Commands for Downloading Diagnostics Image Captures ... 5-5
6
Configuring Diagnostic Archives
7
Configuring the Harvester for Metric Collection
7.1 Harvesting, Harvestable Data, and Harvested Data ... 7-1 7.2 Harvesting Data from the Different Harvestable Entities ... 7-2 7.3 Configuring the Harvester ... 7-2 7.3.1 Configuring the Harvester Sampling Period... 7-3 7.3.2 Configuring the Types of Data to Harvest... 7-3 7.3.3 Specifying Type Names for WebLogic Server MBeans and Custom MBeans... 7-4 7.3.4 Harvesting from the DomainRuntime MBeanServer... 7-4 7.3.5 When Configuration Settings Are Validated... 7-5 7.3.6 Sample Configurations for Different Harvestable Types ... 7-5
8
Configuring Watches and Notifications
8.1 Watches and Notifications... 8-1 8.2 Overview of Watch and Notification Configuration ... 8-2 8.3 Sample Watch and Notification Configuration... 8-3
9
Configuring Watches
9.1 Types of Watches ... 9-1 9.2 Configuration Options Shared by All Types of Watches... 9-1 9.3 Configuring Harvester Watches ... 9-2 9.4 Configuring Log Watches... 9-4 9.5 Configuring Instrumentation Watches ... 9-5 9.6 Defining Watch Rule Expressions ... 9-5
10
Configuring Notifications
10.1 Types of Notifications ... 10-1 10.2 Configuring JMX Notifications ... 10-2 10.3 Configuring JMS Notifications... 10-2 10.4 Configuring SNMP Notifications ... 10-3 10.5 Configuring SMTP Notifications ... 10-4 10.6 Configuring Image Notifications... 10-5
11
Configuring Instrumentation
vi
11.5 Configuring Application-Scoped Instrumentation... 11-11 11.5.1 Comparing System-Scoped to Application-Scoped Instrumentation... 11-12 11.5.2 Overview of the Steps Required to Instrument an Application ... 11-13 11.5.3 Creating a Descriptor File for a Delegating Monitor... 11-13 11.5.4 Creating a Descriptor File for a Custom Monitor ... 11-14 11.5.4.1 Defining Pointcuts for Custom Monitors... 11-15 11.5.4.2 Annotation-based Pointcuts... 11-17 11.6 Creating Request Performance Data ... 11-18
12
Configuring the DyeInjection Monitor to Manage Diagnostic Contexts
12.1 Contents, Life Cycle, and Configuration of a Diagnostic Context... 12-1 12.1.1 Context Life Cycle and the Context ID ... 12-2 12.1.2 Dyes, Dye Flags, and Dye Vectors ... 12-2 12.1.3 Where Diagnostic Context Is Configured ... 12-3 12.2 Overview of the Process... 12-3 12.3 Configuring the Dye Vector via the DyeInjection Monitor ... 12-4 12.3.1 Dyes Supported by the DyeInjection Monitor... 12-5 12.3.2 PROTOCOL Dye Flags ... 12-6 12.3.3 THROTTLE Dye Flag ... 12-6 12.3.4 When Diagnostic Contexts Are Created... 12-6 12.4 Configuring Delegating Monitors to Use Dye Filtering... 12-7 12.5 How Dye Masks Filter Requests to Pass to Monitors... 12-9 12.5.1 Dye Filtering Example ... 12-9 12.6 Using Throttling to Control the Volume of Instrumentation Events ... 12-10 12.6.1 Configuring the THROTTLE Dye ... 12-11 12.6.2 How Throttling is Handled by Delegating and Custom Monitors ... 12-12 12.7 Using weblogic.diagnostics.context ... 12-13
13
Accessing Diagnostic Data With the Data Accessor
13.1 Data Stores Accessed by the Data Accessor... 13-1 13.2 Accessing Diagnostic Data Online ... 13-2 13.2.1 Accessing Data Using the Administration Console ... 13-2 13.2.2 Accessing Data Programmatically Using Runtime MBeans ... 13-2 13.2.3 Using WLST to Access Diagnostic Data Online ... 13-3 13.2.4 Using the WLDF Query Language with the Data Accessor... 13-3 13.3 Accessing Diagnostic Data Offline ... 13-3 13.4 Accessing Diagnostic Data Programmatically... 13-3 13.5 Resetting the System Clock Can Affect How Data Is Archived and Retrieved... 13-8
14
Deploying WLDF Application Modules
14.7 Deploying an Application with a Deployment Plan ... 14-5 14.8 Updating an Application with a Modified Plan ... 14-6
15
Using the Monitoring Dashboard
15.1 Running the Monitoring Dashboard... 15-1 15.2 Scope of the Diagnostic Information Displayed... 15-1 15.3 About the Monitoring Dashboard Interface ... 15-2 15.3.1 View List ... 15-2 15.3.2 Metric Browser ... 15-4 15.3.3 View Display Panel ... 15-6 15.4 Understanding How Metrics Are Collected and Presented ... 15-8 15.4.1 About Metrics and Chart Types ... 15-8 15.4.1.1 Current Time Range Charts ... 15-8 15.4.1.2 Custom Time Range Charts ... 15-9 15.4.2 Sequence in which Metrics Data is Displayed... 15-9 15.4.3 Notes about Metric Data Retention... 15-10 15.5 The Parts of a Chart ... 15-10
16
Configuring and Using WLDF Programmatically
16.1 How WLDF Generates and Retrieves Data... 16-1 16.2 Mapping WLDF Components to Beans and Packages... 16-2 16.3 Programming Tools ... 16-4 16.3.1 Configuration and Runtime APIs... 16-5 16.3.1.1 Configuration APIs ... 16-5 16.3.1.2 Runtime APIs ... 16-6 16.4 WLDF Packages ... 16-6 16.5 Programming WLDF: Examples... 16-7 16.5.1 Example: DiagnosticContextExample.java ... 16-7 16.5.2 Example: HarvesterMonitor.java ... 16-8 16.5.2.1 Notification Listeners... 16-8 16.5.2.2 HarvesterMonitor.java... 16-9 16.5.3 Example: JMXAccessorExample.java ... 16-13
A
WLDF Query Language
viii
A.8.2 Data Store Column Names... A-7 A.9 Creating Log Filter Expressions... A-8 A.10 Building Complex Expressions... A-9
B
WLDF Instrumentation Library
B.1 Diagnostic Monitor Library... B-1 B.2 Diagnostic Action Library ... B-9 B.2.1 TraceAction... B-10 B.2.2 DisplayArgumentsAction... B-10 B.2.3 TraceElapsedTimeAction... B-11 B.2.4 TraceMemoryAllocationAction ... B-12 B.2.5 StackDumpAction... B-12 B.2.6 ThreadDumpAction ... B-13 B.2.7 MethodInvocationStatisticsAction ... B-13 B.2.7.1 Configuring the Harvester to Collect MethodInvocationStatisticsAction
Data... B-14 B.2.7.2 Configuring Watch Rules Based on MethodInvocationStatistics Metrics ... B-16 B.2.7.3 Using JMX to Collect Data... B-16 B.2.8 MethodMemoryAllocationStatisticsAction ... B-16
C
Using Wildcards in Expressions
C.1 Using Wildcards in Harvester Instance Names ... C-1 C.1.1 Examples ... C-1 C.2 Specifying Complex and Nested Harvester Attributes... C-2 C.2.1 Examples ... C-3 C.3 Using the Accessor with Harvested Complex or Nested Attributes... C-4 C.4 Using Wildcards in Watch Rule Instance Names ... C-5 C.5 Specifying Complex Attributes in Harvester Watch Rules ... C-5
D
WebLogic Scripting Tool Examples
Preface
This preface describes the document accessibility features and conventions used in this guide—Configuring and Using the Oracle WebLogic Diagnostics Framework.
Documentation Accessibility
Our goal is to make Oracle products, services, and supporting documentation accessible to all users, including users that are disabled. To that end, our
documentation includes features that make information available to users of assistive technology. This documentation is available in HTML format, and contains markup to facilitate access by the disabled community. Accessibility standards will continue to evolve over time, and Oracle is actively engaged with other market-leading
technology vendors to address technical obstacles so that our documentation can be accessible to all of our customers. For more information, visit the Oracle Accessibility Program Web site at http://www.oracle.com/accessibility/.
Accessibility of Code Examples in Documentation
Screen readers may not always correctly read the code examples in this document. The conventions for writing code require that closing braces should appear on an
otherwise empty line; however, some screen readers may not always read a line of text that consists solely of a bracket or brace.
Accessibility of Links to External Web Sites in Documentation
This documentation may contain links to Web sites of other companies or
organizations that Oracle does not own or control. Oracle neither evaluates nor makes any representations regarding the accessibility of these Web sites.
Access to Oracle Support
Oracle customers have access to electronic support through My Oracle Support. For information, visit http://www.oracle.com/support/contact.html or visit http://www.oracle.com/accessibility/support.html if you are hearing impaired.
Conventions
The following text conventions are used in this document:
Convention Meaning
x
italic Italic type indicates book titles, emphasis, or placeholder variables for which you supply particular values.
monospace Monospace type indicates commands within a paragraph, URLs, code in examples, text that appears on the screen, or text that you enter.
1
1
Introduction and Roadmap
The following sections describe the contents and audience for this guide—Configuring and Using the WebLogic Diagnostics Framework:
■ Section 1.1, "What Is the WebLogic Diagnostics Framework?"
■ Section 1.2, "Document Scope and Audience"
■ Section 1.3, "Guide to This Document"
■ Section 1.4, "Related Documentation"
■ Section 1.5, "Samples and Tutorials"
■ Section 1.6, "New and Changed Features in this Release"
1.1 What Is the WebLogic Diagnostics Framework?
The WebLogic Diagnostics Framework (WLDF) is a monitoring and diagnostic framework that defines and implements a set of services that run within WebLogic Server processes and participate in the standard server life cycle. Using WLDF, you can create, collect, analyze, archive, and access diagnostic data generated by a running server and the applications deployed within its containers. This data provides insight into the run-time performance of servers and applications and enables you to isolate and diagnose faults when they occur.
WLDF includes several components for collecting and analyzing data:
■ Integration with Oracle JRockit—If WebLogic Server is configured with JRockit, WLDF can generate diagnostic information about WebLogic Server that is captured in the JRockit Flight Recording file.
■ Diagnostic Image Capture—Creates a diagnostic snapshot from the server that can be used for post-failure analysis. The diagnostic image capture includes JRockit Flight Recorder data, if it is available, that can be viewed in JRockit Mission Control.
■ Archive—Captures and persists data events, log records, and metrics from server instances and applications.
Document Scope and Audience
1-2 Configuring and Using the Diagnostics Framework for Oracle WebLogic Server
instrumentation capabilities, serving as a tool that can help identify performance problems in applications.
■ Harvester—Captures metrics from run-time MBeans, including WebLogic Server MBeans and custom MBeans, which can be archived and later accessed for viewing historical data.
■ Watches and Notifications—Provides the means for monitoring server and application states and sending notifications based on criteria set in the watches.
■ Monitoring Dashboard—Graphically presents the current and historical operating state of WebLogic Server and hosted applications. The Monitoring Dashboard, which is accessed from the WebLogic Server Administration Console, provides a set of tools for organizing and displaying diagnostic data into views, which surface some of the more critical run-time WebLogic Server performance metrics and the change in those metrics over time
■ Logging services—Manage logs for monitoring server, subsystem, and application events. The WebLogic Server logging services are documented separately from the rest of the WebLogic Diagnostics Framework. See Configuring Log Files and Filtering Log Messages for Oracle WebLogic Server.
WLDF provides a set of standardized application programming interfaces (APIs) that enable dynamic access and control of diagnostic data, as well as improved monitoring that provides visibility into the server. Independent Software Vendors (ISVs) can use these APIs to develop custom monitoring and diagnostic tools for integration with WLDF.
WLDF enables dynamic access to server data through standard interfaces, and the volume of data accessed at any given time can be modified without shutting down and restarting the server.
1.2 Document Scope and Audience
This document describes and tells how to configure and use the monitoring and diagnostic services provided by WLDF.
WLDF provides features for monitoring and diagnosing problems in running WebLogic Server instances and clusters and in applications deployed to them. Therefore, the information in this document is directed both to system administrators and to application developers. It also contains information for third-party tool developers who want to build tools to support and extend WLDF.
It is assumed that readers are familiar with Web technologies and the operating system and platform where WebLogic Server is installed.
1.3 Guide to This Document
This document is organized as follows:
■ This chapter, "Introduction and Roadmap," provides an overview of WLDF components and describes the audience for this guide.
■ Chapter 2, "Overview of the WLDF Architecture," provides a high-level view of the WLDF architecture.
Guide to This Document
■ Chapter 4, "Understanding WLDF Configuration," provides an overview of how WLDF features are configured for servers and applications.
■ Chapter 5, "Configuring and Capturing Diagnostic Images," describes how to configure and use the WLDF Diagnostic Image Capture component to capture a snapshot of significant server configuration settings and the server state.
■ Chapter 6, "Configuring Diagnostic Archives," describes how to configure and use the WLDF Diagnostic Archive component to persist diagnostic data to a file store or database.
■ Chapter 7, "Configuring the Harvester for Metric Collection," describes how to configure and use the WLDF Harvester component to harvest metrics from runtime MBeans, including WebLogic Server MBeans and custom MBeans.
■ Chapter 8, "Configuring Watches and Notifications," provides an overview of WLDF watches and notifications.
■ Chapter 9, "Configuring Watches," describes how to configure watches to monitor server instances and applications for specific conditions and send notifications when those conditions are met.
■ Chapter 10, "Configuring Notifications," describes how to configure notifications that can be triggered by watches.
■ Chapter 11, "Configuring Instrumentation," describes how to add diagnostic instrumentation code to WebLogic Server classes and to the classes of applications running on the server.
■ Chapter 12, "Configuring the DyeInjection Monitor to Manage Diagnostic Contexts," describes how to use the DyeInjection monitor and how to use dye filtering with diagnostic monitors.
■ Chapter 13, "Accessing Diagnostic Data With the Data Accessor," tells how to use the WLDF Data Accessor component to retrieve diagnostic data.
■ Chapter 14, "Deploying WLDF Application Modules," explains how to configure and manage instrumentation for an application as a diagnostics application module.
■ Chapter 15, "Using the Monitoring Dashboard," explains how to graphically present the current and historical operating state of WebLogic Server and hosted applications using, in part, diagnostic data captured by WLDF.
■ Chapter 16, "Configuring and Using WLDF Programmatically," provides an overview of how you can use the JMX API and the WebLogic Scripting Tool (weblogic.WLST) to configure and use WLDF components.
■ Appendix A, "WLDF Query Language," describes the WLDF query language that is used for constructing expressions to query diagnostic data using the Data Accessor, constructing watch rules, and constructing rules for filtering logs.
■ Appendix B, "WLDF Instrumentation Library," describes the predefined diagnostic monitors and diagnostic actions that are included in the WLDF Instrumentation Library.
■ Appendix C, "Using Wildcards in Expressions," discusses how to use wildcards in WLDF expressions.
■ Appendix D, "WebLogic Scripting Tool Examples," provides examples of how to perform WLDF monitoring and diagnostic activities using the WebLogic Scripting Tool.
Related Documentation
1-4 Configuring and Using the Diagnostics Framework for Oracle WebLogic Server
1.4 Related Documentation
■ Configuring Log Files and Filtering Log Messages for Oracle WebLogic Server describes how to use WLDF logging services to monitor server, subsystem, and application events.
■ "Configure the WebLogic Diagnostics Framework" in the Administration Console Online Help describes how to use the visual tools in the WebLogic Administration Console to configure WLDF.
■ The WLDF system resource descriptor conforms to the weblogic-diagnostics.xsd schema, available at
http://xmlns.oracle.com/weblogic/weblogic-diagnostics/1.0/web logic-diagnostics.xsd.
1.5 Samples and Tutorials
In addition to this document, we provide a variety of samples and tutorials that show WLDF configuration and use.
1.5.1 Avitek Medical Records Application (MedRec) and Tutorials
MedRec is an end-to-end sample J2EE application shipped with WebLogic Server that simulates an independent, centralized medical record management system. The MedRec application provides a framework for patients, doctors, and administrators to manage patient data using a variety of different clients.
MedRec demonstrates WebLogic Server and J2EE features, and highlights
recommended best practices. MedRec is included in the WebLogic Server distribution, and can be accessed from the Start menu on Windows machines. For Linux and other platforms, you can start MedRec from the WL_HOME\samples\domains\medrec directory, where WL_HOME is the top-level installation directory for WebLogic Platform.
1.5.2 WLDF Samples Available for Download
Additional WLDF samples for download can be found at
https://www.samplecode.oracle.com/sf/projects/codesamples/. These examples are distributed as .zip files that you can unzip into an existing WebLogic Server samples directory structure. These samples include Oracle-certified ones, as well as samples submitted by fellow developers.
1.6 New and Changed Features in this Release
Two diagnostic monitors have been added:
■ JDBC_After_Reserve_Connection_Internal
■ JDBC_After_Release_Connection_Internal
These diagnostic instrumentation monitors can be configured in a WLDF module at the server level. They provide additional visibility when JDBC connections are reserved and released. For more information, see Section B.1, "Diagnostic Monitor Library."
2
2
Overview of the WLDF Architecture
The WebLogic Diagnostics Framework (WLDF) consists of a number of components that work together to collect, archive, and access diagnostic information about a WebLogic Server instance and the applications it hosts. This section provides an architectural overview of those components.
The WLDF architecture is described in the following sections:
■ Section 2.1, "Overview of the WebLogic Diagnostics Framework"
■ Section 2.2, "Data Creation, Collection, and Instrumentation"
■ Section 2.3, "Archive"
■ Section 2.4, "Watch and Notification"
■ Section 2.5, "Data Accessor"
■ Section 2.6, "Monitoring Dashboard and Request Performance Pages"
■ Section 2.7, "Diagnostic Image Capture"
■ Section 2.8, "How It All Fits Together"
2.1 Overview of the WebLogic Diagnostics Framework
WLDF consists of the following:
■ Data creators (data publishers and data providers that are distributed across WLDF components)
■ Data collectors (the Logger and the Harvester components)
■ Archive component
■ Accessor component
■ Instrumentation component
■ Watch and Notification component
■ Image Capture component
Data Creation, Collection, and Instrumentation
2-2 Configuring and Using the Diagnostics Framework for Oracle WebLogic Server
■ Monitoring Dashboard
Data creators generate diagnostic data that is consumed by the Logger and the
Harvester. Those components coordinate with the Archive to persist the data, and they coordinate with the Watch and Notification subsystem to provide automated
monitoring. The Accessor interacts with the Logger and the Harvester to expose current diagnostic data and with the Archive to present historical data. The Image Capture facility provides the means for capturing a diagnostic snapshot of a key server state. The relationship among these components is shown in Figure 2–1.
Figure 2–1 Major WLDF Components
All of the framework components operate at the server level and are only aware of server scope. All the components exist entirely within the server process and participate in the standard server lifecycle. All artifacts of the framework are configured and stored on a per server basis.
2.2 Data Creation, Collection, and Instrumentation
Archive
Figure 2–2 Relationship of Data Creation Components to Data Collection Components
Invocations of the server logging infrastructure serve as inline data publishers, and the generated data is collected as events. (The logging infrastructure can be invoked through the catalog infrastructure, the debugging model, or directly through the Logger.)
The Instrumentation system creates monitors and inserts them at well-defined points in the flow of execution. These monitors publish data directly to the Archive.
Components registered with the MBean Server may also make themselves known as data providers by registering with the Harvester. Collected data is then exposed to both the Watch and Notification system for automated monitoring and to the Archive for persistence.
2.3 Archive
The past state is often critical in diagnosing faults in a system. This requires that the state be captured and archived for future access, creating a historical archive. In WLDF, the Archive meets this need with several persistence components. Both events and harvested metrics can be persisted and made available for historical review.
Traditional logging information, which is human readable and intended for inclusion in the server log, is persisted through the standard logging appenders. New event data that is intended for system consumption is persisted into an event store using an event archiver. Metric data is persisted into a data store using a data archiver. The
relationship of the Archive to the Logger and the Harvester is shown in Figure 2–3.
Watch and Notification
2-4 Configuring and Using the Diagnostics Framework for Oracle WebLogic Server
Figure 2–3 Relationship of the Archive to the Logger and the Harvester
2.4 Watch and Notification
The Watch and Notification system can be used to create automated monitors that observe specific diagnostic states and send notifications based on configured rules.
A watch rule can monitor log data, event data from the Instrumentation component, or metric data from a data provider that is harvested by the Harvester. The Watch Manager is capable of managing watches that are composed of a number of watch rules. These relationships are shown in Figure 2–4.
Figure 2–4 Relationship of the Logger and the Harvester to the Watch and Notification System
Monitoring Dashboard and Request Performance Pages
2.5 Data Accessor
The Accessor provides access to all the data collected by WLDF, including log, event, and metric data. The Accessor interacts with the Archive to get historical data including logged event data and persisted metrics.
When accessing data in a running server, a JMX-based access service is used. The Accessor provides for data lookup by type, by component, and by attribute. It permits time-based filtering and, in the case of events, filtering by severity, source and content.
Tools may need to access data that was persisted by a currently inactive server. In this case, an offline Accessor is also provided. You can use it to export archived data to an XML file for later access. To use the Accessor in this way, you must use the WebLogic Scripting Tool (WLST) and must have physical access to the machine.
The relationship of the Accessor to the Harvester and the Archive is shown in Figure 2–5.
Figure 2–5 Relationship of the Online and Offline Accessors to the Archive
2.6 Monitoring Dashboard and Request Performance Pages
WLDF provides two web pages from which diagnostic data is displayed visually:
■ Monitoring Dashboard
■ Diagnostics Request Performance Page
2.6.1 Monitoring Dashboard
The Monitoring Dashboard displays the current and historical operating state of WebLogic Server and hosted applications by providing visualizations of metric runtime MBean attributes, which surface some of the more critical run-time
performance metrics and the change in those metrics over time. Historical operating state is represented by collected metrics that have been persisted into the Archive. To view collected metrics from the Archive, you must configure the Harvester to capture the data you want to monitor.
Diagnostic Image Capture
2-6 Configuring and Using the Diagnostics Framework for Oracle WebLogic Server
Custom views are available only to the user who creates them. Custom views are automatically persisted and can be accessed again when you restart the Monitoring Dashboard sessions.
For more information, see Chapter 15, "Using the Monitoring Dashboard."
2.6.2 Diagnostics Request Performance Page
The Diagnostics Request Performance page of the WebLogic Server Administration Console shows real-time and historical views of method performance information that is captured through the WLDF instrumentation capabilities. To view request
performance information, you must first configure WLDF instrumentation to make that data available.
For more information, see Section 11.6, "Creating Request Performance Data."
2.7 Diagnostic Image Capture
Diagnostic Image Capture support gathers the most common sources of the key server state used in diagnosing problems. It packages that state into a single artifact which can be made available to support technicians, as shown in Figure 2–6. The diagnostic image is in essence a diagnostic snapshot or dump from the server, analogous to a UNIX "core" dump.
If WebLogic Server is configured with Oracle JRockit, and JRockit Flight Recorder is not disabled, the diagnostic image capture includes all available JRockit Flight Recorder data from all producers. Furthermore, if WLDF is configured to generate WebLogic Server diagnostic information captured by JRockit Flight Recorder, the JFR file includes that information as well. The JFR file can be extracted from the diagnostic image capture and viewed in JRockit Mission Control. See Chapter 3, "Using WLDF with Oracle JRockit Flight Recorder."
Image Capture support includes:
■ On-demand capture, which is the creation of a diagnostic image capture by means of an operation or command issued from the WebLogic Server Administration Console, WLST script, or JMX application
■ Image notification, which is automatically creating a diagnostic image capture in response to the triggering of an associated Harvester watch, Log watch, or Instrumentation watch rule. For example, a Harvester watch that monitors runtime MBean attributes in a running server can trigger an image notification if the metrics harvested from specific runtime MBean instances indicate a
performance issue. Data in the diagnostic image capture can be analyzed to determine the likely causes of the issue.
For more information, see:
■ Chapter 5, "Configuring and Capturing Diagnostic Images"
How It All Fits Together
Figure 2–6 Diagnostic Image Capture
2.8 How It All Fits Together
Figure 2–7 shows how all the parts of WLDF fit together.
How It All Fits Together
3
3
Using WLDF with Oracle JRockit Flight
Recorder
WLDF provides specific integration points with JRockit Flight Recorder. WebLogic Server events can optionally be propagated to the Flight Recorder for inclusion in a common data set for runtime or post-incident analysis. The Flight Recording data is also included in WLDF diagnostic image captures, enabling you to capture flight recording snapshots based on WLDF watch rules. This full set of functionality enables you to capture and analyze runtime system information for both the JVM and the Fusion Middleware components running on it, in a single view.
The following sections provide an overview of WLDF integration with JRockit Flight Recorder, and explain common usage scenarios that show how this integration can provide for a comprehensive performance analysis and diagnostic foundation for production systems based on WebLogic Server:
■ Section 3.1, "About Oracle JRockit Flight Recorder"
■ Section 3.2, "Key Features of WLDF Integration with JRockit Flight Recorder"
■ Section 3.3, "JRockit Flight Recorder Use Cases"
■ Section 3.4, "Obtaining the JRockit Flight Recording File"
■ Section 3.5, "Analyzing Flight Recorder Data in JRockit Mission Control"
3.1 About Oracle JRockit Flight Recorder
The version of Oracle JRockit that is available in the WebLogic Server installation program includes a component called JRockit Flight Recorder (JFR), a performance monitoring and profiling tool. JFR records diagnostic information on a continuous basis, making it always available, even in the wake of catastrophic failure such as a system crash.
Key Features of WLDF Integration with JRockit Flight Recorder
3-2 Configuring and Using the Diagnostics Framework for Oracle WebLogic Server
Figure 3–1 Circular Flight Recording Buffer
For details about how the JFR flight recording works, see "Flight Recorder Data Flow" in Oracle JRockit Flight Recorder Run Time Guide.
The JFR file can be analyzed at any time to examine the details of system execution flow that occurred leading up to an event. The data contained in the JFR file includes events from the JVM and from any other event producer, such as WebLogic Server and Oracle Dynamic Monitoring System (DMS).
The amount of additional processing overhead that results when you enable JFR recording, and also configure WLDF to generate WebLogic Server diagnostics to be captured by JFR, is minimal. This makes it ideal to be used on a full time basis, especially in production environments where it adds the greatest value.
JFR provides the following key benefits:
■ Designed to run continuously — When JFR is configured to run full-time, with both JVM and WLDF events captured in the flight recording, diagnostic data is always available at the time an event occurs, including a system crash. This ensures that a record of diagnostic data leading up to the event is available, allowing you to diagnose the event without having to recreate it.
■ Comprehensive data — JFR combines data generated by the JRockit Runtime Analyzer and the JRockit Latency Analysis Tool and presents it in one place.
■ Integration with event providers — JRockit includes a set of APIs that allow the JFR to monitor additional system components, including WebLogic Server, Oracle Dynamic Monitoring System (DMS), and other Oracle products.
For more information about JFR, see "Introduction to the Flight Recorder" in Oracle JRockit Flight Recorder Run Time Guide.
3.2 Key Features of WLDF Integration with JRockit Flight Recorder
The key features provided by WLDF to leverage integration with JFR include the following:
■ WLDF diagnostic data captured in JFR flight recording
WLDF can be configured to generate diagnostic data about WebLogic Server events that is captured in the JFR flight recording. Captured events include those from components such as: web applications; EJBs; JDBC, JTA, and JMS resources; resource adapters; and WebLogic Web Services.
Key Features of WLDF Integration with JRockit Flight Recorder
The ability to generate WebLogic Server event data for the Flight Recording is controlled by the WLDF diagnostic volume configuration. This control also determines the amount of WebLogic Server event data that is captured by JFR, and can be adjusted to include more, or less, data for each WebLogic Server event that is generated. For more information, see Section 5.2.1, "Configuring WLDF
Diagnostic Volume."
■ Automatic throttling of generated events under load
As processing load rises on a given WebLogic Server instance, WLDF
automatically begins throttling the number of incoming WebLogic Server requests that are selected for event generation and recording into the JFR file. The degree of throttling is adjusted continuously as system load rises and falls.
Throttling provides three key benefits:
– The overhead of capturing events generated by WLDF for JFR remains minimized, which is especially important when systems are under load.
– The time interval encompassed in the JFR flight recording buffer is maximized, giving you a better historical record of data.
– Throttling has the effect of sampling incoming WebLogic Server requests, maintaining high performance while still providing an accurate overall view of system activity under load.
■ WLDF diagnostic image capture support for JFR files
WLDF diagnostic image capture automatically includes the JFR file, if one has been generated by Flight Recorder. The JFR file includes data generated by all active event producers, including WebLogic Server. An image captured using the Watch and Notification component may contain the JFR file, if available.
■ WLST commands for downloading the contents of diagnostic image captures
WLST includes a set of commands for downloading the contents of diagnostic image captures, described in Section 5.4.2, "WLST Online Commands for Downloading Diagnostics Image Captures." Although these commands are generally useful for listing, copying, and downloading all entries contained in the diagnostic image capture, they can also be used for obtaining the JFR file, if available. Once obtained from the diagnostic image capture, the JFR file can be viewed in JRockit Mission Control.
Notes:
■ By default, the WLDF diagnostic volume is set to Low.
■ The WLDF diagnostic volume setting does not affect explicitly configured diagnostic modules.
JRockit Flight Recorder Use Cases
3-4 Configuring and Using the Diagnostics Framework for Oracle WebLogic Server
3.3 JRockit Flight Recorder Use Cases
This section summarizes three common business cases where using the JRockit Flight Recorder can help you resolve important diagnostic issues:
■ Section 3.3.1, "Diagnosing a Critical Failure — The "Black Box""
■ Section 3.3.2, "Profiling During Performance Testing or in Production"
■ Section 3.3.3, "Real-time Application Diagnostics and Reporting (RADAR)"
For more information about these scenarios, see "Flight Recorder Use Cases" in Oracle JRockit Flight Recorder Run Time Guide.
3.3.1 Diagnosing a Critical Failure — The "Black Box"
When a "catastrophic" failure occurs, the content of the Flight Recorder buffer can be made available for post-failure analysis in a manner analogous to the use of an aircraft’s black box. Examples of such failures include a JVM crash or an out-of-memory error (OOME) resulting in an application terminating.
When these situations arise, the flight recording contains the following information, which can be helpful in determining the cause of the failure:
■ JVM core dump, including metadata about the Flight Recorder configuration at the time of the crash. Furthermore, if the Flight Recorder was running in persistent storage mode the data buffer file might contain a certain amount of data.
■ WebLogic Server events, captured by WLDF, that preceded the failure.
When running in persistent mode, the JFR uses a combination of memory and disk to store its buffer. The most recent data is stored in memory and is flushed out to disk as it "ages". In this mode, the on-disk data will be available even after a power failure or similar catastrophic event; only the most recent data will be unavailable (for example, the data that had not yet been flushed to disk). The text dump file will contain metadata about the Flight Recorder configuration at the time of the crash, including the path to the data buffer file when applicable. For more information about persistent mode, see "Operating Modes" in Oracle JRockit Flight Recorder Run Time Guide.
3.3.2 Profiling During Performance Testing or in Production
Profiling involves capturing data beginning at a specific point in time so that, later, you can analyze the events that were generated after that point. In contrast to RADAR, described in the following section, profiling involves analyzing the diagnostic data generated after a particular event occurs, as opposed to the data that precedes it.
Profiling with JRockit Flight Recorder optimizes the ability to perform deep analysis of lock contention and causes of latency.
3.3.3 Real-time Application Diagnostics and Reporting (RADAR)
RADAR is the examination of diagnostic data generated during run time when a particular event occurs for the purposes of understanding the system activity that preceded the event; for example, system activity occurring moments before a serious error message is generated. By using the diagnostic capabilities available in WLDF in conjunction with JRockit Flight Recorder, you can capture a large amount of
Obtaining the JRockit Flight Recording File
One WLDF feature whose usage with JRockit Flight Recorder makes for a powerful RADAR capability is image notification, which allows you to create a diagnostic image capture automatically in response to a particular event or error condition. A diagnostic image capture, which created as the result of an image notification, automatically includes the JFR file. The JFR file can then be extracted from the diagnostic image capture and examined immediately in JRockit Mission Control or stored for later analysis. Image notification, used when WLDF data is captured by JRockit Flight Recorder, is particularly well suited for this sort of real-time diagnosis of intermittent problems.
Image notification is part of the Watch and Notifications system in WLDF. To set up image notification, you create one or more individual watch rules. A watch rule includes a logical expression that uses the WLDF query language to specify the event for the watch to detect. For example, the following log event watch rule expression detects the server log message with severity level Critical and ID BEA-149618:
(SEVERITY = 'Critical') AND (MSGID = 'BEA-149618')
Watch rules can monitor any of the following:
■ Harvestable runtime MBean instances in the local runtime MBean server
A harvester watch can trigger an image notification if runtime MBean attributes detect a performance issue, such as high memory utilization rates or problems with open socket connections to the server.
■ Messages published to the server log
A log watch can trigger an image notification if a specific message, severity level, or string is issued.
■ Event generated the WLDF Instrumentation component
An event watch can trigger an image notification if an instrumentation service generates a particular event.
For more information, see the following topics:
■ Chapter 8, "Configuring Watches and Notifications"
■ Section 10.6, "Configuring Image Notifications"
■ Appendix A, "WLDF Query Language"
The following sections explain how to obtain the JFR file from the diagnostic image capture and provide an example of using JRockit Mission Control to examine the WebLogic Server events contained in the JFR file:
■ Section 3.4, "Obtaining the JRockit Flight Recording File"
■ Section 3.5, "Analyzing Flight Recorder Data in JRockit Mission Control"
3.4 Obtaining the JRockit Flight Recording File
The diagnostic image capture itself is a single JFR file that contains individual images produced by the different server subsystems. If the JFR file is available, it is included in the diagnostic image as the file JRockitFlightRecorder.jfr.
Analyzing Flight Recorder Data in JRockit Mission Control
3-6 Configuring and Using the Diagnostics Framework for Oracle WebLogic Server
"Configure and capture diagnostic images" in Oracle WebLogic Server Administration Console Help.
To view the contents of the JFR file, you first need to extract it from the diagnostic image capture as described in Chapter 5, "Configuring and Capturing Diagnostic Images." Once you have extracted the JFR file, you can view its contents in JRockit Mission Control.
For an example WLST script that retrieves the JFR file from a diagnostic image file and saves it to a local directory, see Section D.7, "Example: Retrieving a JFR File from a Diagnostic Image Capture."
3.5 Analyzing Flight Recorder Data in JRockit Mission Control
You use JRockit Mission Control to examine the contents of the Flight Recorder file after it has been extracted from the diagnostic image capture. The following sections highlight some of the capabilities of JRockit Mission Control’s graphical user interface, which provides a lot of tooling support for drilling down into the diagnostic data generated not only by WLDF for WebLogic Server events, but also from all other available event producers, including the JRockit JVM:
■ Section 3.5.1, "JFR Graphical User Interface"
■ Section 3.5.2, "Analyzing Execution Flow — A Sample Walkthrough"
■ Section 3.5.3, "Changing the Location of Temporary JFR Files"
For complete details about the JRockit Mission Control interface, see the Oracle JRockit Mission Control Online Help. See also Introduction to JRockit Mission Control Client.
3.5.1 JFR Graphical User Interface
JRockit Mission Control includes the JRockit Flight Recorder graphical user interface, which allows users who are running a Flight Recorder-compliant version of Oracle JRockit to view the JVM’s recordings, current recording settings, and runtime parameters. The JFR interface includes the Events Type View, which gives you direct access to event information that has been recorded in the JFR file, such as event producers and types, event logging and graphing, event by thread, event stack traces, and event histograms.
The Overview tab in the JFR interface is useful for analyzing a system’s general health because it can reveal behavior that might indicate bottlenecks or other sources of poor system performance. Figure 3–2 shows an example of the Overview tab in the Events Type View.
Note the following regarding the information shown in Figure 3–2:
■ The Events Type View is available by selecting the Events tab group icon.
■ The name of the Flight Recorder file appears at the top of the Overview tab. Note that the JFR is always named JRockitFlightRecorder.jfr, it is useful to rename it descriptively after downloading it from the diagnostic image capture.
■ The Event Types Browser, on the left side, is a tree that shows the available event types in a recording. It works in conjunction with the Events tab group to provide a means to select events or groups of events in a recording that might be of interest to you and to obtain more granular information on them.
Analyzing Flight Recorder Data in JRockit Mission Control
only WebLogic Server, event data from all non-WebLogic event producers is filtered out.
■ The range navigator, which is the graph displayed below the Overview tab title, is a timeline that shows all events in a recording that pertain to the data displayed on the selected tab. A set of buttons are available for adjusting the range of data that is displayed, which can simplify the process of drilling down into the details of Flight Recorder data.
■ The Producers section identifies each event producer that generated the data that is displayed. Metrics are included for each producer, indicating the volume of event activity generated by each as a proportion of the total set of event data displayed.
■ The Event Types section lists all events represented in the Overview tab, along with key metric data about each event.
Figure 3–2 Example Overview Page of JRockit Flight Recorder File in JRockit Mission Control
3.5.2 Analyzing Execution Flow — A Sample Walkthrough
This section shows an example of the steps that a developer or support engineer might use to identify the event activity associated with a particular request in a Web
application hosted on WebLogic Server. This example is not meant to recommend a specific way to diagnose performance problems, but simply shows how the JFR graphical user interface can be used to greatly simplify the process of locating and analyzing performance issues.
Analyzing Flight Recorder Data in JRockit Mission Control
3-8 Configuring and Using the Diagnostics Framework for Oracle WebLogic Server
■ Section 3.5.2.1, "Displaying Event Data for a Product Subcomponent"
■ Section 3.5.2.2, "Viewing the Event Log to Display Details"
■ Section 3.5.2.3, "Tracking Execution Flow by Analyzing an Operative Set"
■ Section 3.5.2.4, "Expanding the Operative Set and Viewing Correlated Diagnostic Data"
3.5.2.1 Displaying Event Data for a Product Subcomponent
When you start JRockit Mission Control and open a JFR file, you can use the Event Types View to quickly select the specific events you want to analyze. As you select and deselect items in the Event Types Browser (which is available in the Event Types View), the information displayed in the JFR graphical user interface is updated instantly to show information about only the selected event types.
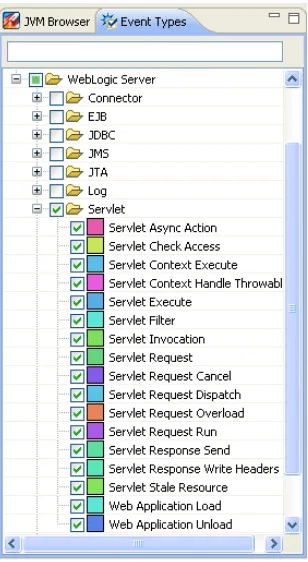
Figure 3–3 shows the Event Types Browser with only servlet event types selected.
Figure 3–3 Event Types Browser
3.5.2.2 Viewing the Event Log to Display Details
Analyzing Flight Recorder Data in JRockit Mission Control
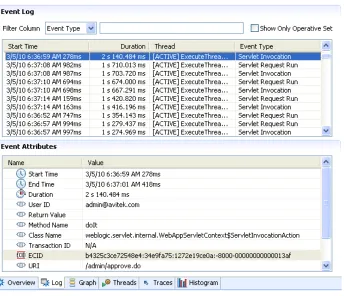
Figure 3–4 Servlet Event Log
When using the Log tab, you can view details about events as follows:
■ You can click on individual column heads in the Event Log table to modify the sort order of the events. For example, by clicking the Duration column, you can quickly identify the events that took the longest time to execute.
■ When you select an event in the Event Log table, details about that event are displayed in the Event Attributes table. For example, Figure 3–4 shows the following attributes:
– Event start, end, and duration times
– User ID of person who issued the request on the servlet
– Method, class name, and URI of invoked servlet
– Execution context ID (ECID)
Different event types have different attributes. For example, if this were a JDBC event, you could scroll among the attributes to see the SQL statement, the JDBC connection pool used, and the stack from which it was called. The interface makes it easy to scan for unexpected behavior that can be analyzed in deeper detail.
Analyzing Flight Recorder Data in JRockit Mission Control
3-10 Configuring and Using the Diagnostics Framework for Oracle WebLogic Server
3.5.2.3 Tracking Execution Flow by Analyzing an Operative Set
The JFR graphical user interface in JRockit Mission Control allows you to analyze the run-time trail of system activity that occurs as the result of a particular event. In this example, the run-time trail is analyzed by first defining an operative set. An operative set is any set of events that you choose to work in JRockit Mission Control.
In the example shown in this section, an operative set is created for the events that have the same execution context ID (ECID) attribute as the servlet invocation event selected in the Event Log table, shown in Figure 3–4. The operative set is then analyzed to see the execution flow that resulted from that servlet invocation. (Note that this operative set could be expanded to include events that match on different attributes as well; for example, events containing a specific SQL statement but not necessarily the same ECID.)
Figure 3–5 Operative Set Defined by Execution Context ID (ECID)
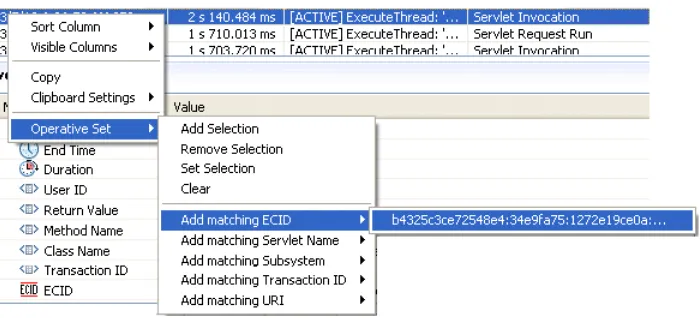
This operative set is defined by right-clicking the desired event in the Event Log, and then selecting Operative Set > Add matching ECID > ecid. See Figure 3–6.
Figure 3–6 Defining an Operative Set by Matching ECID
Analyzing Flight Recorder Data in JRockit Mission Control
Figure 3–7 Displaying an Operative Set
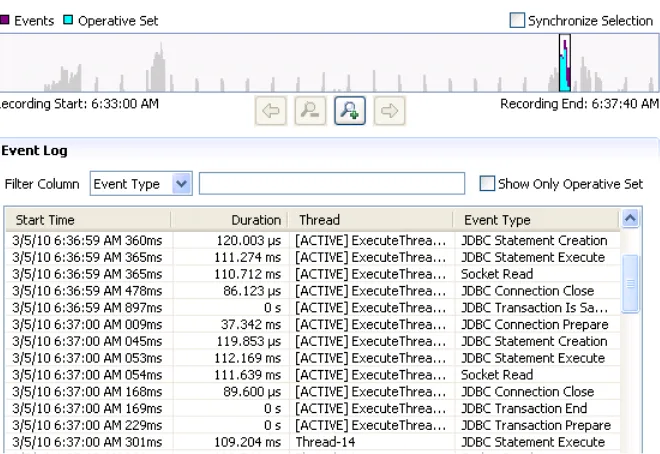
The run-time trail of execution flow that results from the request that generated the servlet invocation event can be viewed by including additional event types. For example, Figure 3–8 shows the operative set when all WebLogic Server event types are added, using the Event Type Browser, and listing the events in chronological order. (You can sort the events chronologically by selecting the Start Time column head.)
Figure 3–8 Adding all WebLogic Server Events to Operative Set
In this example, note a portion of the execution flow shown in the Event Log:
1. The servlet URI is invoked.
2. The servlet uses an EJB, which requires access to the database.
3. A JDBC connection is obtained and a transaction is started.
3.5.2.4 Expanding the Operative Set and Viewing Correlated Diagnostic Data
The operative set can be further analyzed by constraining the time interval of the execution flow and adding correlated events from additional producers. ByAnalyzing Flight Recorder Data in JRockit Mission Control
3-12 Configuring and Using the Diagnostics Framework for Oracle WebLogic Server
The time interval can be constrained by using the range selection bars in the range navigator. You can grab these bars with your pointer and drag them inward or
outward to change the range of events displayed in the Event Log. The range selection bars are activated when you hover your pointer over either end of the navigator, as shown in Figure 3–9.
Figure 3–9 Range Navigator Selection Bars
Events from additional producers, such as the JRockit JVM, can be selected in the Event Types Browser. Note that JVM events do not have ECID attributes, so they cannot be included among the WLDF events in the operative set. So to view the JVM events, you need to de-select Show Only Operative Set.
At this point the events that are displayed in the Event Log are those that occurred during the selected time interval but not correlated otherwise. Figure 3–10 shows drilling down into JDBC activity by selecting only JDBC events and JVM socket events. The Event Log is updated and listed in chronological order to show the socket activity that occurred simultaneously to the flow of the JDBC events in the selected time interval.
Figure 3–10 Adding JVM Events to JDBC Event Log
3.5.3 Changing the Location of Temporary JFR Files
The temporary JFR files created in the operating system’s temp directory are managed directly by JRockit. WLDF does not control these files. (By default, WLDF temporary files related to JFR recordings are placed in the DOMAIN_NAME\servers\SERVER_ NAME/server/logs/diagnostic_images directory.)
Analyzing Flight Recorder Data in JRockit Mission Control
-XX:FlightRecorderOptions=repository=path
Analyzing Flight Recorder Data in JRockit Mission Control
4
4
Understanding WLDF Configuration
The WebLogic Diagnostics Framework (WLDF) provides features for generating, gathering, analyzing, and persisting diagnostic data from WebLogic Server instances and from applications deployed to them. For server-scoped diagnostics, some WLDF features are configured as part of the configuration for a server in a domain. Other features are configured as system resource descriptors that can be targeted to servers (or clusters). For application-scoped diagnostics, diagnostic features are configured as resource descriptors for the application.
The following sections provide an overview of WLDF configuration:
■ Section 4.1, "Configuration MBeans and XML"
■ Section 4.2, "Tools for Configuring WLDF"
■ Section 4.3, "How WLDF Configuration Is Partitioned"
■ Section 4.4, "Configuring Diagnostic Image Capture and Diagnostic Archives"
■ Section 4.5, "Configuring Diagnostic Image Capture for JRockit Flight Recorder"
■ Section 4.6, "Configuring Diagnostic System Modules"
■ Section 4.7, "Configuring Diagnostic Modules for Applications"
■ Section 4.8, "WLDF Configuration MBeans and Their Mappings to XML Elements"
For general information about WebLogic Server domain configuration, see Understanding Domain Configuration for Oracle WebLogic Server.
4.1 Configuration MBeans and XML
As in other WebLogic Server subsystems, WLDF is configured using configuration MBeans (Managed Beans), and the configuration is persisted in XML configuration files. The configuration MBeans are instantiated at startup, based on the configuration settings in config.xml. When you modify a configuration by changing the values of MBean attributes, those changes are saved (persisted) in the XML files.
Tools for Configuring WLDF
4-2 Configuring and Using the Diagnostics Framework for Oracle WebLogic Server
For more information about WLDF Configuration MBeans, see Section 4.8, "WLDF Configuration MBeans and Their Mappings to XML Elements." For general
information about how MBeans are implemented and used in WebLogic Server, see "Understanding WebLogic Server MBeans" in Developing Custom Management Utilities With JMX for Oracle WebLogic Server.
4.2 Tools for Configuring WLDF
As with other WebLogic Server subsystems, there are several ways to configure WLDF:
■ Use the Administration Console to configure WLDF for server instances and clusters. See "Configure the WebLogic Diagnostics Framework" in the Administration Console Online Help.
■ Write scripts to be run in the WebLogic Scripting Tool (WLST). For specific
information about using WLST with WLDF, see Appendix D, "WebLogic Scripting Tool Examples." Also see Oracle WebLogic Scripting Tool for general information about using WLST.
■ Configure WLDF programmatically using JMX and the WLDF configuration MBeans. See Chapter 16, "Configuring and Using WLDF Programmatically," for specific information about programming WLDF. See Oracle WebLogic Server MBean Reference and browse or search for specific MBeans for programming reference.
■ Edit the XML configuration files directly. This documentation explains many configuration tasks by showing and explaining the XML elements in the configuration files. The XML is easy to understand, and you can edit the configuration files directly, although it is recommended that you do not. (If you have a good reason to edit the files directly, you should first generate the XML files by configuring WLDF in the Administration Console. Doing so provides a blueprint for valid XML.)
4.3 How WLDF Configuration Is Partitioned
You can use WLDF to perform diagnostics tasks for server instances (and clusters) and for applications.
4.3.1 Server-Level Configuration
You configure the following WLDF components as part of a server instance in a domain. The configuration settings are controlled using MBeans and are persisted in the domain's config.xml file.
■ Diagnostic Image Capture
■ Diagnostic Archives
See Section 4.4, "Configuring Diagnostic Image Capture and Diagnostic Archives."
You configure the following WLDF components as the parts of one or more diagnostic system modules, or resources, that can be deployed to one or more server instances (or clusters). These configuration settings are controlled using Beans and are persisted in
Note: If you make changes to a configuration by editing
Configuring Diagnostic Image Capture and Diagnostic Archives
one or more diagnostic resource descriptor files (configuration files) that can be targeted to one or more server instances or clusters.
■ Harvester (for collecting metrics)
■ Watch and Notification
■ Instrumentation
See Section 4.6, "Configuring Diagnostic System Modules."
4.3.2 Application-Level Configuration
You can use the WLDF Instrumentation component with applications, as well as at the server level. The Instrumentation component is configured in a resource descriptor file deployed with the application in the application's archive file. See Section 4.7,
"Configuring Diagnostic Modules for Applications."
4.4 Configuring Diagnostic Image Capture and Diagnostic Archives
In the config.xml file for a domain, you configure the Diagnostic Image Capture component and the Diagnostic Archive component in the <server-diagnostic-config> element, which is a child of the <server> element in a domain, as shown in
Example 4–1.
Example 4–1 Sample WLDF Configuration Information in the config.xml File for a Domain
<domain> <server>
<name>myserver</name>
<server-diagnostic-config>
<image-dir>logs/diagnostic_images</image-dir> <image-timeout>3</image-timeout>
<diagnostic-store-dir>data/store/diagnostics</diagnostic-store-dir> <diagnostic-data-archive-type>FileStoreArchive
</diagnostic-data-archive-type> </server-diagnostic-config>
</server>
<!-- Other server elements to configure other servers in this domain --> <!-- Other domain-based configuration elements, including references to WLDF system resources, or diagnostic system modules.
See Example 4–2. --> </domain>
For more information, see the following:
■ Chapter 5, "Configuring and Capturing Diagnostic Images"
■ Chapter 6, "Configuring Diagnostic Archives"
Configuring Diagnostic Image Capture for JRockit Flight Recorder
4-4 Configuring and Using the Diagnostics Framework for Oracle WebLogic Server
4.5 Configuring Diagnostic Image Capture for JRockit Flight Recorder
If WebLogic Server is configured with Oracle JRockit R28 or later, and JRockit Flight Recorder is not explicitly disabled, the JFR file is automatically included in the diagnostic image capture. The JFR file contains data from all event producers that are enabled. However, the amount of WebLogic Server event data that is included in the JFR file is determined by the configuration of the WLDF diagnostic volume.
To include WebLogic Server event data in the JFR file:
1. Ensure that WebLogic Server is configured with Oracle JRockit R28, which is available from the WebLogic Server installation program.
For information, see Oracle WebLogic Server Installation Guide.
2. Ensure that JFR flight recording is not disabled in JRockit.
In a default installation of Oracle JRockit, Flight Recorder operates in Default Data Gathering Mode. No JRockit settings are required to have JVM events included in the JFR file.
For information, see Oracle JRockit Flight Recorder Run Time Guide.
3. Set the WLDF diagnostic volume as appropriate. For general use, Oracle
recommends the default setting of Low. However, you can increase the volume of WebLogic Server event data that is generated, as appropriate, by setting the volume to Medium or High.
Note that the WLDF diagnostic volume setting has no impact on data recorded for other event producers, such as the JVM.
For information, see "Configure WLDF diagnostic volume" in Oracle WebLogic Server Administration Console Help.
4.6 Configuring Diagnostic System Modules
To configure and use the Instrumentation, Harvester, and Watch and Notification components at the server level, you must first create a system resource called a diagnostic system module, which will contain the configurations for all those components. Keep in mind that:
■ System modules are globally available for targeting to servers and clusters configured in a domain.
■ In a given domain, you can create multiple diagnostic system modules with distinct configurations.
■ At most, one diagnostic system module can be targeted to any given server or cluster.
Note: By default, the WLDF diagnostic volume is set to Low.
Configuring Diagnostic System Modules
4.6.1 The Diagnostic System Module and Its Resource Descriptor
You create a diagnostic system module through the Administration Console or the WebLogic Scripting Tool (WLST). It is created as a WLDFResourceBean, and the configuration is persisted in a resource descriptor file (configuration file), called DIAG_MODULE.xml, where DIAG_MODULE is the name of the diagnostic module. You can specify a name for the descriptor file, but it is not required. If you do not provide a file name, a file name is generated based on the value in the descriptor file's <name> element. The file is created by default in the DOMAIN_
NAME\config\diagnostics directory, where DOMAIN_NAME is the name of the domain's home directory. The file has the extension .xml.
For instructions on creating a diagnostic system module, see "Create diagnostic system modules" in the Oracle WebLogic Server Administration Console Help.
4.6.2 Referencing the Diagnostics System Module from Config.xml
When you create a diagnostic system module using the Administration Console or the WebLogic Scripting Tool (WLST), WebLogic Server creates it in DOMAIN_
NAME/config/diagnostics, and a reference to the module is added to the domain's config.xml file.
The config.xml file can contain multiple references to diagnostic modules, in one or more <wldf-system-resource> elements. The <wldf-system-resource> element includes the name of the diagnostic module file and the list of servers and clusters to which the module is targeted.
For example, Example 4–2 shows a config.xml file with a module named
myDiagnosticModule targeted to the server myserver and another module named newDiagnosticMod targeted to servers ManagedServer1 and ManagedServer2.
Example 4–2 Sample WLDF Configuration Information in the Config.xml File for a Domain
<domain>
<!-- Other domain-level configuration elements --> <wldf-system-resource
xmlns="http://xmlns.oracle.com/weblogic/weblogic-diagnostics">
<name>myDiagnosticModule</name> <target>myserver</target>
<descriptor-file-name>diagnostics/MyDiagnosticModule.xml </descriptor-file-name>
<description>My diagnostic module</description>
Note: The diagnostic module conforms to the diagnostics.xsd schema, available at
http://xmlns.oracle.com/weblogic/weblogic-diagnostic s/1.0/weblogic-diagnostics.xsd.