http://dx.doi.org/10.18196/jgp.8149
Faculty of Business Administration and Communication Sciences, Universitas Katolik Indonesia Atma Jaya, Jakarta. Indonesia [email protected]
ABSTRACT
This study is intended to examine the impacts of productive expenditures on economic growth on the 25 provinces found in Indonesia before fiscal decen- tralization (covering 1994–1997) and 33 provinces after decentralization over the period 2011-2015. The empiric approach has been implemented through a panel data approach and regression model estimated to follow the endogenous growth model of Barro (1990). The main findings of this research show that: (1) provi cial gover e ts’ productive expe ditures i educatio pro oted eco- nomic growth in the 25 pre-decentralization provinces; and (2) productive ex- penditures in the security and public order sector, health and education sector have promoted economicgrowthinthe 33 post-decentralization provinces. From these results, it can be concluded that this study has contributed to economic literature by indicating that different types of productive government expendi- tures offer different impacts on economic growth. The policy implications which can be formulated from the results of this study are that provincial governments should promote and provide incentives for private investments in the public sec- tor because only the education sector (before fiscal decentralization) and the security and public order sector as well as the education sector (after fiscal de- centralization) have a statistically significant role in promoting economic growth. This can be realized through public–private partnership, which has greatly in- creased the performance of public-sector investment around the world. Future research, using relevant control variables to estimate the effects of productive expenditures on economic growth, will provide a greater empiric contribution to the literature.
Keywords: productive expenditures, economic growth, fiscal decentralization. JEL Classification: H11, O40, H5.
JURNAL STUDI PEMERINTAHAN
(JOURNAL OF GOVERNMENT & POLITICS)
1
Vol. 8 No. 1 February 2017
2
ABSTRAK
Penelitian ini dimaksudkan untuk menguji dampak dari produktivitas pertumbuhan ekonomi di 25 provinsi yang ada di Indonesia sebelum desentralisasi fiskal (meliputi 1994- 1997) dan 33 provinsi setelah desentralisasi selama periode 2011-2015. Pendekatan empiris ini telah dilaksanakan melalui pendekatan data panel dan model regresi yang diperkirakan mengikuti model pertumbuhan endogen Barro (1990). Temuan utama dari penelitian ini menunjukkan bahwa: (1) pengeluaran produktif pemerintah provinsi dalam pendidikanmempromosikanpertumbuhanekonomidi25provinsipra-desentralisasi;dan (2)produktif penditures dalam keamanan dan ketertiban sektor publik, kesehatan dan sektor pendidikan yang telah mendorong pertumbuhan ekonomi di 33 provinsi pasca- desentralisasi. Darihasil tersebut, dapat disimpulkan bahwa penelitianini telah memberikan kontribusi terhadap literatur ekonomi dengan menunjukkan bahwa berbagai jenis tulisan peerintah secara produktif mengeluarkan tawaran dampak yang berbeda terhadap pertumbuhan ekonomi. Implikasi kebijakan yang dapat dirumuskan dari hasil penelitian ini adalah bahwa pemerintah provinsi harus mempromosikan dan memberikan insentif bagi investasi swasta di sektor publik karena hanya sektor pendidikan 9sebelum desentralisasi fiskal) dankeamanan dan ketertiban umumsertasektorpendidikan (setelah desentralisasi fiskal) yang memiliki peran signifikan secara statistik dalam meningkatkan pertumbuhan ekonomi. Hal ini dapat diwujudkan melalui kemitraan sektor privat yang telah sangat sangat berpengaruh pada kinerja sektor publik di dunia. Penelitian kedepannya, dapat menggunakan variabel kontrol yang relevan untuk memperkirakan efek dari pengeluaran produktivitas terhadap pertumbuhan ekonomi yang akan memberikankontribusi empirislebih besar untukliteratur.
Kata Kunci: belanja produktif, pertumbuhan ekonomi, desentralisasi fiskal. JEL Classification: H11, O40, H5.
INTRODUCTION
The role of government in promoting economic growth has long been the subject of discussion within the field of public economics. For years, empirical literature has discussed this fun- damental question, which is frequently subject to debate: how can government expenditures promote economic growth? Gov-
ernment expenditures1 refer to the financial resources allocated
by governments to fund development and economic activities
(World Bank, 1997). Meanwhile, economic growth is well-un-
derstood as an indicator of the economy‘s efficiency at the macro
expenditures or through tax cuts, will also increase productive economic activities.
Much research has examined the relationship between public expenditures and economic growth. These include the impor- tant findings regarding how government expenditures promote
economic growth made by Barro (1990) and Barro and Sala-i-
Martin (1995). The research of Barro (1990), known for intro-
ducing the ―endogenous growth model‖, is a pioneering work of
economic research into the effect of public sector expenditures on economic growth. It finds that increased government expen- ditures for non-productive sectors correlate with low per capita income, whereas productive government expenditures have a positive correlation with long-term economic growth
(Barro, 1990, Barro & Sala-i-Martin, 1995). Based on their
findings, it can be concluded that governments can use public/government expen- ditures as policy instruments for promoting economic growth.
Indonesia introduced decentralization policy in 1999 through the enactment of two laws: Law No. 22/1999 regarding Local
Governments and Law No. 25/1999 on Fiscal Decentralization2.
The first law grants greater autonomy and devolves responsibili- ties to local governments in all fields except foreign policy, de- fense and security, justice, monetary, debt, fiscal matters, and religious affairs. The latter law sets a new direction on intergov- ernmental financial relationship between central and local gov-
ernment in Indonesia (Brojonegoro & Asanuma, 2003; Suharyo,
2009). Theory provides two arguments for fiscal decentraliza-
tion: (1) economic efficiency and (2) a better provision of public goods and services. First, fiscal decentralization creates economic efficiency because local governments are better positioned than national governments to deliver public services given their infor- mation advantage; this is known as the preference-matching ar-
gument. Tiebout (1956) and Oates (2008) divided the basic eco-
nomic argument on fiscal decentralization into twostrands. First, decentralization will increase economic efficiency because local governments are in better positions than the national
govern-JURNAL STUDI PEMERINTAHAN (JOURNAL OF GOVERNMENT & POLITICS)
Vol. 8 No. 1 February 2017
4
ment to deliver public services because of the information ad- vantage. As a result, local governments are more capable than central governments in getting the information on local prefer-
ences and needs (Faguet, 2001). Second, under decentralization,
population mobility and competition among local governments for delivery of public services will ensure the matching of prefer-
ences of local communities and local governments (Oates; 1972;
Tiebout, 1956, as cited in Davoodi & Zou, 1998, p.244). This
matching of preferences may improve allocative efficiency because public services provided by the local government will be better matched to the preferences of the residents of those localities
(Lockwood, 2006).
Literature on fiscal federalism suggests one of the measure- ments of fiscal decentralization is the expenditure assignment to local governments. Expenditure assignment means how spend- ing should be spread among levels of government, or what ex- penditures should be retained by the central government, and what expenditures should be transferred to sub-national levels of government. What is clear in the literature is that the assign- ment of expenditure responsibility should precede revenue au- tonomy, particularly taxing power. This is because the division of taxing power, besides being based on principles of tax assign- ment, should be determined by the requirements of different spending agencies. Decentralization of tax powers based on ex- penditure responsibilities is desired so that sub-national govern- ments do not have to rely exclusively on intergovernmental trans- fers to finance their expenditures. The linking of revenue and expenditure decisions at lower levels of government is consid- ered important to preserve the incentive to provide public ser-
vices in a cost-effective manner (Shah, 1994). Sidik (2007, pp.190-
192) provided two different approaches in expenditure assign-
objec-tive criteria such as the degree of local impact of the function in question, considerations of policy and administrative uniformity, general technical and managerial capacity, the existence of spa- tial externalities or spillovers associated with the function, and of economies of scale, among otherconsiderations.
The implementation of fiscal decentralization in 2001 gave regional governments in Indonesia great authority to determine their own budget policies. Regional governments at both the provincial and regency/municipal level thus have broad author- ity and power in implementing budgets appropriate for the pro- motion of economic growth and development within their juris- dictions. One implication of this decentralization is that regional economic growth has become increasingly vital. The fiscal poli- cies examined in this study are those regarding public expendi- tures policies for the productive sectors that may influence eco- nomic growth at the provincial level. If stable economic growth is realized, through the spending multiplier regional economic growth will likewise be ensured.
As such, the research questions which will be answered are as follows:
1. What were the trends of provincial government productive
expenditures in Indonesia before and after decentralization?
2. What were the impacts of provincial government productive
expenditures on public service; (2) security and public order;
(3)economy; (4) environment; (5) housing and public facili-
ties; (6) health; and (7) education sector on economic growth on economic growth before and afterdecentralization? This study is intended to examine the effects of productive public expenditures on economic growth across provinces in Indonesia. More specifically, this study focuses on these two goals;
(i)to investigate the trends and compositions of productive gov-
ernment expenditures in Indonesia before and after decentrali- zation, and (ii) to analyze the impacts of provincial government productive expenditures on public service, security and public order, economy, environment, housing and public facilities,
JURNAL STUDI PEMERINTAHAN (JOURNAL OF GOVERNMENT & POLITICS)
Vol. 8 No. 1 February 2017
6
health, and education sector on on economic growth before and after decentralization in Indonesia. Previous research into pub- lic expenditures and economic growth in Indonesia has focused more on the relationship between central government expendi-
tures and national economic growth (among others Nurlina,
2015; Ramayandi, 2003). To the best of the author‘s knowledge,
no study has analyzed the relationship between government ex- penditures and economic growth at a local level, especially after decentralization. Such research is important because, after de- centralization in 2001, local governments (at the provincial and regency/city level) have maintained their own fiscal authority and responsibility. Theoretically, fiscal and revenue assignment handled by local governments should have a positive contribu- tion on regional economic growth, as decentralization will allow for more efficient regional economies and for regional govern- ments to ensure fiscal efficiency in providing public services
(Oates, 1972, 1992). As such, the results of this study will con-
tribute greatly to provincial governments in Indonesia by reveal- ing the different effects of productive government expenditures on local economic growth, both before and after decentraliza- tion. In other words, the results of this study will reveal the effec-
tiveness of provincial governments‘ fiscal policies in promoting
economic growth before and afterdecentralization.
Studies by Nurlina (2015) and Ramayandi (2003) analyzed
in Indonesia to be revealed. This study utilizes the advantages of panel data, accounting for unobserved individual (provincial) heterogeneity, reducing collinearity, improving efficiency, reli- ability and stability of econometrics estimates, and identifying and measuring effects not detectable in a cross-sectional or a time-series methods. Failure to use panel models when appropri- ate is a model misspecification error resulting in biased estimates
and unreliable diagnostic statistics (Baltagi, 2008; Greene, 2008;
Wooldridge, 2002). Hence, the use of panel regression also dis-
tinguishes the present study from that of Nurlina (2015) and
Ramayandi (2003) and helps improve the knowledge and under-
standing of the association of productive expenditure and eco- nomic growth in the context of fiscal decentralization in Indo- nesia.
THEORETICAL FRAMEWORK
ROLE OF GOVERNMENT IN THE ECONOMY
Governments can influence the economy through various economic policies, including fiscal policies. Fiscal policies are those policies which are partly implemented by governments by budgeting specific expenditures to achieve macro-economic goals such as job creation, sustained economic growth, and price level
stability (Parkin, 2014). Gwartney, Lawson and Holcombe (1998)
find that governments‘ main functions in the economy are to
create economic efficiency and promote economic growth. These main functions can be divided into two categories: the protec- tive functions of government and the provision of publicgoods
(Lin, 1994, Anomaly, 2015). The functions of governments are
discussed comprehensively by Musgrave (1959), who identifies
three main government functions: stabilization, distribution and allocation. Stabilization and distribution functions are usually beyond the control of the state or local government and are managed at the national level of government, while the alloca- tion function is the basic concern of the local government. The governments act beyond these three functions to affect the
JURNAL STUDI PEMERINTAHAN (JOURNAL OF GOVERNMENT & POLITICS)
Vol. 8 No. 1 February 2017
8
economy (Gwartney, Lawson, & Holcombe, 1998). More impor-
tantly, the government performs these functions in order to over- come market failure and market imperfections and to ensure equality by insisting on the basic rights of citizens to receive cer-
tain services, the last being called the ‗welfare roles of govern-
ment‘ (Aulich & Nutley, 2001, pp.2-4).
Viewed as institutional units, the principal functions of gov- ernment are to assume responsibility for the provision of goods and services to the community or to individual households and to finance their provision out of taxation or other incomes, to redistribute income and wealth by means of transfers, and to
engage in non-market production (European Communities, et
al., 2009: 436). According this definition, a government unit
has the authority to raise funds from taxes or compulsory trans- fers from other institutional units, and it has authority to dis-
burse such funds in the pursuit of its policy objectives (Euro-
pean Communities et al. 2009, p.436).
However, if governments take too great a role outside of their main function of governance, then this involvement can have negative implications for the economy. This may occur, for in- stance, if governments implement fiscal policies such as increas- ing taxes or loans; both acts can cause economic distortion. Too large a government, realised through high government spending (particularly if allocated for non-productive sectors) will lead to
negative economic returns and slow economic growth (Gallaway
& Wedder, 1998; Gwartney, Lawson & Holcome, 1998). Gov-
ernments can use their expenditure budgets, also known as pub- lic sector spending, or government purchases, to fulfill their func-
tions. According to Gwartney, Lawson, and Holcome (1998:4),
expendi-tures is more influenced by political factors than economic con- siderations (i.e. market forces), government expenditures will result in negative economic growth. The concept of diminishing returns can be used to explain how increased government expen- ditures can have negative implications for the economy. Govern- ments that focus initially on the productive sector and attempt to create an efficient market can maximally promote economic growth. Meanwhile, governments which use their expenditures to provide public needs that are already handled by the private sector, such as food, housing, and healthcare, will ultimately ex- perience negative returns.
THE CHANNEL THROUGH WHICH GOVERNMENT EX- PENDITURES AND FISCAL DECENTRALIZATION AF- FECTS ECONOMIC GROWTH
Economic growth is one of indicators of the efficiency of a
country‘s economy, as measured by Gross Domestic Product
(GDP) and GDP per capita. High economic growth indicates a
country‘s increased ability to produce goods and services and, in
turn, causes an increase in that country‘s output and revenue
(Todaro & Smith, 2003). Governments, through their economic
policies, have an important role in promoting the capacity and
rapid growth of the economy. Governments‘ contributions
through expenditure policies are best discussed by Wagner and
Weber (1997) and Keynes (1936). Adolph Wagner, a German
economist, was the first to find a positive relationship between government expenditures and economic growth. His findings
are known as Wagner‘s Law, the law of increasing state activity
or the law of the expanding state role. Even today, Wagner‘s Law
remains a common theoretical point of reference in efforts to explore the association between government expenditures and economic growth.
According to Wagner, increases in public expenditures are a natural consequence of economic growth, when said economic
growth outpaces growth in total output. Increases in a country‘s
JURNAL STUDI PEMERINTAHAN (JOURNAL OF GOVERNMENT & POLITICS)
Vol. 8 No. 1 February 2017
10
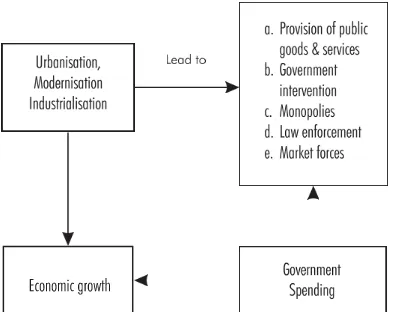
per capita income may occur because of urbanization, modern- ization, and industrialization. These processes promote growth in the public sector because, when they occur, governments must improve the availability of public goods and services. Conse-
quently, governments intervene in public funding (Abizadeh &
Gray, 1985; Bird, 1971). Furthermore, Wagner views economic
growth as being the fundamental determinant of public sector growth. In other words, public expenditures are endogenous to economic growth because urbanization, modernization, and in- dustrialization are all external factors which promote increased public expenditures. This may be expressed mathematically through the formula G = f (Y ), in which G is government
ex-t t
penditures as a measure of the public sector, Y is economic effi-ciency, and t is time. Increased revenues in a country will be followed by increases in the public sector as well as developments in culture and the economy. Governments must, as these devel- opments occur, improve public services such as education, infra- structure, and transportation (Figure 1).
FIGURE 1.THE ASSOCIATION OF GOVERNMENT EXPENDITURE AND ECONOMIC GROWTH
Source: author’s view based on Wagner’s Law, cited in Sijabat (2015).
The Keynesian approach to the government‘s role in the
(Keynes, 1936), that is known as ―General Theory‖. Keynes ar- gues that fiscal policy, through increased government expendi- tures, will contribute positively to economic growth. Increased expenditures affect economic growth through the multiplier ef- fect, as increases in government spending will mobilize the pri- vate sector, create new jobs, and ultimately promote increased aggregate demand. For Keynes, State activity is an exogenous
factor that contributes to economic development. Keynes‘ ap- proach may be written mathematically using the formula GDP = C + I + G for a closed economy, with GDP being the national income/output, C being household consumption, I being pri- vate-sector activities, and G being government activities. From this formula, it is apparent that income/output is the total of C, I, and G. Consequently, increased government expenditures (G) will promote increased aggregate demand (GDP). Public policy, through increased government expenditure or decreased taxes, promotes increased economic activity, particularly in economies
which have slowed. Fiscal policies‘ effect of increasing aggregate
demand will promote increased production capacity, thus lead- ing to job creation and ultimately increased household revenue and consumption. As such, the Keynesian approach emphasizes that public policy will promote increased short-term economic
stability and long-term economic growth (Snowdon & Vane,
2005).
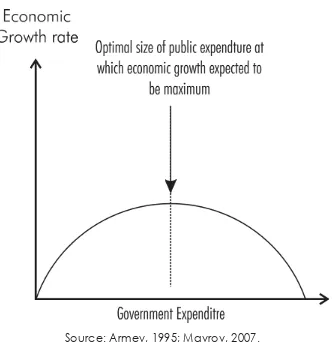
The association between government expenditures and eco- nomic growth may also be examined using the Armey Curve,
first introduced by Richard Armey (1995). According to Armey,
the relationship between government expenditures and economic growth is parabola-shaped or an inversely U-shaped. The U- shaped occurs based on the law of diminishing returns in ex- plaining government roles in economy, if government plays no role in the economy, then the output produced will be low and lead to zero economic growth. However, if the government in- creases its expenditures, positive economic growth will be real-
ized, as shown by Mavrov (2007) and Arpaia and Turrini (2008).
JURNAL
STUDI PEMERINTAHAN
(JOURNAL OF GOVERNMENT & POLITICS)
Vol. 8 No. 1 February 2017
12
Increased government expenditures promote economic growth because expansive fiscal policies offer an incentive to the economy. Economic growth will be most rapid at the beginning, then slow and ultimately peak. Once economic growth has peaked, increased government expenditures will slow economic
growth. This is known as the law of diminishing returns (Facchini
& Melki, 2011; Mavrov, 2007; Magazzino, 2014).
FIGURE 2. THE ARMEY CURVE
Source: Armey, 1995; Mavrov, 2007.
The literature on fiscal decentralization discusses the impact of fiscal decentralization on economic growth through the allo-
cation of public resources as argued in Tiebout (1956)
(Cheikbossian, 2008). Tiebout suggests that the allocation of
different bundle of local public services, each such service bundle
reflecting local preferences. Tiebout‘s argument implies that
mobility of voters is sufficient to ensure efficient allocation of public resources.
In Tiebout‘s analysis, taxpayers move in order to avoid higher taxes and to advantage themselves through inter-jurisdictional competition, thereby limiting the excessive taxing powerof gov- ernments. Assuming people are mobile, therefore, competition for mobile people should match bundles of public goods to citi-
zens‘ preferences. Tiebout claimed that in a system with many jurisdictions, competition among local jurisdictions would en- sure efficiency in the production of local public goods and also in the distribution of total population over communities.
Tiebout‘s theory on fiscal federalism also focuses on the eco- nomic efficiency of intergovernmental relationships. In his theory, Tiebout provided an explanation of the advantages of distributing power to the lowest level of government. By distrib- uting some functions to the lowergovernment levels, for example the provision of public services, the degree of efficiency in the allocation of resources would increase. Over the long term, effi- ciency gains from the local delivery of public services would lead
to faster local, as well as national, economic growth (Oates, 1972).
In addition, theory explains that fiscal decentralization will create inter-jurisdictional spillover, also known as spillover ef- fects. According to this view, more resources should be allocated to regions that undertake public expenditures benefiting resi- dents of other regions and not only their own residents. This is with particular regard to the provision of public services. If travel costs are low, public goods are non-excludable where residents can obtain utility from the public goods provided in their own municipality as well as from those supplied in neighboring mu- nicipalities. Consequently, all residents of that municipality are able to consume the full benefits of the public goods provision because they cannot be excluded from the benefits. Thus, if there are spillovers from local public goods provision, residents of one
JURNAL STUDI PEMERINTAHAN
(JOURNAL OF GOVERNMENT & POLITICS)
Vol. 8 No. 1 February 2017
14
municipality may migrate outside their municipality and enjoy the services provided elsewhere. A key point in spillovers litera- ture suggests that spillover benefits that may occur from fiscal decentralization can be achieved when lower-level jurisdictions of government ensure cooperation among one another in pro- viding public goods and services. Such cooperation is important to avoid free riding in the provision of public services, thus en- hancing local economicdevelopment.
EMPIRICAL EVIDENCE FROM PREVIOUS STUDIES
Above, it has been explained that government expenditures may have a negative or positive association with economic growth. Empirical studies have proven this. Positive associations between government expenditures, specifically productive ones, and eco-
nomic growth have been shown by, among others, Barro (1990),
Monteiro and Turnovsky (2008), and Alshahrani and Alsadiq
(2014). Components of productive expenditures with a negative
association to economic growth have been examined by Mura
(2014), Bergh and Henrekson (2011), and Saad and Kalacech
(2009).
As stated above, no research project to date has focused spe- cifically on the contributions of productive government expen- ditures to economic growth in Indonesia. However, two research projects have examined the effects of government expenditures in general on economic growth in the country, namely thoseby
Nurlina (2015) and Ramayandi (2003). In her study, Nurlina
(2015) examines the effects of government expenditures oneco-
nomic growth between 2004 and 2013 using an OLS approach, with the GDP as the dependent variable and government expen- ditures (both capital expenditures and routine expenditures) as the independent variables. Nurlina shows a significant positive association between government expenditures and economic
growth. Similarly, Ramanyandi (2003), who uses time series
(pro-ductive and non-pro(pro-ductive) on economic growth. Ramayandi shows that non-productive government expenditures have a nega- tive effect on economic growth.
Alshahrani and Alsadiq (2014) also examine the impact of
government spending on economic growth by using a macroeco- nomic model covering two sectors, private (P) and government
(G). They examined government expenditures‘ effects on eco- nomic growth between the years of 1969 and 2010. Using the
model developed by Ram (1986), they showed that the
government‘s output is determined by the total labor force (L) and capital (K), whereas private-sector output is determined by external factors within the public (government) sector. This study shows that public expenditures, in the form of domestic invest- ments, public investments, and healthcare investments have a positive effect on economic growth in the long term. Meanwhile, housing expenditures have a positive effect on economic growth in the short term.
Using a multivariate cointegration analysis, Saad and Kalacech
(2009) estimate the long-term and short-term effects of govern-
ment expenditures—specifically, spending on health, the military,
education, and agriculture—on economic growth in Lebanon
between 1962 and 2007. Their study indicates that government expenditures on education have a positive effect on economic growth over the long term, but a negative effect in the short term. Meanwhile, government expenditures have a negative effect on economic growth over the long term and no significant effect over the short term; this holds true for expenditures on health as well. Based on these results, Saad and Kalacech emphasize the importance of increasing public expenditures on education, as this sector has been shown to promote economicgrowth.
The influence of government expenditures on economic
growth was also examined by Andres and Guerra (2005), who
surveyed public expenditures on health in 52 countries in Eu- rope, the Americas, and Asia between 1970 and 1990. This study used the Ordinary Least Square and Generalized Least Square
JURNAL STUDI PEMERINTAHAN
(JOURNAL OF GOVERNMENT & POLITICS)
Vol. 8 No. 1 February 2017
16
approaches to investigate the effects of these government expen- ditures on economic growth. Their survey results indicated that fiscal policies involving government expenditures for health are
important for economic growth. Monteiro and Turnovsky (2008)
analyze the influence of productive public expenditures allocated as public investment in education and infrastructure. Produc- tive expenditures in these sectors increase final economic out- put, as they promote increased productivity (human capital). Monteiro and Turnovsky use an endogenous model of economic growth with two sectors: physical capital and human capital funded by public expenditures. They identify physical capital as the final output produced through the use of human capital, physical capital, and government expenditures in public infra- structure. Human capital, meanwhile, is produced in the educa- tion sector using human capital, physical capital, and also gov- ernment expenditures in the education sector. Investments in human and physical capital will increase productivity. In this study, Monteiro and Turnovsky apply the concepts of welfare- maximizing expenditure and growth-maximizing expenditure and find a long-run growth-maximizing and welfare-maximizing ex- penditure rate as well as an allocation of government expendi- tures for productive capital. The welfare maximizing rate is lower than growth-maximizing expenditure rate, as are government expenditures. The two-sector model applied shows steady state growth rates and steady state welfare rates, funded both through taxation and through public spending. This indicates a trade-off between economic growth and welfaremaximization.
Bergh and Henrekson (2011) research the association between
GOVERNMENT & POLITICS)
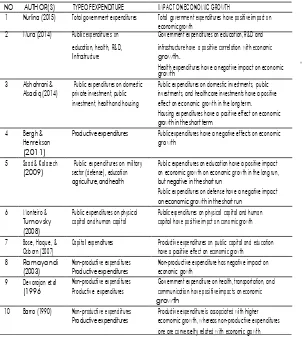
TABLE 1. SUMMARY OF SELECTED EMPIRICAL LITERATURE JURNAL STUDI PEMERINTAHAN
NO AUTHOR(S) TYPE OF EXPENDITURE IMPACT ON ECONOMIC GROWTH (JOURNAL OF
1 Nurlina (2015) Total government expenditures Total government expenditures have positiveimpact on economic growth
2 Mura (2014) Public expenditures on Government expenditures on education, R&D and
education, health, R&D, infrastructure have a positive correlation with economic
17
Infrastructure growth.Health expenditures have a negative impact on economic growth
3 Alshahrani & Public expenditures on domestic Public expenditures on domestic investments, public Alsadiq (2014) private investment, public investments, and healthcare investments have a positive
investment, health and housing effect on economic growth in the long term. Housing expenditures have a positive effect on economic growth in the short term
4 Bergh & Productive expenditures Public expenditures have a negative effects on economic
Henrekson growth
(2011)
5 Saad & Kalacech Public expenditures on military Public expenditures on education have a positive impact (2009) sector (defense), education on economic growth on economic growth in the long run,
agriculture, and health but negative in the short run
Public expenditures on defense have a negative impact on economic growth in the short run
6 Monteiro & Public expenditures on physical Public expenditures on physical capital and human Turnovsky capital and human capital capital have positive impct on conomic growth (2008)
7 Bose, Haque, & Capital expenditures Productive expenditures on public capital and education Osborn (2007) have a positive effect on economic growth 8 Ramayandi Non-productive expenditures Non-productive expenditure has negative impact on
(2003) Productive expenditures economic growth
9 Devarajan et al Non-productive expenditures Government expenditure on health, transportation, and (1996 Productive expenditures communication have positiveimpacts on economic
growth
10 Barro (1990) Non-productive expenditures Productive expenditure is assopciated with higher Productive expenditures ecomomic growth, whereas non-productive expenditures one are converselty related with economic growth
Source: Own table based on various literature.
loans, both of which are disincentives for workers and decrease aggregate demand. Using panel data collected from thirty devel-
oping countries between the 1970s and 1980s, Bose, Haque, and
Osborn (2007) analyze the effects of government expenditures
Vol. 8 No. 1 February 2017
18
investment have no significant impact on economic growth after
controlling for government budget constraints. Devarajan,
Swaroop, and Zou (1996) use a broader sample of 43 developing
countries to analyze the effects of government expenditures be- tween 1970 and 1990. In their study, they argue thatproductive and nonproductive public expenditures can influence economic growth over the long term because these expenditures improve the economic efficiency of the private sector. Their study indi- cates a positive relationship between nonproductive expenditure and economic growth. The results of their study indicate that government expenditures in education and healthcare have a negative effect on economic growth this due to excessive use of productive expenditure may have been misallocating the produc- tive expenditure.
Using data panels, Mura (2014) analyzes the effects of pro-
ductive expenditures on economic growth in six European Union member states from Eastern European between 1990 and 2013. This study shows that public expenditures for education, research and development, and infrastructure have a positive effect on economic growth, while public expenditures on health have a
negative effect. Research conducted by Barro (1990) into the ef-
fect of government expenditures on economic growth has often been referenced. In his study, Barro uses an endogenous growth model and cross-section data. Data is classified as productive expenditures, referring to expenditures which promote economic growth, and non-productive expenditures, referring to expendi- tures which are growth-retarding. Barro finds that productive government expenditures are capable of improving production and labor efficiency, and, consequently, promoting economic growth. This occurs because economic expenditures allocated for public capital lead to an increase in marginal productivity. Conversely, non-productive expenditures, which take the form of consumer services, limit economic growth. These findings are rather important, given that they differentiate between govern-
nations (advanced economies) and less advanced economies. In less advances economies, Barro finds that government expendi- tures are high-return, while in relatively advanced economies public expenditures have low returns in economic growth and may, in fact, decrease privateinvestment.
RESEARCH HYPOTHESES
Two main schools of thought have been consulted to under- stand the association between government expenditures, particu-
larly productive expenditures, and economic growth: Wagner‘s
Law and the Keynesian Approach. Both schools of thought hold that public expenditures can have a positive influence on eco- nomic growth. However, different empirical studies have had inconclusive results regarding the association of productive ex-
penditures and economic growth. As found by Barro (1990), eco-
nomic growth depends greatly on stocks and capital. An increase in productive expenditures, accumulated in the form of stocks and capital, will increase the amount and size of investments and promote job creation. Through the spending multiplier, the increase in stocks and capital will promote economic growth in
the various regions (Barro, 1990). As such, under Barro‘s view,
the regression coefficient of all productive expenditures is ex- pected to be positive. Focusing on the theory and empirical evi- dence surrounding government expenditure and economic growth, this study posits the followinghypotheses:
H0: β1 = β2 = β3 = β4 = β5 = β6 = β7 = 0
there is no positive association between productive govern- ment expenditures for (1) public service; (2) security and public order; (3) economy; (4) environment; (5) housing and public fa- cilities; (6) health; and (7) education sector on economic growth of provinces being studied.
H1: β1 = β2 = β3 = β4 = β5 = β6 = β7 ≠ 0
there is a positive association between productive government expenditures for (1) public service; (2) security and public order;
JURNAL STUDI PEMERINTAHAN
(JOURNAL OF GOVERNMENT & POLITICS)
Vol. 8 No. 1 February 2017
20
(3) economy; (4) environment; (5) housing and public facilities; (6) health; and (7) education sector on economic growth of prov- inces being studied.
The hypotheses are tested by comparing the estimated value and the critical value of t-statistics and F-statistics obtained from the panel regression model. F-statistics are used to determine if all independent variables together statistically affect the depen- dent variable. While t-statistics are employed to see if each inde- pendent variable individually associates with the dependent vari- able, and it plays a predominant role in multivariate regression. The hypothesis testing is stated as follows: the null hypothesis
cannot be rejected if the estimated test statistics value is d‖ criti-
cal value. On the other hand, the null hypothesis can be rejected if the estimated test statistics value is > the critical value.
RESEARCH METHOD
This study adopts a quantitative approach because of its na- ture in testing hypotheses that develop a statistical association among the variables of numerical data. The endogenous theory of economic growth emphasizes the importance of differentiat- ing between different classes of government expenditures, be- tween productive expenditures and non-productive expenditures, to better examine the effects of these expenditures on economic
growth (Barro, 1990: Mura, 2014; Christie & Rioja, 2011). Pro-
ductive expenditures are defined as expenditures which promote the production process and increase marginal productivity, thus ensuring long-term economic growth. Non-productive expendi- tures, meanwhile, are defined as expenditures with no direct ef-
fect on the production of goods and services (Barro, 1990). Pro-
ductive expenditures are expenditures which can create efficiency within the private sector and have a positive effect on such pro-
duction factors as capital and labor (Barro, 1990; Barro & Sala-
I-Martin, 1992; Mura, 2014). Productive expenditures may have
positive effects because they are included within the function of
The samples for this research are the 25 provinces which ex- isted in Indonesia before decentralization and the 33 provinces
which exist at present, after decentralization3. Financial data was
collected from the Directorate General of Financial Balance of
the Indonesian Ministry of Finance4. To compare economic
growth performance, this analysis has been divided into two pe- riods. The first is before fiscal decentralization, meaning before
1998; the period 1994–1997 has been chosen to represent this
period. Second is after fiscal decentralization, for which the years 2011 to 2015 have been chosen for analysis. As stated above, fiscal decentralization was implemented in 2001, with the legal framework being ratified by the government in 1999. As such, the pre-decentralization period covers several years before this law was passed. The period after fiscal decentralization covers 2001 to 2016, but considering the availability of data and the creation of new provinces, analysis has been limited to the pe- riod between 2011 and 2015. This selection is expected to give
the most up-to-date portrait of provincial fiscal policies‘ effects
on economic growth in the various provinces. This period was selected purely for the availability of data and in recognition of resource limitations. Although the analysis period is not lengthy, it is hoped that it will provide a general understanding of eco- nomic performance and government expenditures both before and after fiscal decentralization was implemented in Indonesia. The budget data used is divided into two analysis periods:
before decentralization (1989–Importantly, these periods will
offer a comprehensive understanding of expenditures beforeand after fiscal decentralization. Data on the Gross Domestic Re-
gional Product (GDRP)5 originates from the Census Bureau, both
at the national and provincial level. For the purpose of this study, productive government expenditures classification is used based on the Classification of the Functions of Government
(COFOG)6. According to COFOG, government expenditures
are divided into two types: productive expenditures and non- productive expenditures. Productive expenditures consist
ofgen-JURNAL STUDI PEMERINTAHAN
(JOURNAL OF GOVERNMENT & POLITICS)
Vol. 8 No. 1 February 2017
22
eral public services, defense, public order and safety, economic affairs, environmental protection, housing and community amenities, health, and education. Based on local government budgetary system in Indonesia, total government expenditures are categorized as: (1) operational (current) expenditures, and
(2) capital expenditures. Local government expenditure data in
this study is constructed from two versions of local budget re- ports, one structured according to Governmental Accounting
Standards (Standar Akuntansi Pemerintahan) and the other struc-
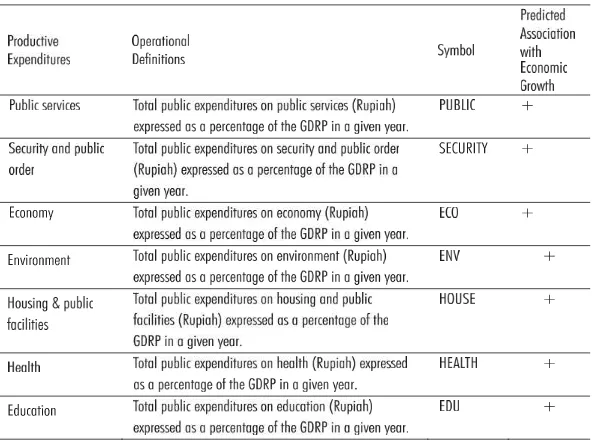
tured according to a regulation of the Ministry of Domestic Af- fairs. The first type of budget divides total expenditures into operational (current/routine) and capital expenditures, while the second classifies expenditures as direct expenditures and indi- rect expenditures. Based on the COFOG categories and regional budget structures mentioned above, the productive expenditures analyzed here are expenditures for (1) public service; (2) security and public order; (3) economy; (4) environment; (5) housing and public facilities; (6) health; and (7) educationsector.
All nominal expenditure used in the analysis did not indicate actual changes in expenditure. For this reason, all nominal ex- penditure was first converted from nominal values to real values
by dividing nominal values with the consumer price index (CPI)7.
The CPI was used because it indicates cost of living or cost of maintaining the same standard of living in certain period of time. By converting the nominal value of expenditure into their real value, real improvement or deterioration in the expenditure can
be seen throughout the analysis (Parkin, 2014; Trotman, 1997).
REGRESSION MODEL
eco-it
it
1 2 3 4 5 6 7
it it it i it
nomic growth will be estimated following the balanced panel
data model (Baltagi, 2008). This model is used because numer-
ous observations in different provinces have been adjusted to ensure that each cross-section (i.e. province) has the same regu- lar frequency of data. The econometric model to be estimated is
adapted from the studies of Barro (1990) and Mura (2014), as
follows:
Y β X β
u v
it 0 it it it
(1)
In which Y is a dependent variable, covering provincial area
(i)in a specific period (t); X is a vector of the independent vari-
able; ß , ß , ß , ß , ß , ß and ß are coefficients of regressions, and å is a stochastic disturbance term with standardproperties.
it (ui vit ) is a composite error, in which ui is a time-invariant
effect of the individual province and vit is idiosyncratic error.
Based on Equation (1), the OLS estimator will be consistent with
the condition E(X‘ )=0 in which =u +v - is a composite error.
As such, E(X’ v )=0 and E(X’ u )=0 are required. Equation (1)
it it it it
can be written more specifically by entering the dependent vari-able and all independent varivari-ables, namely to actual GDRP as a
measurement of economic growth and each province‘s produc- tive expenditure components, asfollows:
RGDRPi,t = ß0 + ß1PUBLICit+ ß2SECURITYit + ß3ECOit+
ß ENV + ß HOUSE + ß HEALTH + ß EDU + ß
4 it 5 it 6 it 7 it it
2)
In which RGDP refers to Real Gross Domestic Regional Prod- uct, PUBLIC denotes expenditures on public services, SECU- RITY is expenditures on security and public order, ECO refers to expenditures on economy, ENV is expenditures on environ- ment, HOUSE is expenditures on housing and public facilities, HEALTH refers to expenditures on health and EDU is public expenditures on education. Equation (1) is named as Model (1) which the equation to estimate the impact of productive
expen-JURNAL STUDI PEMERINTAHAN
(JOURNAL OF GOVERNMENT & POLITICS)
Vol. 8 No. 1 February 2017
24
ditures on economic growth before the fiscal decentralization era that covers 1994-1997, and the other one is Model (2) esti- mates the impact of productive expenditures on economic growth before after fiscal decentralization era which selected for the pe- riod of 2011 and 2015.
TABLE 2. SUMMARY OF REGRESSION VARIABLES: DEPENDENT VARIABLE IS GDRP
Source: Own table.
ECONOMETRIC PROCEDURES
The basic model used for panel analysis is the linear model. To determine whether a linear or nonlinear test is appropriate,
the MacKinnon, White, and Davidson Test(MacKinnon, White,
& Davidson, 1983) was employed to determine whether the pre-
ferred model is a linear function form or a log-log function form. The hypothesis tested under MWD test is written as follows:
H0: the suitable model is a linear regression model, or the de-
H : the suitable model is a log-log regression model, or the
de-1
pendent variable is a linear function of logs of the indepen-dent variables.
After obtaining the appropriate model specifications, a diag- nostics test was run to ensure that the estimates obtained through regression fulfil the Gauss-Markov conditions; namely, the esti-
mates are Best Linear Unbiased Estimates (BLUE) (Greene, 2008;
Gujarati, 1995). Properties of the BLUE estimator are (1) fol-
lows a normal distribution where the mean values are equal to the real values of the regression coefficients; (2) has minimal variance; (3) is linear where each of its element is a linear func-
tion of the dependent variable (Gujarati, 1995). The Gauss-
Markov conditions assume independent and identically distrib- uted errors, so that the errors have an expected value of zero, a
constant variance, and are uncorrelated with each other (Greene,
2008; Gujarati, 1995).
Heteroskedasticity occurs most often in cross-sectional data, but heteroskedasticity may also arise in this study since the vari- ance of each province may not be constant. Heteroskedasticity in regression arises if the variance of the errors varies across ob- servations. If this exists, the homoskedasticity assumption, that is, is violated. Under homoskedasticity, the average relationship between dependent variables and independent variables is the same throughout the sample. When the homoskedastic assump-
tion is violated (i.e. s2 is not constant across the sample) OLS
estimates are unbiased but the estimators become inefficient. Heteroskedasticity occurs most often in cross-sectional data, but heteroskedasticity may also arise in this study since the variance
of each province may not be constant. White‘s Test (1980) is used for heteroskedasticity is used to detect the presence of heteroskedasticity in the regressionmodel.
White‘s test on the error distribution is run by regressing the squared residuals on all distinct regressors, cross-products, and
squares of regressors. The test statistic is distributed X2
(Chi-JURNAL STUDI PEMERINTAHAN
(JOURNAL OF GOVERNMENT & POLITICS)
Vol. 8 No. 1 February 2017
26
squared) under the null hypothesis ofhomoskedasticity. White heteroskedasticity consistent standard errors and covariance or
Newey-West HAC (Newey & West, 1987) will be used if panel
models encounter heteroscedasticity. White‘s HC calculates the
standard errors of estimation using the White Correction for
Heteroskedasticity. Newey-West‘s HAC use general variance-co-
variance estimation to account for heteroskedasticity and autocorrelations which are particularly appropriate when the nature of heteroskedasticity and autocorrelation are unknown. In this study, the application of White HC and Newey-West HAC is appropriate because the precise nature of the heteroskedasticity in the regression models is unknown. Although the use of White HC and Newey-West HAC do not solve the heteroskedasticity and serial correlation in the regression models, estimators ob-
tained from White‘s HC and Newey-West‘s HAC lead to more valid inferences about the coefficients of regression (see, West& Agbola, 2005). The coefficients obtained from Newey-West HAC remain unchanged, they enable the calculation of standard er- rors in a way that is intended to remove homoskedasticity and serial-correlation in the error terms in the regression models (gen- erally, the Newey-West estimator produces larger standard errors).
Furthermore, the Hausman Test (Hausman, 1978) was con-
ducted to determine whether the Fixed Effects Model (FEM) or the Random Effects Model (REM) was the appropriate regres-
sion panel model. The REM assumes the individual effects, (ái),
is uncorrelated with all independent variables, Xit, and combines
the individual specific effects with the error term to form a com-
posite error term (ái + uit). Time-invariant unobserved effects in
the error term cause the composite errors to be serially corre- lated. To deal with this problem, the REM uses the Generalised Least Squares (GLS) regression method. The main problem with the REM approach is that when the individual specific effects are correlated with any of the independent variables, the esti-
mates are not consistent. Whereas in FEM, the individual ef-
indepen-dent variables. In the FEM procedure the individual effects are estimated. The Hausman test compares the fixed effects to the random effects models by testing the null hypothesis that the coefficients estimated by the efficient random effects estimator are the same as the ones estimated by the consistent fixed effects estimator. Or in simple words, it checks whether the unobserved
provinces‘ effects are correlated with the independent variables.
FINDINGS
Descriptive Evaluation on Government Expenditures and Economic Growth in Provinces Before and After Fiscal Decen- tralization
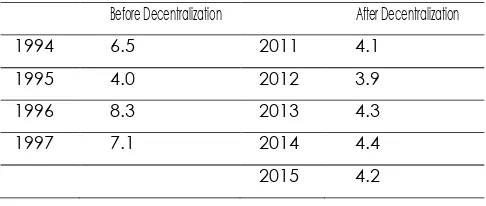
The performance of fiscal policies implemented by provin- cial governments can be seen through the economic growth at- tained by said provinces. Meanwhile, a high GDRP is indicative of increased production capacity in a region, which is followed by increased per-capita income and standards of living in the provinces studies. Based on Table 3, real GDRP growth before fiscal decentralization policies tended to be higher than after fiscal decentralization policies were implemented. It is shown that, between 1994 and 1995, the average real economic growth at the provincial level was above 4%, and reaches 7.1% and 8.3% in 1994 and 1995 respectively; such an economic growth rate was not achieved in the years after decentralization examined
(i.e. 2011–2015). The average real economic growth rate in that
period has not exceeded 4.5% over the past five years. The high- est economic growth rate at the provincial level was 4.4% in 2012, while the lowest was 3.9% in 2014. Meanwhile, before fiscal de- centralization, the economic growth rates were less than 5%.
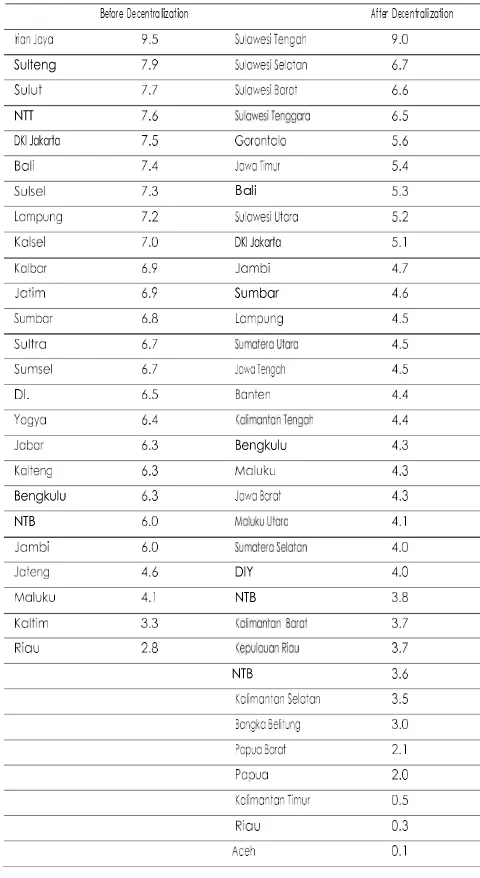
Real economic growth at the Indonesian provincial level be- fore and after fiscal decentralization can be seen in more detail in Table 4. Between 2011 and 2015, the provinces which attained
the greatest economic growth were those in eastern Indonesia—
Central Sulawesi, with an average economic growth of 9%, fol- lowed by South Sulawesi (6.7%), West Sulawesi (6.6%),
South-JURNAL STUDI PEMERINTAHAN
(JOURNAL OF GOVERNMENT & POLITICS)
Vol. 8 No. 1 February 2017
28
East Sulawesi (6.5%), and Gorontalo (5.6%). If compared to the period before decentralization, then the provinces with the great- est average economic growth were also found in eastern Indone- sia: Irian Jaya (9.5%), South-East Sulawesi (7.9%), and North Sulawesi (7.7%). As such, there has been no significant shift in the division of economic performance as viewed from real eco- nomic growth.
TABLE 3. REAL GDRP GROWTH BEFORE & AFTER FISCAL DECENTRALIZATION (%)
Before Decentralization After Decentralization
1994 6.5 2011 4.1
1995 4.0 2012 3.9
1996 8.3 2013 4.3
1997 7.1 2014 4.4
2015 4.2
Source: Author’s calculcation.
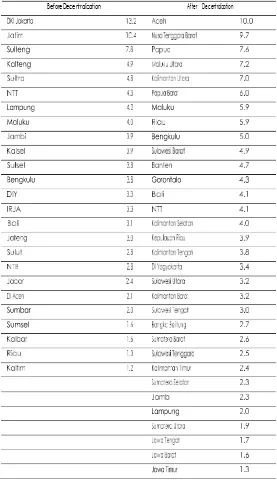
As explained above, government expenditures are financial policy instruments that play an important role in promoting eco- nomic growth. Increases and decreases in expenditures can be used as a measure for economic expansion and contraction, as realised through GDRP. This can be examined in more detail by comparing total provincial government expenditures with prov-
inces‘ GDRP. Table 5 below shows trends in provincial govern- ment expenditures in ratio with GDRP before and after the imple- mentation of fiscal decentralization. The higher ratio of govern- ment expenditures to GDRP since decentralization indicates a tendency towards implementing expansive financial policies at the provincial level. This table shows that the lowest average ra- tio of government expenditures to GDRP (1.3%) was found in East Java, with the highest (10%) in Aceh. Following Aceh, the provinces with the highest total expenditures as a percentage of
the GDRP are almost all outside Java—West Nusa Tenggara
TABLE 4. PROVINCES RANKED BY REAL GDRP GROWTH BEFORE
Before Decentralization After Decentralization
JURNAL STUDI PEMERINTAHAN
(JOURNAL OF GOVERNMENT & POLITICS)
29
Source: Author’s calculation.
are North Sumatra (1.9%), Central Java (1.7%), and West Java (1.6%)
Total provincial government expenditures, as shown in
Vol. 8 No. 1 February 2017
TABLE 5. PROVINCES RANKED BY TOTAL EXPENDITURE AS % OF REAL GDRP
Before Decentralization After Decentralization
30
ure 3, consist of routine expenditures and capital expenditures, or direct expenditures and indirect expenditures. Based on their
function, expenditures are divided into 33 different sectors8. Fig-
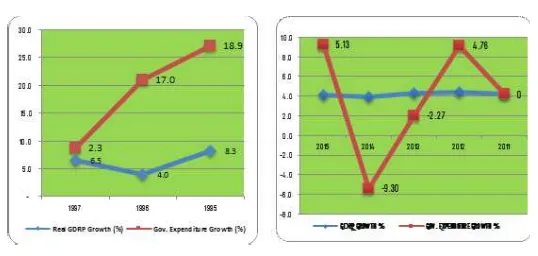
ure 3 shows a trend in total provincial government expenditures and GDRP growth from 2011 to 2015. On average, provincial government expenditures increased by 14.8%, while GDRP growth was only 0.1%. In the provinces analysed, the greatest growth in provincial government expenditures was in 2012, reach- ing 42%. This was a drastic increase over 2011, whenprovincial government expenditures saw negative growth of 11%. However, in that year the GDRP saw negative growth of 8.8%. Negative GDRP growth was also found in 2015, reaching -4.4%. GDRP growth in 2012, 2013 and 2014 were respectively 4%, 4.9%, and 4.7%; during this period, provincial government expenditures increased by 42%, 19.6% and 13.8%.
FIGURE 3. GDRP GROWTH AND GOVERNMENT EXPENDITURE GROWTHBEFORE AND AFTER FISCAL DECENTRALIZATION, AVERAGE (%)
Despite no clear pattern of government expenditure growth in response to fiscal decentralization, the increase in government expenditures in the early years of fiscal decentralization show no marked changes. However, in later years, increases in govern- ment expenditures indicated that the implementation of fiscal decentralization had led to sharp increases in provincial govern-
ments‘ spending, particularly in 2012 and 2013, before shifting
to negative in 2015. From this trend in provincial governments‘
JURNAL STUDI PEMERINTAHAN
(JOURNAL OF GOVERNMENT & POLITICS)
Vol. 8 No. 1 February 2017
32
expenditures and the GDRP growth, it cannot readily be con- cluded that government spending has a significant role in stimu- lating economic growth, for the marked increase in expenditures in 2012 was not followed by marked economic growth that year.
MACKINNON, WHITE AND DAVIDSON TEST
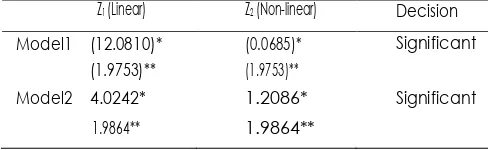
The MWD test was run to check if either linear functional form or log-log was more appropriate for the panel data used in the study. The results are reported in Table 6. The table shows that almost all of the linear estimates (Z ) and logarithmic
trans-1
formation (Z ) are significant, suggesting that both linear and
2
log-log functional forms are appropriate. Based on these results, the log-log functional form was used to maintain consistency with previous cross-sectional analysis.
TABLE 6. RESULT OF THE MWD TEST FOR MODEL 1 AND MODEL 2
Z1 (Linear) Z2 (Non-linear) Decision
Model2 4.0242* 1.2086* Significant
1.9864** 1.9864**
Note: number of observation = 165, k = 9; * t-statistics; ** t-table. Source: Own calculation using EVIEWS 8.
Based on the results of the MWD test, it was determined that the most appropriate regression model was the non-linear func- tional form model, or log-linear. As such, Equation (2) can be rewritten as:
LRGDRPi,t = β0 + β1LPUBLICit+ β2LSECURITYit + β3LECOit+ β4LENVit + β5LHOUSEit + β6LHEALTHit + β7LEDUit + εit
(3)
between unobserved province-specific heterogeneity and inde-
pendent variables, or E(XitI ëi) ‗― 0. If the unobserved
province- specific heterogeneity correlates with the independent variables, then the most appropriate regression model for panels is FEM. However, if unobserved province-specific heterogeneity does not correlate with independent variables, then REM is the most ap- propriate.
The hypothesis used in the Hausman test is as follows:
H0: Individual effects and independent variables are not correlated;
E(XitIλi) = 0
H1: Individual effects and independent variables are correlated;
E(XitIλi) ≠ 0
HAUSMAN TEST
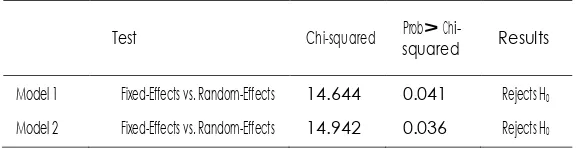
To test whether or not unobserved province-specific hetero- geneity correlates with independent variables, the Hausman Test was run; the results are summarised in the table below. If the Hausman statistic value is significant, then the null hypothesis which states that unobserved province-specific heterogeneity in the regression model has no correlation with the independent variables is rejected. However, if the Hausman statistic value is not significant, then the null hypothesis is irrefutable. Based on the Hausman test, as shown below, it was concluded that the Chi-Squared and p-value were significant at á = 5%. As such, fixed effects estimators are the most appropriate for use in Model (1) and Model (2).
TABLE 7. SUMMARY OF THE HAUSMAN TESTS RESULTS
JURNAL STUDI PEMERINTAHAN
(JOURNAL OF GOVERNMENT & POLITICS)
33
Test Chi-squared Prob> Chi-
squared Results
Model 1 Fixed-Effects vs. Random-Effects 14.644 0.041 Rejects H0
Model 2 Fixed-Effects vs. Random-Effects 14.942 0.036 Rejects H0
Vol. 8 No. 1 February 2017
34
As shown above, in general the data panels showed hetero-
scedasticity, namely E(å 2); in other words, the error terms didit
not have a constant variance. If the variance of the error term was constant, or Vj(å ) = ó2, for all i (provinces), then the appro-
priate model would be homoscedastic (Williams, 2015:1). The
data panels also experienced the issue of serial correlation owing to the involvement of the time dimension (or cross section di- mension) in the data; as such, the effects of dependent variables
were distributed among several time periods (Baltagi,2008).
In the estimated model, heteroscedasticity could occur be- cause of differences in the subpopulations or the other effects of interactions. For instance, the influence of provincial govern-
ments‘ productive expenditures on economic growth differed for different groups of residents or residents in different districts
and sub-districts (see for instance Williams, 2015). To test whether
or not the panel model used contained heteroscedasticity, the
Breusch-Pagan-Godfrey test (Breusch & Pagan, 1979) was applied
with both a null hypothesis—that the model was homoscedastic—
and an alternative hypothesis—that the model was heteroscedastic.
The results of this test indicated issues heteroscedasticity and serial correlation. Based on the results of this test, regression Model (1) and Model (2) were applied using White cross-section standard errors & covariance estimators, which are designed to accommodate arbitrary heteroscedasticity and cross-section se-
rial correlation (see also, Curto, Pinto, Morais, & Lourenço,
2011).
statistically affect the dependent variable.
The panel regression results for Model (1) cover the period selected to examine the effects of seven productive expenditures on economic growth before fiscal decentralization. These results show that, of the seven types of productive expenditures esti- mated, five have negative regression coefficients: expenditures for public services (PUBLIC), expenditures for economic growth (ECO), expenditures for the environment (ENV), expenditures for housing (HOUSE), and expenditures for healthcare (HEALTH). These negative regression coefficients indicate a re- verse direction connection between economic growth and these five types of productive expenditures. Although, based on the t- test, it can be concluded that these five variables are not statisti- cally significant in explaining variations in economic growth, the negative signs of these five coefficients go against the expect posi- tive signs/direction.
Next, using a t-test with á = 5%, a t-table value of 1.655 was attained. If compared to the t-statistic value of all independent variables in the formulated regression, only the t-statistics from education expenditures are significant, reaching 2.041. This in- dicates that, of the seven productive expenditures predicted to have a positive relationship and be statistically significant, only productive expenditures in education had a statistically signifi- cant effect on economic growth at the provincial level before
fiscal decentralization in the period studied (1994–1997). The
negative signs obtained from five types of productive expendi- ture are at odds with expectations, because this implies that those productive government expenditures are associated with a rela- tively lower rate of economic growth. This finding does not sup- port the theoretical expectation that productive expenditures in these sectors have a positive association witheconomic growth. This regression coefficient of public expenditureswithin the education sector can be understood as meaning that every in- crease of one unit in public expenditures within the education sector led economic growth of 1.859% between 1994 and 1997.
JURNAL STUDI PEMERINTAHAN
(JOURNAL OF GOVERNMENT & POLITICS)
Vol. 8 No. 1 February 2017
36
This indicates that government expenditures in the education sector are capable of promoting greater human capital develop- ment, and this was the sole important factor in realizing eco- nomic growth before fiscal decentralization was implemented. Similar results can be found in several previous studies, includ-
ing those of Saad and Kalacech (2009) and Mura (2014). The
coefficient of government expenditures for security and public order was also positive, but not statistically significant.
In Model (2), unlike in the period before fiscal decentraliza- tion, public expenditures in security and public orderwereshown to have a positive and statistically significant association with economic growth after fiscal decentralization. The regression coefficient obtained was 4.869; as such, it could be said that every additional share of provincial expenditure on security and public order will expand economic growth by about 4.9%. Simi-
lar results were found by (Chairil, Sinaga, & Febrianti, 2013),
whoshowed that, in Indonesia, government expenditures on the military had a positive effect on economic growth. Although the allocation of public expenditures for security and public order is connected only indirectly to the activities which create economic growth, the regression results show that provinces with larger public expenditures on security and public order enjoy greater economic growth. Expenditures in this sector canpromote eco- nomic growth because they support the recognition and protec- tion of property rights, leading residents to conduct more pro-
ductive activities that create capital accumulation (Mylonidis,
2008). The positive association between expenditures for secu-
rity and public order, including military expenditures,has been shown to involve a co-integration and unidirectional relation-
ship between said expenditures and a country‘s economic growth,
such as in Turkey (Gokmenoglu, Taspinar, &Sadeghieh, 2015).
As found in Alshahrani and Alsadiq (2014) as well as in
Devarajan et al., (1996), government expenditures on health sec-
health sector causes an approximately 2% increase in economic
growth across provinces, ceteris paribus. The positive association
between expenditures in the education sector and economic growth is also confirmed in Model (2), namely for the period after fiscal decentralization. In this period, education expendi- ture is significant with a bigger magnitude of about 4.441 at the 1% level; a 1% in expenditure on education is associated with a 4.441% change in the economic growth of the 33 provinces be- ing studied, other things being equal. One important possible explanation for such encouraging findings is Law No 20 of 2003 on the National Education System, which establishes education as an obligatory function of local government following decen- tralization. According to Chapter XIII, Article 49, of this law, local governments must allocate a minimum of 20% of their budget to finance education.
The regression results of Model (2) also indicate that public expenditures for public services, public expenditures for economic growth, public expenditures for the environment, public expen- ditures for housing, and public expenditures for health have no significant influence on economic growth, as also seen in Model (1). Empirically, this finding can explain the potential for
leak-TABLE 8. SUMMARY OF PANEL REGRESSION RESULTS DEPENDENT VARIABLE IS ECONOMIC GROWTH (LRGDRP)
JURNAL STUDI PEMERINTAHAN
(JOURNAL OF GOVERNMENT & POLITICS)
37
Constant LPUBLIC LSECURITY LECO LENV LHOUSE LHEALTH LEDU
Model 1 2.044 -0.027 1.5 -0.318 -3.423 -0.052 -2.663 1.859
(Before fiscal decentralization) -24.7 (-0.292) -0.206 (-0.141) (-0.617) (-0.062) (-1.219) (2.041)*
Adjusted R2 = 0.275; F-statistic = 52.201; Number of Observation = 99
Model2 1.399 -6.289 391.439 3.294 -104.432 -16.935 33.776 32.838
(After fiscal decentralization) -103.017 (-3.857) (4.869)* -0.295 (-5.740) (-1.755) (2.008)* (4.410)*
Adjusted R2 = 0.819; F-statistic = 18.872; Number of Observation = 155