Thesis PM 147501
FORMULATING CORPORATE STRATEGY
TO SUSTAIN THE COMPETITIVENESS OF
PT. APX (DRILLING RIG COMPANY)
Sanggam Patar Parlindungan Lumban Gaol 9111 201 804
ADVISOR/ SUPERVISOR Dr. Sony Sunaryo, MSi
Prof. Dr. Ir. Buana Ma’ ruf, MSc, MM.
PROGRAM MAGISTER MANAJEMEN TEKNOLOGI BIDANG KEAHLIAN MANAJEMEN INDUSTRI PROGRAM PASCA SARJANA
INSTITUT TEKNOLOGI SEPULUH NOPEMBER SURABAYA
ABSTRACT
The increasing domestic consumption of oil and gas followed by the decreasing national production has pushed Government to put more effort to increase drilling activities in Indonesia. PT. APX as one of the contractor providing drilling services to many oil and gas operator needs to stay competitive in the industry that demands high capital investment with high technology and management knowhow. PT APX is therefore required to formulate his corporate strategy considering the business environments to sustain its competitiveness. The corporate strategy for PT APX is formulated using David’s comprehensive strategy formulation model, which consists of the input stage, the matching stage and the decision stage. The Analytical Hierarchy Process is used to calculate the weight of internal and external factors. From the QSPM analysis, the strategy with the highest TA (Total Attractiveness) score is selected. For Offshore Drilling Division the highest TA score is 5.94 and 3.77, with the strategy to find partners to open and explore new market and to increase number of offshore fleet to acquire larger market share. For Onshore Drilling Division, the highest TA score is 7.13 and 5.21 with the strategy to build stronger relationship with clients and authority and to increase number of onshore fleet to acquire larger market share.
Keywords: Strategic Management, Analytical Hierarchy Process, Corporate
Strategy, David’s Formulation Model, Oil & Gas
This page is intentionally left blank
ACKNOWLEDGMENT
This thesis is submitted as one of the requirements to complete the Magister Manajemen Teknologi (MMT) Program in Institut Teknologi Sepuluh Nopember (ITS). It has been a great challenge for me to meet all the demand of the courses and at the same time to maintain a good performance as an employee. During that period I have received lots of assistance and support from colleagues, friends and families whom I cannot mention one by one, but in particular I would like to express my appreciation and thanks to:
1. Prof. Dr. Ir. Buana Ma’ruf , MSc, MM, MRINA as my advisor and mentor for the guidance, insight and encouragement to finalize this writing.
2. Dr. Sony Sunaryo, MSi as my co-advisor and co-mentor, for his input and comment to this writing.
3. Prof. Dr. Yulinah Trihadiningrum, MAppSc and Ir. I Putu Artama Wiguna, MT, PhD as the Management of the MMT Program, for the encouragement and support to me as a graduate student.
4. The Lecturers of the MMT Program who have been very serious and cooperative in the teaching and learning process during the courses.
5. The Academic and Administration staff of the MMT Program who have given great support and assistance during the study period.
6. The class-mates from Total E&P Indonesie for the great esprit de corps during the good times and the bad times.
7. My wife Metiyana Utama ‘joayu’ and my children Anya and Kai for their patience and understanding when I missed all the good weekends during the last two years; and for their love and spirit that keep me going on until the end.
I realize that this writing is far from perfect and therefore any mistakes and errors are surely unintended and they remain mine. Any feedback and suggestion to improve this writing will be highly appreciated.
Balikpapan, January 2015
Sanggam P. P. Lumban Gaol
This page is intentionally left blank
TABLE OF CONTENTS
APPROVAL SHEET………i
ABSTRACT ... iii
ACKNOWLEDGMENT ... v
TABLE OF CONTENTS ... vii
LIST OF FIGURES... ix
LIST OF TABLES ... xi
CHAPTER 1 INTRODUCTION………1
1.1. Background………1
1.2. The formulation of problems……….3
1.3. The objectives of research……….3
1.4. The benefit of research ... 4
1.5. The scope of research and the assumptions………...5
1.6. The Thesis Outline ... 5
CHAPTER 2 LITERATURE REVIEW……….7
2.1 General Overview of Drilling Industry...7
2.2 General Overview of PT. APX………..8
2.2.1. Vision, Mission and Corporate Values………..9
2.2.2. Overview of Company’s Operation………...9
2.2.3. Overview Company’s Performance……….11
2.3 Strategic Management……….11
2.3.1. Concept and Definition………11
2.3.2. Strategic Management Model………..12
2.4 Types of Strategies………..15
2.5 Analysis of Business Environment………..17
2.6 Analytical Hierarchy Process (AHP)………...17
2.7 Previous Studies………..19
CHAPTER 3 RESEARCH METHODOLOGY………21
3.1. Methods and Research Outline………21
3.1.1. Research Methodology……….21
3.1.2. Research Framework………22
3.2. Collecting and Processing Data………...24
3.2.1. Collecting Data……….24
3.2.2. Processing Data………25
3.3. Analysis of Business Environment………..25
3.3.1 External Factor Evaluation (EFE) Matrix………26
3.3.2 Internal Factor Evaluation (IFE) Matrix………..26
3.3.3 Competitive Profile Matrix (CPM)………..27
3.4. Strategic Analysis………27
3.4.1. Internal External (IE) Matrix………...27
3.4.2. SWOT Matrix ... 28
3.4.3. SPACE Matrix……….28
3.4.4. BCG Matrix………..28
3.4.5. Grand Strategy (GS) Matrix……….28
3.4.6. Quantitative Strategic Planning Matrix (QSPM)……….28
CHAPTER 4 STRATEGY FORMULATION ... 31
4.1 Evaluation of Vision and Mission... 31
4.2 Data Collection and Processing ... 33
4.2.1. Data Analysis ... 33
4.2.2. Data Validity Testing... 35
4.2.3. Calculating Weight of Factors & Sub-Factors ... 35
4.3 Strategy Formulation………...44
4.3.1. The Input Stage………44
4.3.1.1 External Factor Evaluation Matrix (EFE)……….44
4.3.1.2 Internal Factor Evaluation Matrix (IFE) ... 47
4.3.1.3 Competitive Profile Matrix (CPM) ... 50
4.3.2. The Matching Stage ... 52
4.3.2.1 SWOT Matrix ... 52
4.3.2.2 SPACE Matrix ... 55
4.3.2.3 IE Matrix ... 57
4.3.2.4 BCG Matrix ... 58
4.3.2.5 GS Matrix ... 60
4.3.3. The Decision Stage ... 61
4.3.3.1. QSP Matrix………...64
CHAPTER 5 RESULTS AND DISCUSSION ... 71
CHAPTER 6 CONCLUSION AND RECOMMENDATION ... 75
6.1. CONCLUSION ... 75
6.2. RECOMMENDATION ... 75
REFERENCES ... 77
APPENDICES... 79
Appendix 1: Questionnaires ... 79
Questionnaires #1: ... 80
Questionnaires #2 : ... 93
Questionnaires #3: ... 97
Questionnaires #4: ... 98
Questionnaires #5 : ... 99
Appendix 2: AHP Calculation Results (25 pages) ... 105
This page is intentionally left blank
LIST OF TABLES
Table 1. Strategic Management Models……….13
Table 2. Saaty Scale………...19
Table 3. Vision & Mission Evaluation... 31
Table 4. Internal & External Factors - Offshore and Onshore Drilling Business . 36 Table 5. Weight of External Factors – Offshore & Onshore Drilling Division .... 37
Table 6. Weight of Internal Factors – Offshore & Onshore Drilling Division ... 38
Table 7. Weight of Sub-Factor External – Offshore Drilling Division ... 39
Table 8. Weight of Sub-Factor External - Onshore Drilling Division…………...40
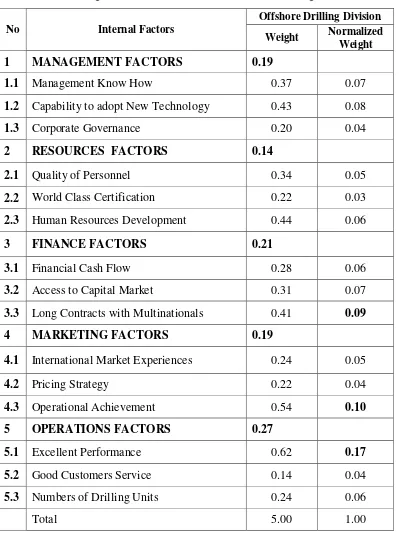
Table 9. Weight of Sub-Factor Internal – Offshore Drilling Division…………...42
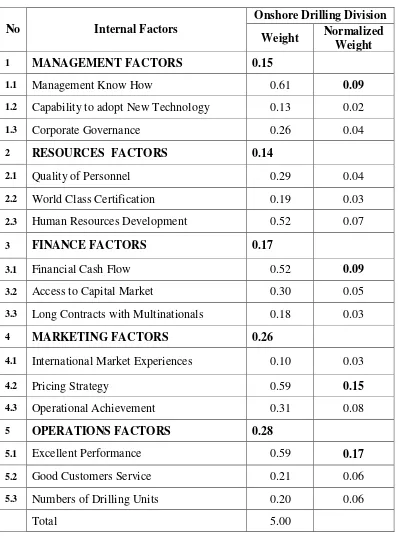
Table 10. Weight of Sub-Factor Internal –Onshore Drilling Division…………..43
Table 11. Matrix EFE - Offshore Drilling Division………...45
Table 12. Matrix EFE - Onshore Drilling Division ... 45
Table 13. Matrix IFE - Offshore Drilling Division ... 48
Table 14. Matrix IFE - Onshore Drilling Division ... 49
Table 15. CPM Matrix - Offshore Drilling Business ... 51
Table 16. CPM Matrix - Onshore Drilling Business ... 51
Table 17. SWOT Matrix - Offshore Drilling Unit ... 52
Table 18. SWOT Matrix - Onshore Drilling Unit ... 53
Table 19. SPACE Matrix Factors- Offshore Business Unit... 55
Table 20. SPACE Matrix Factors - Onshore Business Unit ... 56
Table 21. Estimated Revenues and Profit of PT.APX (2013) ... 57
Table 22. Market Share & Industry Growth Rate ... 59
Table 23. Input Stage Result ... 61
Table 24. Matching Stage Results – Offshore Drilling Unit ... 62
Table 25. Matching Stage Results – Onshore Drilling Unit ... 62
Table 26. Decision Stage Table – Offshore Drilling Division ... 63
Table 27. Decision Stage Table – Onshore Drilling Division ... 63
Table 28. QSP Matrix for External Factors – Offshore Drilling Unit ... 64
Table 29. QSP Matrix for Internal Factors – Offshore Drilling Unit ... 65
Table 30. QSP Matrix for External Factors – Onshore Drilling Unit... 66 Table 31. QSP Matrix for Internal Factors – Onshore Drilling Unit……….68
This page is intentionally left blank
CHAPTER 1
INTRODUCTION
1.1. Background
Indonesian economic growth based on the basic assumption of RAPBN 2014 was estimated to reach the rate of 6 percent. This growth rate is considered high and most certainly will require a large amount of energy supply to fuel the national economy. Until now, oil and gas is still the main commodity that supported the national economy. According to the Ministry of Energy and Mineral Resources (ESDM), about 48 percent of national energy is still using crude oil while around 21 percent is using natural gas.
Statistics from the Ministry of Energy and Mineral Resources and SKK Migas showed that within the last three decades, the oil reserves in Indonesia are steadily decreasing, from 12 billion barrels of oil in 1980 to become only 4 billion barrels in 2011. These facts signify the importance of urgent efforts to find new reserves as the cycle of oil and gas projects could lead up to many years from the exploration stage to production stage. High capital investments are therefore needed to anticipate the declining reserves.
With the ever increasing national energy consumption, Indonesia is no longer an oil producing country like it was in the 1980’s. The natural declining of the old oil fields could reach up to 20 percent per year making the oil production decrease sharply. Nowadays the national oil production is only around 890 thousands of barrels per day while domestic consumption has reached 1.5 million barrels per day. To meet the domestic consumption Indonesia must routinely importing crude oil from several countries like Saudi Arabia and Nigeria.
The era of Oil Boom is long gone and Indonesia must face the difficult situation of steadily depleted reserves and an ever increasing national consumption as the result of economics development and population growth. Natural gas is firmly taking a new position as the next best energy commodity that contributes more and more to the revenues of Indonesia. In 2010 the production of natural gas peaked at the level of 1.59 million bpd according to BP Statistical
Review of World Energy 2012, and thus the era of Oil has become the era of Natural Gas. The quest to find more oil and natural gas has brought the focus on exploration and exploitation shifting from the western part to the eastern part of Indonesia, like East Kalimantan, Sulawesi, Maluku and Papua. The level of technical difficulties is consequently increasing as the exploration and exploitation activities is moving further into the more remote area and the deeper part of the ocean.
Drilling is one of the most important activities in the effort to discover new oil or gas reserves in the exploration area or to produce oil and gas from the production area. Only by drilling a well, an economic decision could be made to go or not to go further in the quest. Drilling Rig company is therefore plays a very important role in the success of an Oil & Gas Company (Operator) in finding new reserves or in producing oil and gas from the concession area.
Drilling is a vital activity in the success of an oil and gas operator. The risks are high for both the operator and the drilling company but then if the activities are successful the rewards are also very interesting. For a drilling company to be successful it must have the capability to formulate the right strategy to win the competition and to maintain its position in the market especially knowing that the drilling business is a very risky and very capital intensive business. Strategy not well defined could bring the company to failure.
PT. APX is a national company operating as drilling contractor in the oil and gas industry in Indonesia. The company specializes in providing oil, gas and geothermal drilling services to many oil and gas or energy company mainly in Indonesia and also actively participating in the tender for rig in the South East Asia region and the Middle East. PT. APX has substantial experiences performing onshore and offshore drilling activities in Indonesia during the last three decades with many oil and gas operator like Total E&P Indonesia, Vico, Chevron, Exxon Mobil, Conoco Phillips, Pertamina, Hess, BP, Petrochina etc.
PT. APX is operating in a clearly separated business units, the onshore business unit and the offshore business unit. In the onshore business unit PT APX is supported by a fleet of eight land rigs with current operational location spread all over the main islands of Indonesia, like Sumatra, Kalimantan, Sulawesi and
Java. Its offshore business unit on the other hand is mainly operating in East Kalimantan, with a fleet of 2 JackUp Rigs and 4 submersible swamp-barge rigs. PT. APX has also one FPSO operating in Selat Madura, Jawa Timur.
This research is conducted to formulate the right corporate strategies for PT. APX to sustain its competitiveness in the market. The strategy formulation will be based on the model developed by Fred R. David (David, 2013). The reason this particular model is selected because it has several advantages like its systematic approach and step by step comprehensiveness compare to other strategic formulation model. Another reason is because the model includes the QSPM (Quantitative Strategic Planning Matrix) analysis method that could finally recommend the right strategy for the company.
1.2. The formulation of problems
Based on the background of the situation, the problems could be formulated into research thesis as follow:
1. How to identify and to analyze the most important business environment factors that highly impacted the drilling rig sector?
2. How to formulate the business strategies of the two business unit of PT. APX as the basis of decision making in the corporate level.
3. How to select the corporate strategies of PT. APX to sustain and to enhance its competitiveness?
1.3. The objectives of research
By making reference to the formulation of problems above, the objectives of this research are as follows:
1. To identify factors of business environment which are the most important to the drilling rig sector.
2. To define and select the appropriate corporate strategies for PT.APX in order to sustain and to enhance its competitiveness.
1.4.The benefit of research
The benefits expected from this research are:
1. For the business organization, the results are expected to contribute to the corporate strategy formulation process of PT. APX for the next five years. 2. For the academia, this research could be useful in extending and enriching the
current knowledge and methodology in defining corporate strategy and could also be used as a benchmark and reference for anyone conducting similar research.
1.5.The scope of research and the assumptions
The scope of this research is as follow:
1. The business sector being researched is the drilling rig sector, both offshore rig business sector and onshore rig business sector.
2. Data and information collected were acquired during the period 2012 to 2013. 3. Researcher only utilized the Analytical Hierarchy Process (AHP) methods
developed by Thomas L. Saaty (Saaty, 1988) and Fred R. David (David, 2013) approach in the formulation of management strategy of PT. APX.
4. The period of the proposed corporate strategies is five years (2015-2020), with the assumption that there are no significant changes in the internal and external business environment during the period.
The assumptions being used in this research are as follow:
1. There is no change in the working/operation activities of PT. APX during the time the research is conducted.
2. In the pair wise matrix of internal and external factors, each element is explained within the criteria set by researcher based on literature study and the discussion with the management team of PT. APX.
1.6. The Thesis Outline
CHAPTER I: INTRODUCTION
Chapter one describes briefly and completely the background of the research, the formulations of problems, the objectives, the benefits, the scope and the assumptions of the research.
CHAPTER II: REVIEW OF LITERATURE
Chapter two explains the underlying theories and concepts of the research related to the condition of drilling rig sector, the application of AHP method and the formulation of corporate strategy based on Fred R. David approach.
CHAPTER III: METHODOLOGY OF RESEARCH
Chapter three details the framework of the research by describing the different stages in the research from preliminary studies, literary studies, data collection and processing, strategy formulation stages until conclusions and recommendations.
CHAPTER IV: STRATEGY FORMULATION
Chapter four illustrates the data collection and processing as well as the strategy formulation stages.
CHAPTER V: RESULTS AND DISCUSSION
Chapter five conducts analysis and discussion on the results obtained from the strategy formulation stages, in line with the objectives of the research.
CHAPTER VI: CONCLUSIONS AND RECOMMENDATIONS
Chapter six draws conclusion from the results of the research and provides recommendation for PT.APX and further research work to be done.
This page is intentionally left blank
CHAPTER 2
LITERATURE REVIEW
2.1General Overview of Drilling Industry
SKKMIGAS, Indonesia’s upstream oil and gas regulator, has announced the year 2013 as the “Drilling Year” and this announcement has sent a clear signal to the industry that the drilling activities will increase significantly and that the drilling rig will be in high demand. This announcement has become the golden opportunity for many drilling contractors in Indonesia to extend its market share in order to get a bigger piece of the market.
The target from SKKMIGAS is to complete 1.106 development wells and 121 exploration wells (SKKMIGAS, 2014), and this target is set in order to increase the national oil and gas output which is by nature continuously decreasing. The Indonesia Association of Drilling Contractor (APMI) estimates that it will require at least 500 drilling rig to meet the target set by SKKMIGAS. This means that the market are very much widely open to for any drilling contractors to make a good profit in this business.
However the challenges facing the drilling contractors are also enormous. It is widely known that the industry requires big capital investment; it also requires high quality and high competence personnel to run the drilling rig. The profitability of the drilling contractor is also depending on the macroeconomic conditions of the county where it operates and also on the global economic conditions. The price of crude oil will certainly impacted the drilling business. High oil price will certainly push more drilling activities and thus the demand for drilling rig will increase while low oil price will definitely slowing down the business.
Other challenges are the fact that the oil and gas industry, where the drilling activities took place, is heavily regulated. The local regulation and the international regulation set the rule of the game for the contractors in their effort to get more business. Local rules from SKKMIGAS set a strict procedure in all tender process where drilling contractors participate during a tender process
launched by operator. International rules also set a high requirement related to health and safety requirement, technical requirement, and also many certification that a drilling contractors must meet in order to be considered qualified.
According to the latest information released by Rigzone in October 2014 (www. rigzone.com), there are currently around twenty two (22) offshore jack up rig with 300-400ft operated in Indonesia. The owners of these 22 jack up rigs are distributed among eleven (11) drilling contractors, which make each drilling contractors in average is having only two (2) jack up rigs. Here PT. APX owns four (2 + 2 new build) jack up rigs, which is equivalent to 19 percent of market share (in terms of number of rigs). If we include the swamp barge rig (4 rigs), then for offshore rigs, PT. APX owns eight (8) of twenty two (22) rigs operating in Indonesia, equivalent to 38% market share (in terms of number of rigs).
This situation is very a clear indication that market is in tight competition between the rig owners with a very limited numbers of drilling units available. A drilling contractor is forced to develop strategy that will make them capable to compete in the market and to make significant profit in order to continue to exist in the industry.
2.2General Overview of PT. APX
PT. APX was established on June 20th, 1984 and specializes as a drilling service provider for exploration and production firms engaged in Indonesia’s oil and gas industry. In its initial stage PT. APX only served offshore drilling services with two units of submersible swamp barges, Maera and Raisis, and one jackup rig, Raniworo.
In 2001, with the aim to creating an integrated oil and gas drilling Services Company, PT. APX merged with PT Medco Antareja, an affiliated company at that time and one which engaged in onshore drilling, with twelve onshore fleets. Incorporations of these two companies had created PT. APX as a much larger enterprise capable of handling projects, either in Indonesia or overseas such Brunei Darussalam, Myanmar, Australia, Middle East and the United States.
In 2002, to support the business expansion strategy, PT. APX had listed its shares in Indonesia Stock Exchanges (IDX), with APEX as its ticker. PT. APX was the first domestic drilling company listed in IDX. This successful IPO inspired the company to expand, through the addition of three more offshore rigs, making total of fourteen rigs, comprising of six offshore rigs and eight onshore rigs.
PT. APX also owns a floating, production, storage and offloading system (FPSO), a floating type tank system, which is used to develop satellite or marginal fields in shallow or deep water as they can be secure when reservoirs are consumed or moved for consumption to other places.
2.2.1. Vision, Mission and Corporate Values
The mission and vision statements of PT. APX are as follow:
Vision: To be a world class drilling contractor offering quality without compromise.
Mission:
• Maintaining a high standard of Safety, Health, ad Environment (SHE) to ensure the safety and welfare of employees and to protect the surrounding environment.
• Providing maximum value to all of stakeholders while making a positive impact on society and the environment.
• Developing human resources with global-standard quality and competency Corporate Values:
• Trust: Integrity, Commitment, Honesty
• Dedication: Loyalty, Enthusiasm, Devotion
• Performance: Competence, Professionalism, Leadership, Result.
2.2.2. Overview of Company’s Operation
PT.APX categorizes its business operations into two segments, the Offshore Drilling Services and Onshore Drilling Services. PT. APX owns eight land rigs, two jack-up rigs, four submersible swamp barge rigs plus one unit Floating Production, Storage and Offloading (FPSO). Jack-up rig is a mobile drilling unit with self-elevating drilling platform equipped with legs that are lowered to the
ocean floor until a foundation is formed to support the drilling platform. With this fleets PT. APX has become the most well-known drilling contractors with operating areas covering domestic and foreign region.
Onshore Business Unit
The onshore fleet consists of eight (8) rigs where all rigs are operating only in Indonesia. Its main clients are Chevron, Vico Indonesia, Pertamina Hulu energy and Supreme Energy. Here PT. APX has more advantages than its competitor as most of its onshore rigs have a higher horse power, more than 1000 HP (Horse Power), that allows the rigs to work more efficiently.
The overall performance of the onshore business unit is showing good results with 16 percent increase in performance in 2013 and overall utilization rate of 63 percent (Annual Report PT. APX, 2013).
In the onshore business unit, PT. APX is in competition with mainly local companies as foreign companies are not really interested to play on this segment.
Offshore Business Unit
For the offshore business unit, PT. APX has two (2) jack-up rigs and four (4) submersible swamp-barge rigs. The first jack-up rig acquired was the rig Raniworo in 1995, while the more recent super premium rig, Soehanah, was completely build in 2007. The jack-up rigs are mobile units that could move and have self-elevating platform with legs that could go down until the sea bed. The submersible swamp-barge rig is used for drilling in the shallow water like in the swamp area or river delta with water depth around 30 feet. Currently all the offshore rigs are operating in the Mahakam Block of Total E&P Indonesia, a main client of PT.APX.
PT. APX has also one (1) unit Floating Production, Storage and Offloading (FPSO) which is used as offshore facility to do the processing and the storage of oil and gas. The FPSO is named Sea Good 101 and it was made in a shipyard in Guangxi Wuzhou in 1998. The FPSO could process 20.000 barrel of oil and 16.000 barrel of water per day and has the capacity to store 40.000 barrel of oil and 60 million standard cubic feet of gas per day. In Indonesia, PT APX is the only drilling company who owns an FPSO and this fact put PT. APX as the only
player in this niche market. The FPSO recorded a 100 percent utilization rate secured though a solid contract with Santos (Sampang) Ltd.
In the offshore business unit, PT. APX is in competition with mainly foreign companies. This business segment is marked by high capital intensive which correspond directly to high business risk. The aggregate supply of offshore rigs in the country is always below the aggregate demand, mainly due to the limited number of fleets currently available and also due to the fact that there is local regulation that put control to the hire of floating rigs with foreign flags (Cabotage Law, INPRES no.5/2005).
2.2.3. Overview Company’s Performance
In the year 2013, PT. APX has been successful to improve the utilization rate of its fleet to become 91 percent for the offshore business unit and 63 percent for the onshore business unit. The increase in the utilization rate is clearly reflected in the number of wells completed, which are 124 wells from only 111 wells in the previous year.
The increased utilization of the rigs directly impacted the financial performance of the company with increasing revenue of 24.3 percent (to become USD 259.6 M) and increasing net income of 26 percent (to become USD 49.2 M). The recorded EBITDA (USD 113.1 M) is also showing 21 percent increase from last year record.
In terms of safety, PT. APX has not been successful in reaching its own target of zero TRFR (Total Recordable Frequency Rate), but managed to maintain a score of 2.42, still below the standard score of 3.23 set by International Association of Drilling Contractors (IADC).
2.3Strategic Management
2.3.1. Concept and Definition
Fred R David defined strategic management as the art and science of formulating, implementing, and evaluating cross functional decisions that enables an organization to achieve its objectives. Strategic management is therefore focused on integrating management, marketing, marketing, finance/accounting,
production/operations, research and development, and information system to achieve organizational success (David, 2013).
Thompson (Thompson, Peteraf, Gamble, & Strickland III, 2014) explained strategy as company’s action plan for outperforming its competitors and achieving superior profitability. Strategy here is representation of managerial commitment to integrated choices about how to compete. The choices involved here includes How to attract and please customers; How to compete against rivals; How to position the company in the marketplace; How to best respond to changing economic and market conditions; How to capitalize attractive opportunities to grow business; and How to achieve company’s performance targets. The objective of good strategy is not only to gain competitive success in the short run, but rather to gain lasting success that can support growth and secure the company’s future in the long run.
Company strategy provides direction and guidance in terms of what company should do and should not do. Knowing what not to do can be as important as knowing what to do, as making wrong strategic moves will prove distraction and a waste of company resources. The essence of any strategy is the action and moves that managers are taking to gain competitive advantage over rivals.
2.3.2. Strategic Management Model
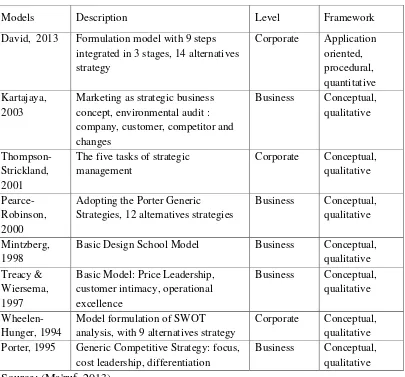
A model can be used to represent the process of strategic management. Even though a model cannot guarantee a success, it can represent a clear and practical approach to formulate, implement and evaluate strategies. There are several models of strategic management that have been developed to date, and according to Ma’ruf (Ma'ruf, 2013) they can be summarized as seen in Table 1. Strategic Management Models .
Table 1. Strategic Management Models
Models Description Level Framework
David, 2013 Formulation model with 9 steps integrated in 3 stages, 14 alternatives
Basic Design School Model Business Conceptual, qualitative Porter, 1995 Generic Competitive Strategy: focus,
cost leadership, differentiation
Business Conceptual, qualitative
Source: (Ma'ruf, 2013)
Fred R David developed a comprehensive model of strategic management process which will be used on this research to formulate the strategy for PT. APX. The reason why David’s model is selected is because it is the only model that provides a quantitative and comprehensive framework for formulating corporate strategy. The other models developed by Thompson (Thompson-Strickland, 2001) and Wheelen (Wheelen-Hunger, 1994) provides only conceptual and qualitative framework.
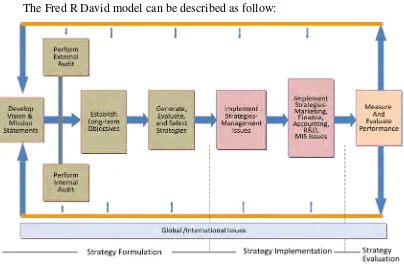
The Fred R David model can be described as follow:
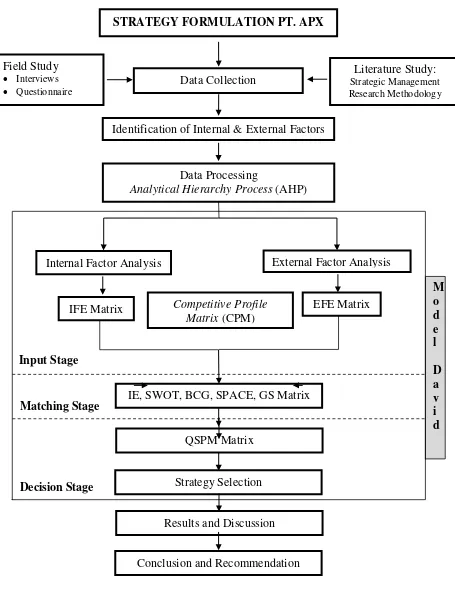
Figure 1. Comprehensive Strategic Management Model, Source : (David, 2013)
According to David the process of strategic-management consists of three stages (see figure 1): strategy formulation, strategy implementation, and strategy evaluation. Strategy formulation includes developing a vision and mission, identifying organization’s external opportunities and threats, determining internal strengths and weaknesses, establishing long-term objectives, generating alternative strategies, and choosing particular strategies to pursue. The issues in strategy formulation include deciding what new business to enter, what business to abandon, how to allocate resources, whether to expand operations or to diversify, whether to enter new markets, whether to merge or form joint venture, and how to avoid takeover.
Strategy implementation requires a firm to establish annual objectives, devise policies, motivate employees, and allocate resources so that formulated strategies can be executed. This stage includes developing a strategy-supportive culture, creating an effective organization structure, redirecting marketing efforts,
preparing budgets, developing and utilizing information systems, and linking employee compensation to organizational performance.
The strategy evaluation stage is where strategies are evaluated to know whether they are working well or not. Strategies are subject to future review if the external and internal factors are significantly changed. Three fundamental strategy evaluation activities are: 1. reviewing external and internal factors that are the bases for current strategies, 2. measuring performances, and 3. taking corrective actions.
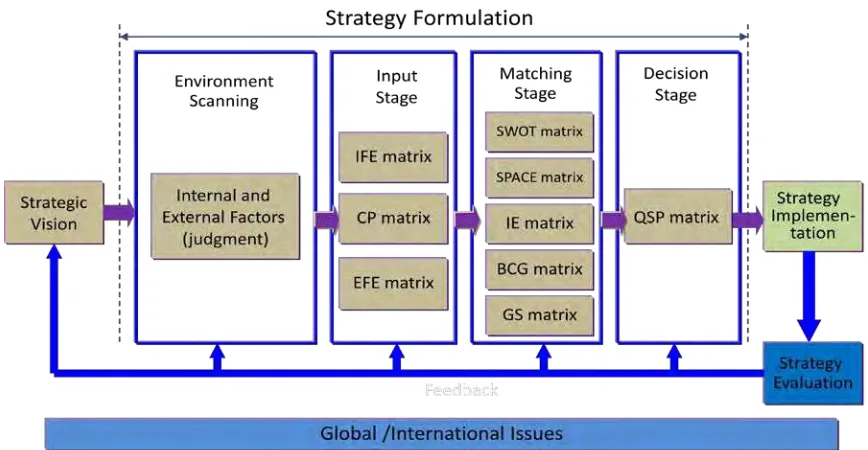
This thesis will utilize the three stages approaches to strategic management developed by David to formulate the strategy for PT. APX.
Figure 2. The Developed David’s Formulation Model Source : (Ma'ruf, 2013)
2.4Types of Strategies
According to David (David, 2013), there are eleven alternative strategies that a company could pursue; they are forward integration, backward integration, and horizontal integration under Integration Strategies Group; market penetration, market development and product development under Intensive Strategies Group;
related diversification and unrelated diversification under Diversification Strategies Group; retrenchment, divestiture and liquidation under Defensive Strategies Group.
Integration Strategies:
1. Forward Integration: this strategy aims to gain ownership or to increase control over distributors or retailers.
2. Backward Integration: this strategy aims to seek ownership or to increased control over company’s suppliers. This strategy will work best when a company’s current suppliers are unreliable, too costly, or cannot meet the firm’s needs.
3. Horizontal Integration: this strategy aims to seek ownership or to increased control over a company’s competitors.
Intensive Strategies:
4. Market Penetration: this strategy aims to increase market share of company for present products or services in present markets through greater marketing efforts.
5. Market Development: this strategy will develop market by introducing present products or services into new geographic areas.
6. Product Development: this strategy aims to increase sales by improving or modifying present products or services.
Diversification Strategies:
7. Related Diversification: this is a strategy to diversify product or services across businesses with related value chain.
8. Unrelated Diversification: this is a strategy to diversify product or services across businesses with unrelated value chain.
Defensive Strategies:
9. Retrenchment: this is a strategy to regroup a company through cost and assets reduction to reverse declining sales and profit.
10.Divestiture: this strategy will sell a division or part of a company to raise capital for further strategic acquisition or investments.
11.Liquidation: this strategy will sell all company’s assets, part by part, for their tangible worth.
2.5Analysis of Business Environment
Formulating or developing strategy begins with assessment of company’s current situation. Within this framework two aspect of company’s situation are therefore necessary to be analyzed: 1. the competitive situations in the industry where the company operates or its external environment; and 2. the company’s resources and organizational capabilities or its internal environment.
Analysis of the external environment of a company or external audit is aimed at identifying and evaluating trends and events beyond the control of a company. The purpose of external audit is to show the key opportunities and threats faced by company and to help managers to formulate the right strategy taking advantage of the opportunities and avoiding or reducing the impacts of threats (David, 2013).
External audit will be able to identify the key external forces that must be considered before formulating the right strategy for a company. The external forces are normally classified into five categories: 1. economic forces; 2. social, cultural, demographic and natural environment forces; 3. political, governmental and legal forces; 4. technological forces; 5. competitive forces (David, 2013).
On the other hand, analysis on the internal environment will focus on identifying and evaluating the strength and weaknesses of the company’s business, including management, marketing, finance/accounting, productions/operations, research and development, and management information system. The objectives and strategy of the company after an internal audit will focus on capitalizing internal strength while overcoming weaknesses.
Performing the external audit and internal audit for each different business unit, the onshore business unit and the offshore business unit, will be the first step to do before establishing the long term objectives of a company.
2.6Analytical Hierarchy Process (AHP)
AHP is a decision making support model developed by Thomas L Saaty in 1988. This model is commonly used to solve complex problems with multi criteria and multi factor by structuring the problems into hierarchy. Hierarchy is
defined as a representation of a complex problem in a multi-level structure where the first level being the objective, followed by level of factors, criteria, sub-criteria and so on until the lowest level of the decision alternatives. With this hierarchical model, the problem can be translated into a systematical and structural way for decision analysis.
The principle of this model is to accommodate cognitive aspects, experiences and subjectivity of decision makers as the basic input for the decision analysis process.
To make decision in organized way the common steps are: 1. Construct the hierarchical decision elements
a. Define the problem
b. Structure the decision hierarchy from the top with the goal of the decision, then the objectives from a broad perspective, through the intermediate levels (criteria on which subsequent elements depend) to the lowest level (which usually is a set of the alternatives).
2. Construct a set of pairwise comparison matrices using the Saaty Scale (Table 2. Saaty Scale). Each element in upper level is used to compare the element in the level immediately below with respect to it.
3. Define the priority level and the importance weight of each criteria (decision element) from the pairwise matrices of each level of hierarchy. 4. Conduct the consistency test for each pairwise comparison for each level of
hierarchy.
5. Synthesize and aggregate each decision element for all level of hierarchies
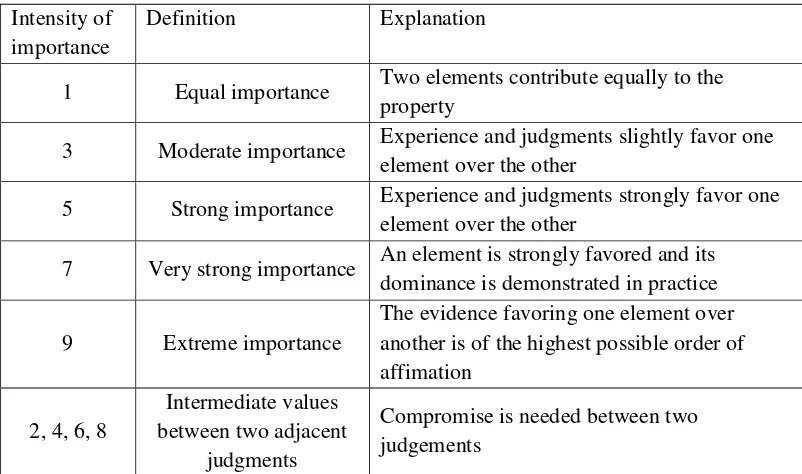
Table 2. Saaty Scale
Intensity of importance
Definition Explanation
1 Equal importance Two elements contribute equally to the property
3 Moderate importance Experience and judgments slightly favor one element over the other
5 Strong importance Experience and judgments strongly favor one element over the other
7 Very strong importance An element is strongly favored and its dominance is demonstrated in practice
9 Extreme importance
The evidence favoring one element over another is of the highest possible order of affimation
Several researches had been conducted with the topics of corporate strategy development. Arif Fadjar Nugraha (2006) used the method of Fred R. David and the tools AHP in his research about strategy formulation for power generator project to gain market share by utilizing local resources.
Another research had also been conducted for the war vessel division of PT PAL Indonesia by Cahyono (2006) using the framework developed by Fred R David and also using AHP in processing the data. He started the research as the respond to the significant decrease in the war vessel division’s sales. Here he found that the current strategies of PT PAL Indonesia were already out-dated and cannot support the competitiveness of the company in the industry as they were no longer relevant in the business environment where the company operated.
A more recent research was conducted by Taufiqurrohman (Taufiqurrochman, 2013) where he tried to developed the right corporate strategy for a chemical company in order to survive the competition using also the Fred R David approached and AHP.
This particular research that is now being conducted will focus to formulate strategy for a National Drilling Rig Company in order to sustain his
competitiveness in the local and regional market. The business environment of drilling industry is heavily influenced by external and internal factors, locally and globally, considering the nature of high capital investment and high technology requirement, to survive in the industry the company management will have to develop and to set the right strategy so that the company could take advantages from its strength and gain the most business opportunity that are available by ensuring that its weaknesses will not be the obstacles to grow. This research will try to identify the main external and internal factors that are present in the industry for each different business units of PT. APX and will formulate the corporate strategy based on the David’s approach.
CHAPTER 3
RESEARCH METHODOLOGY
The research methodology is very important to be used as guidance to ensure that the research is going systematically in accordance with the selected methodology and will get a satisfactory results and benefits for the stakeholder. In order to achieve desirable objectives, a clear research outline is necessary to assist and to guide the researcher with step by step action in solving the problems. With a systematic research outline, the research will be easier to be conducted.
3.1.Methods and Research Outline
3.1.1. Research Methodology
According to Hussey (Hussey & Hussey, 1997), methodology refers to the overall approach to the research process from the underpinning to the collection and analysis of the data. Here methodology concerned with the following main issues:
• Why certain data is collected?
• What data is collected?
• From where the data is collected?
• When the data is collected?
• How the data is collected?
• How the data will be analysed?
According to Arikunto (Arikunto, 2006), research methodology is the methodology used by researcher in collecting research data through questionnaires, interviews, observations, testing and documentation. The methodologies are basically a scientific way to get data for certain objectives and purposes.
The approach used in this research is by collecting data through questionnaires, interviews and observation. For data analysis, the methodology of Analytical Hierarchy Process (Saaty, 1988) will be utilized along with the methodology of strategic management developed by Fred R. David (David, 2013).
3.1.2. Research Framework
This research will consist of several stages which will be started by identification stage, where data collection will be conducted by doing preliminary studies of PT. APX or through internet to ensure the availability of data. Data will be acquired though primary sources or secondary sources. Questionnaires and interviews will be the primary sources to get primary data while review of literature and company’s publications will be the way to get secondary data.
The next stage of the research will be data processing where several methods will be used. The last stage will be analysis and discussion followed by conclusion and recommendation. The research framework is described on the picture below.
Figure 3. Research Framework
Internal Factor Analysis External Factor Analysis
3.2.Collecting and Processing Data
3.2.1. Collecting Data
Data collection is the stage to acquire information from various sources in order to feed the research for further analysis. In this research, data is mainly acquired through literature and field study.
The literature study is required in order to have a good platform and framework for the research. The study will be conducted to the literature related to research topic to ensure that the concept is systematic, logic and acceptable in the academic environment. The literature study is also important to find the underlying theory related to the topic of research.
The purpose of field study is to know the real conditions of the object being studied so that researcher could get a clear picture before processing the data. It is well understood that some data might be un-available or missing, and in this case logical assumption will be used whenever required. The field study will allow the researcher to know the vision and mission of the company, its objectives and its core business. The study will also help to understand the external and internal conditions of the company along with its competitiveness.
On this research, the field study is conducted by making direct observation, doing interviews and launching questionnaires to respondents. The respondents are selected from internal parties in PT. APX and also from external parties who have direct relations with PT. APX, or un-direct business relation in the industry. Some experts from Market Survey Company and from drilling services industry are also invited to participate in the questionnaire.
There are five (5) different questionnaires developed for this research with different but related purposes. The questionnaires are:
1. Questionnaire #1: to identify the internal and external factors which impact the company and the degree of importance among the internal and external factors of the industry.
2. Questionnaire #2: to analyze the degree of importance between sub-factors 3. Questionnaire #3: to analyze company’s position related to its competitors. 4. Questionnaire #4: to analyze the attractive score (AS) of different factors
against different strategy alternatives.
The questionnaires used on this research are the type of closed questionnaires using the Likert Scale, where respondent is requested to select the scale which is closely reflected their opinion or knowledge/experience. By using this type of questionnaires, respondents will not need long time to respond and the data processing will become easier.
3.2.2. Processing Data
After all the data is collected, the next step is to do validity and reliability testing to the data. The validity testing is aimed to know if the data is valid or not, while the reliability testing is to measure whether the questions reliable or not.
When the data testing is completed, the next steps are to analyze the impacts of different variables to the given factors. This is done by giving weight on the factors using the Analytical Hierarchy Process (AHP) method. The AHP will be run with the software Expert Choice. The weight will later be used to construct the strategic management model based on Fred R. David as explained in chapter two (2) which consists of developing the IFE / EFE matrix, the SWOT matrix, the IE matrix etc.
3.3.Analysis of Business Environment
Environment analysis of a firm will consist of external analysis and internal analysis (David, 2013). An external analysis focuses on identifying and evaluating trend and event beyond the control of a firm, like increased of foreign competition, changes in demography or population, stock market volatility and unstable exchange rate. The external audit would reveal key opportunities and threats confronting an organization so that management can formulate to take advantage of the opportunities and to avoid or reduce the impact of the threats. On the other hand, the internal analysis will focus on identifying and evaluating a firm’s strengths and weaknesses in the functional area of business, including management, marketing, finance/accounting, production/operations, research and development and management information system.
When the external analysis and internal analysis have been conducted and management has acquire the information related to its strengths and weaknesses and also the opportunities and threats, then management will be able to establish
the company’s long term objectives as the first step to develop the corporate strategy.
3.3.1 External Factor Evaluation (EFE) Matrix
External Factor Evaluation (EFE) matrix is used to summarize and evaluate the external factors impacted the company like economic, social, cultural, demographic, environmental, political, governmental, legal, technological and competitive information. This matrix can be developed in five steps (David, 2013):
1. List key external factors as identified in the external evaluation process. The factors will be grouped separately under the heading of “opportunities” and “threats”.
2. Assign to each factor weight that ranges from 0.0 (not important) to 1.0 (very important). The weight indicates the relative importance of that factor to being successful in the firm’s industry.
3. Assign a rating between 1 and 4 to each key external factor to indicate how effectively the firm’s current strategies respond to the factor, where 4 = the response is superior, 3 = the response is above average, 2 = the response is average and 1 = the response is poor.
4. Multiply each factor’s weight by its rating to determine a weighted score.
5. Sum the weighted score for each variable to determine the total weighted score for the organization.
3.3.2 Internal Factor Evaluation (IFE) Matrix
Internal Factor Evaluation (EFE) matrix is used to summarize and evaluate the major strengths and weaknesses in the functional areas of business, and it also provides a basis for identifying and evaluating relationship among those areas. Intuitive judgments are required in developing an IFE matrix. This matrix can be developed in five steps (David, 2013):
1. List key internal factors as identified in the internal evaluation process. The factors will be grouped separately under the heading of “strengths” and “weaknesses”.
2. Assign to a weight that ranges from 0.0 (not important) to 1.0 (all important) to each factor. The weight assign to a given factor indicates the relative importance of that factor to being successful in the firm’s industry.
3. Assign a 1 to 4 rating to each factor to indicate whether the factor represent a major weaknesses (rating = 1), a minor weaknesses (rating = 2), a minor strength (rating = 3) or a major strength (rating = 4).
4. Multiply each factor’s weight by its rating to determine a weighted score for each variable.
5. Sum the weighted score for each variable to determine the total weighted score for the organization.
3.3.3Competitive Profile Matrix (CPM)
The Competitive Profile Matrix (CPM) identifies the company’s major competitors and its particular strengths and weaknesses related to that of company. The weights and total weighted scores in both a CPM and an EFE matrix have the meaning. The difference is that on the CPM matrix, the critical success factors include both internal and external issues. The rating assigned to each of the critical success factor refer to strength and weaknesses, where 4 = major strength, 3 = minor strength, 2 = minor weakness, and 1 = major weakness.
3.4. Strategic Analysis
3.4.1. Internal External (IE) Matrix
The IE matrix (also called the portfolio matrix, a similar name given also to BCG matrix) is useful to explain the position of different division within an organization into a nine-cell display. This matrix is constructed by combining the EFE matrix and the IFE matrix into one graph where the IFE total weighted score will be the x-axis and the EFE total weighted score in the y-axis. The IE matrix is divided into three different parts where each part will have different strategy alternatives.
3.4.2. SWOT Matrix
The SWOT matrix is a matching tool that is used to develop four types of strategies: SO (Strength-Opportunities) strategies, WO (Weakness-Opportunities) strategies, ST (Strength-Threats) strategies and WT (Weakness-Threats) strategies. Good judgment and expert discussion might be required in developing SWOT matrix.
3.4.3. SPACE Matrix
As explained by David (David, 2013), the SPACE matrix is a four quadrant framework that indicates whether aggressive, conservative, defensive, or competitive strategies are most appropriate for any one organization. The axes of the SPACE matrix represent two internal dimensions (financial position [FP] and competitive position [CP]) and two external dimensions (stability position [SP] and industry position [IP]).
3.4.4. BCG Matrix
The BCG matrix described graphically the differences among divisions of a company in terms of relative market share position and industry growth rate. The BCG matrix allows multidivisional organization to manage it portfolios of businesses by examining the relative market share position and the industry growth rate of each division relative to all other divisions in the organization.
3.4.5. Grand Strategy (GS) Matrix
The GS matrix is based on the two evaluative dimensions: competitive position and market (industry) growth. Any organization can be positioned in one of the GS matrix four strategy quadrants (David, 2013).
3.4.6. Quantitative Strategic Planning Matrix (QSPM)
The QSPM is an analytical technique designed to determine the relative attractiveness of feasible alternative actions. It is also tool that allows strategist to evaluate alternative strategies objectively, based on previously identified external and internal critical success factors.
The positive features of this technique are that sets of strategies can be examined sequentially or simultaneously. Another positive feature is that it requires strategist to integrate pertinent external and internal factors into the decision process.
The limitation of this technique is that it always requires intuitive judgments and educated assumptions. Another limitation of QSPM is that it can be only as good as the prerequisite information and matching analysis upon which it is based. To minimize misjudgment, expert discussion maybe conducted.
This page is intentionally left blank
CHAPTER 4
STRATEGY FORMULATION
4.1 Evaluation of Vision and Mission
The evaluation of PT. APX’ vision and mission is conducted in accordance with the approach developed by Fred R David (David, 2013), where he introduced nine characteristics that must be met by good vision and mission. The nine characteristics are described below and it will be used to explain how the vision and mission fit in the framework:
Table 3. Vision & Mission Evaluation
Criteria Description Explanation Rating
1 Customers Who are the
firm’s
customers?
The drilling activities could be
performed in many business sector like
oil & gas sector, mining sector and
geothermal sector and considering the
corporate vision to be “ a world class
drilling contractor “ , it can be
concluded that the customers are all
the companies who is actually doing
drilling activities in their operation.
APX wants to be world class contractor
or to compete in the global market.
*****
4 Technology Is the firm
technologically
current?
The vision and mission do not explicitly
mention anything about technology, but
it could be inferred that to be a world **
class contractor PT. APX must always
The mission clearly said that it will
provide maximum value to all
PT. APX is committed to maintain a
high standard of safety and welfare to
the employees and will protect the
mentioned that PT. APX will ensure the
safety and welfare of employees and
will develop human resources to meet
global standard.
****
From the above description it could be concluded that the vision and mission of PT. APX are well constructed as it can explain clearly the nine characteristics or criteria set by of David for a good vision and mission.
4.2 Data Collection and Processing
The data is collected from various sources either from primary of from secondary sources. Primary data is collected from the questionnaires and from interviews with company’s management and several experts from PT APX’s client while secondary data is collected from industry report, technical journal and other information from the internet.
The process to identify the internal and external factors for both business division of PT.APX is conducted by reviewing industrial or market report related to drilling sector and also by having interviews with the key management personnel from the company (president director, GM operations) and several experts from Oil & Gas Company. Some interviews are also conducted with persons who are conducting market intelligence or market watch in the drilling sector. All the persons being interviewed are considered to have good knowledge and good experiences in the drilling industry to provide valuable information related to the business environments factors that influence the drilling sector.
4.2.1. Data Analysis
This research conducted the strategy formulation of two business division of PT. APX, the Offshore Drilling Division and the Onshore Drilling Division. In formulating the strategies, it is important to first identify the internal and external factors of the industry where both the business division is operating and to understand how the factors will impact the business division. David’s strategic management model is used to formulate the strategies where the formulation is divided into three main steps, the input stage, the matching stages and the decision stage. Besides the internal and external factors of the industry, additional information is also required for the input stage of the strategy formulation, like market share and profit per year to measure the growth rate of both business divisions.
The internal and external factors are identified based on the theory of strategic management developed by Fred R David (David, 2013), and also from several reference like technical report, market intelligence report and from discussion and interview with PT. APX key personnel. Several questionnaires were sent to the respondents to get the weight of importance of each different factor compare to other factors.
The respondents selected in this research are key personnel from PT. APX (President Director, GM Offshore, SC Manager), Head of Drilling Operation from client’s company and Market Intelligence Experts. All respondents are considered experts with significant experiences and knowledge about the industry. The validity and reliability of the results of the discussion, interviews and questionnaires are therefore justified.
In calculating the weight of each factor, the AHP method is used and the method provides an indicator to measure the consistency (Consistency Ratio) of each different respond. Here a valid respond should have a consistency ratio of less than or equal to 0.1.
Questionnaire #1 produced the weight of importance of each different factor and sub-factors of External and Internal environments that would impact the industry. Here there are five (5) criteria for each internal and external factor as per the theory of David (David, 2013) with three factors to explain further each of the criteria. In total there are fifteen (15) factors for Internal & External Environment respectively. The weight calculation is conducted using the AHP method, where each factors and sub-factors are compared to each other and the degree of importance are determined in order to get the weight.
Questionnaire #2 produced the respond of company on each different sub-factor of External and Internal environments which has been further classified as strengths and weakness for the internal factors and as opportunity and threat for the external factors. The classification and the rating were determined after discussion and interviews with key personnel of PT APX. It could therefore be concluded that the rating (respond) is valid.
Questionnaire #3 produced the success factors that are required to develop the competitive profile matrix. Here the critical success factors are identified and
the weight is determined using the AHP method. With the critical success factors and the weight of each success factor the CP matrix could be completed.
Questionnaire #4 identify the rating (respond) of PT APX on each of the critical success factors relative to other competitor. For Offshore Business Division, the competitors are foreign companies who are actively operating in Asia Pasific including Indonesia and are considered as the direct competitor of PT. APX, i.e Japan Drilling, Ensco and Transocean. For Onshore Business Division, the competitors are mainly local companies who are actively operating in Indonesia only and are considered as the direct competitor of PT. APX, i.e PT ELNUSA, PT. BORMINDO and PT. PDSI. The rating will be multiplied with weight of each success factor to give the final score of CPM for PT. APX and its competitors.
Questionnaire #5 produced the attractive score of each strategy selected by assigning a rating of each selected strategy to each internal and external factor which are applicable. From here, the QSP matrix could be completed and total attractive score of each selected strategy could be determined.
4.2.2. Data Validity Testing
The data from the questionnaire are obtained from respondents with good knowledge and experiences in the business, some of them can be considered experts and some are high level management from the PT. APX who is making day to day decision for its operations. The validity of the data is fully justified by the competencies of the respondents involved. The data acquired is therefore considered valid.
4.2.3. Calculating Weight of Factors & Sub-Factors
The internal and external factors for both Offshore Business Division and Onshore Business Division identified are described in Table 4. There are five main internal factors and external factors in the drilling business environment and each factor has three aspects of sub factors that would explain in a more detail the extension of the factor (see Table 4).
Table 4. Internal & External Factors - Offshore and Onshore Drilling Business
No External Factors Internal Factors
1 ECONOMIC FACTORS MANAGEMENT FACTORS
1.1 Oil & Gas Prices Management Know How
1.2 National Economic Growth Capability to adopt New Technology
1.3 Interest Rate Corporate Governance
2 SOCIO CULTURAL & ENVIRONMENT FACTORS RESOURCES FACTORS
2.1 Energy Demand Quality of Personnel
2.2 Environnent Régulations World Class Certification
2.3 Natural Resources Conservation Human Resources Development
3 POLITICAL, LEGAL & GOVERNMENTAL FACTORS FINANCE FACTORS
3.1 Oil & Gas Applicable Laws Financial Cash Flow
3.2 Local Government (Provincial)
Regulation Access to Capital Market
3.3 Local Content Requirement Long Contracts with Multinationals
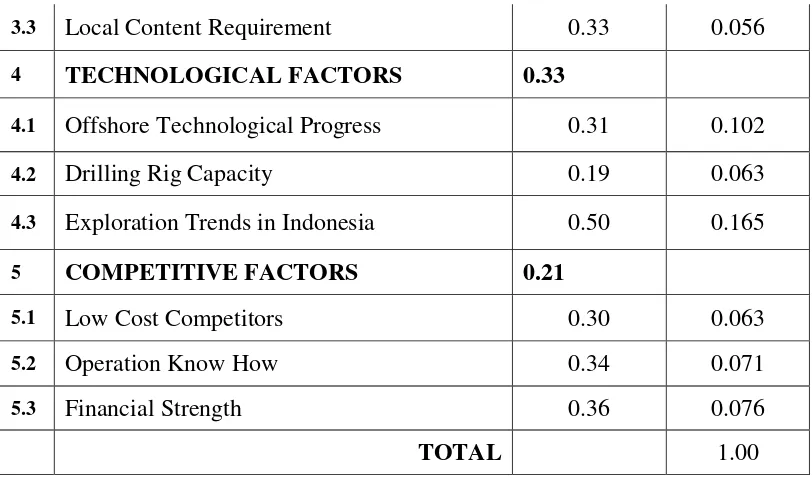
4 TECHNOLOGICAL FACTORS MARKETINGFACTORS
4.1 Offshore/Onshore Technological
Progress International Market Experiences
4.2 Drilling Rig Capacity Pricing Strategy
4.3 Exploration Trends in Indonesia Operational Achievement
5 COMPETITIVE FACTORS OPERATIONS FACTORS
5.1 Low Cost Competitors Excellent Performance
5.2 Operation Know How Good Customers Service
5.3 Financial Strength Numbers of Drilling Units
The next process after identifying the internal and external factors is to get the weight of the degree of importance between the factor and between the sub-factor within the same group sub-factor. The methodology to calculate the weight is by doing the pair-wise comparison as explained in the Analytical Hierarchy
Process (AHP) where one factor (in the left side) is compared by its degree of importance to other factor (in the right side) by using a scale of 1 to 9. The scale explained the degree of importance of one factor compared to another factor where scale one (1) means that both factors are equally important and scale nine (9) means that the one factor is absolutely more important than the other.
The data is processed by using AHPcal K.P. Goepel version 08.05.2013. The final result is the weight for each factor and the weight of each sub-factor within the same group factor. In calculating the weight, it is very important to ensure that the consistency of the comparison as different respondent will tend to have different view. The Analytical Hierarchy Process (AHP) has set a threshold for consistency ratio of less than 0,1 for each weigh to be considered valid.
The tables below described the weight for each external factor for Offshore Drilling Division and Onshore Drilling Division. Table 4 described the weight for each external factor of Offshore Drilling Division and Table 5 for each external factors of Onshore Drilling Division. The sum of the weight for each external factor is equal to one.
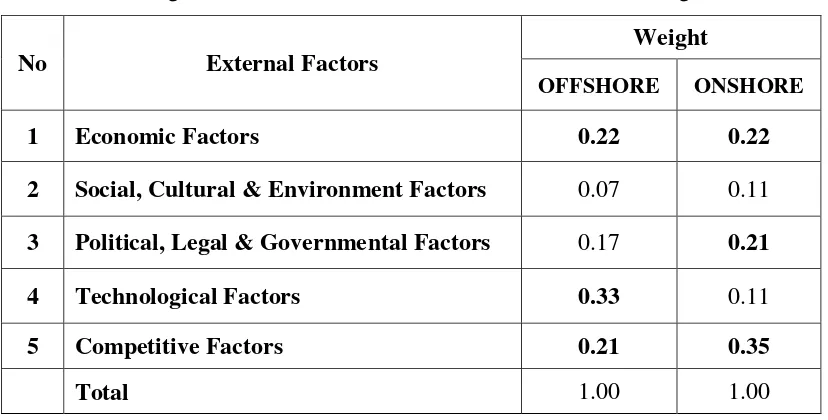
Table 5. Weight of External Factors – Offshore & Onshore Drilling Division
No External Factors
Weight
OFFSHORE ONSHORE
1 Economic Factors 0.22 0.22
2 Social, Cultural & Environment Factors 0.07 0.11
3 Political, Legal & Governmental Factors 0.17 0.21
4 Technological Factors 0.33 0.11
5 Competitive Factors 0.21 0.35
Total 1.00 1.00
From Table 5, the highest weight for offshore business division is the weight of Technological Factor (0.33) followed by the weight of Economic Factor (0.22) and followed by Competitive Factor (0.21). It is understood from the
weight that technology is a significant factor for the offshore business division. The technology factors here are explained as first the offshore technological progress. The progress of technology will highly impacted the direction of offshore drilling as nowadays the complexity and the difficulty of offshore drilling is increasing, New area of exploration is going to the deeper part of the ocean where technology will be the key to do the job. Thus the technological capacity of drilling rig will also determined how far or how deep a rig can perform the drilling operation, for example the longer the leg of an offshore rig the deeper it could go to perform the drilling activities. Technology will be the key driver of the drilling trend to go into a more complex and difficult areas.
For Onshore Drilling division the highest weight is the Competitive Factor (0.35) followed by Economic Factor (0.22) and Political, Legal and Governmental Factor (0.21). In this onshore drilling business, especially in Indonesia, the challenge of doing in-land drilling is already well known by most of the drilling contractor. For the in-land exploration area, technology doesn’t play as big a role as for the offshore drilling business to make a company becoming more competitive. Business will be more subjected to the price competition where normally the most cost effective company will be the one to get the project. This explained why the weight for the sub factor Low Cost Competitors is quite high from the questionnaires (0.53).
For the internal factors,
Table 6 below described the weight for each internal factor for Offshore Drilling Division and Onshore Drilling Division. The sum of the weight for each external factor is equal to one.
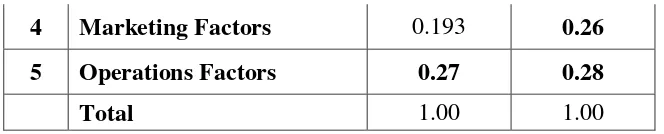
Table 6. Weight of Internal Factors – Offshore & Onshore Drilling Division
No Internal Factors
Weight
OFFSHORE ONSHORE
1 Management Factors 0.19 0.15
2 Resources Factors 0.14 0.14
3 Finance Factors 0.21 0.17