ScienceDirect
Procedia Computer Science 00 (2018) 000–000www.elsevier.com/locate/procedia
1877-0509 © 2018 The Authors. Published by Elsevier B.V.
Peer-review under responsibility of the scientific committee of the 4th Information Systems International Conference 2017.
4th Information Systems International Conference 2017, ISICO 2017, 6-8 November 2017, Bali,
Indonesia
Data Warehouse with Big Data Technology for Higher Education
Leo Willyanto Santoso*, Yulia
Petra Christian University, Siwalankerto 121-131 Surabaya, 60236, Indonesia
Abstract
Nowadays, data warehouse tools and technologies cannot handle the load and analytic process of data into meaningful information for top management. Big data technology should be implemented to extend the existing data warehouse solutions. Universities already collect vast amounts of data so the academic data of university has been growing significantly and become a big academic data. These datasets are rich and growing. University’s top-level management needs tools to produce information from the records. The generated information is expected to support the decision-making process of top-level management. This paper explores how big data technology could be implemented with data warehouse to support decision making process. In this framework, we propose Hadoop as big data analytic tools to be implemented for data ingestion/staging. The paper concludes by outlining future directions relating to the development and implementation of an institutional project on Big Data.
© 2018 The Authors. Published by Elsevier B.V.
Peer-review under responsibility of the scientific committee of the 4th Information Systems International Conference 2017.
Keywords: data warehouse, big data, academic, hadoop, higher education, analysis
1.Introduction
Higher educations are working in a more and more complex and competitive environment. They have to compete with other institutions to answer to national and global economic, political and social changes. Moreover, different stakeholders are expecting higher education institutions to produce right solution in a timely manner to these demands. To overcome this condition, higher education needs to produce the right decisions required for dealing with these rapid changes by analyzing vast data sources that have been generated. Most of higher education institution invest enormous resources in information technology to implement data warehouse system [1].
* Corresponding author. Tel.: +62 31 2983455.
The development of data warehouse is a way to extract the important information from the scattered data in some information systems into a centralized integrated storage and support the need for data history. This integrated data can be utilized for information delivery activities that can be reviewed from various dimensions and can be set the level of detail.
Further utilization of the information contained in the data warehouse is the activity of data analysis using certain techniques and methods. There are several algorithm for knowledge data discovery, like classifying, clustering and mining [2]. The data contained in the data warehouse can used as input for the application system for example like a dashboard. With the existence of this dashboard is expected to be a solution for the learning process to monitor the academic condition and then could take the right decision. However, organizations are recognizing that traditional data warehouse technologies are dying to meet new business requirements, especially around streaming data, real-time analytics, large volumes of unstructured and complex data sets.
To solve this problem, this paper aims to design and implement a modern data warehouse for academic information system to support decision making process. The designed system accommodates Hadoop platform, a powerful analytical tools which is able to produce a graph that displays the student data information statistically. To support parallel and distributed processing of large volumes of data, most solutions involve Hadoop technology. Hadoop is capable to perform analysis of large heterogeneous datasets at unprecedented speeds
As a result, top management will have a dashboard to monitor the existing condition of the academic atmosphere of university. The reporting dashboard itself will cover operational, strategic and analytical dashboard. The operational dashboards will tell us what is happening now, while strategic dashboards will track key performance indicators in academic process. Moreover, analytical dashboards will process data to identify trends.
The main contributions of this paper are as follows: (1) the designed system enables the communication among different platform and datasets, including smart phones, web, and desktop application whether it is structured, semi-structured and unsemi-structured data. 2) The system provides solution to the top level management in order to know the academic condition in their university. 3) the proposed system could be implemented to other university who need a decision support system for big data.
The remaining part of this paper is organized as follows. Section 2 presents the background and the related work. Section 3 presents the design of the system and section 4 present the testing of the proposed system. Finally, the conclusions are drawn in section 5.
2.Traditional Data Warehouse and Modern Data Warehouse
This section describes about traditional data warehouse and modern data warehouse. The differences between them are also discussed.
Data Warehouse is the combination of concepts and technologies that facilitate organizations to manage and maintain historical data obtained from operational and transactional applications [3]. It helps knowledge workers (executives, managers, analysts) to make quicker and more informed decisions. Data Warehouse is a new paradigm in strategic decision making environment. Data Warehouse is not a product but an environment in which users can find strategic information [4]. Data Warehouse is a place to store information that is devoted to help make decisions [5]. The Data Warehouse contains a collection of logical data separate from the operational database and is a summary. Data Warehouse allows the integration of various types of data from a variety of applications or systems. This ensures a one-door access mechanism for management to obtain information and analyze it for decision making. Data Warehouse has several characteristics [5, 6]: subject-oriented, integrated data, nonvolatile, time-variant, and not normalized.
Extract, Transform, and Load (ETL) is a data integration process that extracts data from outside sources, transforms the data according to business needs, and stores it into data warehouse [4]. The data used in the ETL process can come from a variety of sources including enterprise resource planning (ERP) applications, flat files, and spreadsheets.
Data warehouse support decision support system. Decision Support Systems (DSS) is a computer-based system that helps decision makers use the data and models available to solve problems [7]. DSS functions combine the resources of each individual with the ability of the computer to improve the quality of the decision. DSS requires data coming from various sources to solve the problem. Every problem needs to be solved and every opportunity and strategy requires data. Data is the first component of the DSS architecture. The data relate to a state that can be simulated using a model that is the second component of the DSS architecture. Some systems also have knowledge which is the third component of the DSS architecture. The fourth user interacts with the system through a user interface which is the fifth component in the DSS architecture. In building the DSS, it is necessary to plan a mature system accompanied by the preparation and incorporation of components well.
Data warehouse is widely implemented, including in the education industry. It is possible to implement data warehouse for typical university information system [8]. Academic data warehouse supports the decisional and analytical activities regarding the three major components in the university context: didactics, research, and management [9]. Data warehouse has important role in educational data analysis [10].
With the arriving of big data, traditional data warehouse cannot handle large amount of data [11]. In the past, educational data has been gathered mainly through academic information system and traditional assessments. However, it is increasingly being gathered through online educational systems, educational games, simulations and social media now. Huge workload, concurrent users and data volumes require optimization of both logical and physical design. Therefore, data processing must be in parallel. Moreover, traditional data warehouse cannot extract unstructured data that has varying data structure into information. Traditional data warehouse was design with the purpose of integrating structured data from transactional sources that is supported by OLAP-based analysis. It is the opportunity for big data technology to solve the problem. The integration between big data technology such as Hadoop and data warehouse is very important. To support parallel and distributed processing of large volumes of data, most solutions involve Hadoop technology [12, 13]. Hadoop is capable to perform analysis of large heterogeneous datasets at unprecedented speeds.
The Table 1 summarizes the characteristics of traditional data warehouse and modern data warehouse, from the several point of views like the purpose, data sources, scope, architecture, technology, and end-user.
Table 1. The characteristic of traditional data warehouse and modern data warehouse
Characteristics Traditional Data Warehouse Modern Data Warehouse Purpose Treatment of collected data for a specific
business area that is integrated, non-volatile and time-varying. It supports decision-making process.
Processing of structured, semi-structured, and unstructured data, from diverse sources and the volume of data exceeds the ability of traditional tools to capture, store, manage and analyse them. Data source Usually transactional and operational
databases. Various sources and data types (social media, sensors, blog, video, and audio). Scope The integrated structured data to support
Business Intelligence (BI) and Online Analytical Processing (OLAP).
Analyse and discover knowledge from large volumes of data characterized by the 4Vs (volume, velocity, variety and veracity)
Architecture Oriented to processes of extraction, transform and load (ETL). Star schema is the appropriate solution for the architecture.
The architecture is depends on the problem. There is still no reference architecture or standardized terminology. They are some proprietary and product-oriented architectures from the vendor. Technology The technology is mature and tested tools in
large amount applications, both free and licensed software.
The technology is still growing. Hadoop is one of the open-source software
framework used for distributed storage and processing of dataset of big data
End-user Business analysts or top managements who do not require specific knowledge of technologies or data exploration.
3.System Design
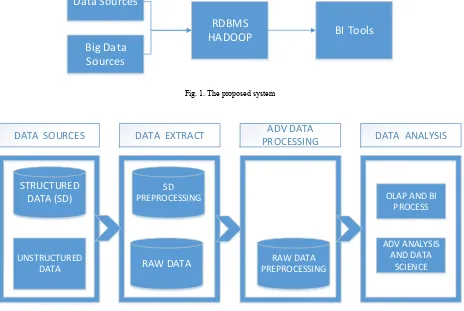
ETL is the main process in traditional data warehouse technology which cannot handle unstructured data. In this system, we need a flexible ETL process which can handle several data quality issues, as for instance duplicated data, inconsistency data, and garbage data. The proposed system can be seen in Fig 1. In the system, there is a combination between Hadoop and RDBMS. Hadoop can enhances RDBMS as data ingestion/staging tool, but also as data management and data presentation platform.
Data Sources
Big Data
Sources
RDBMS
HADOOP
BI Tools
Fig. 1. The proposed system
DATA SOURCES
STRUCTURED
DATA (SD)
UNSTRUCTURED DATA
DATA EXTRACT
RAW DATA
SD PREPROCESSINGADV DATA
PROCESSING
RAW DATA PREPROCESSING
DATA ANALYSIS
OLAP AND BI PROCESS
ADV ANALYSIS AND DATA
SCIENCE
Fig. 2. The Architecture of System
4.Implementation and Testing
In this section will be discussed about the implementation of the system in accordance with the analysis and system design. The structured data comes from PostgreSQL databases, while unstructured data comes from social media such as Facebook, twitter and LinkedIn.
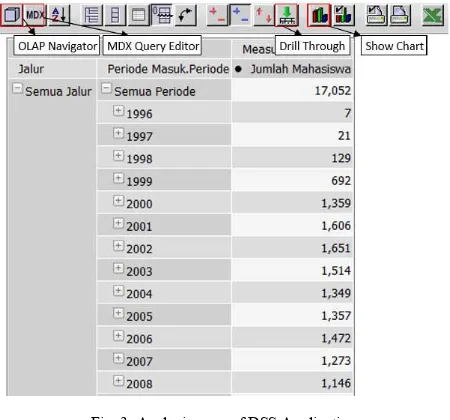
Figure 3 shows the analysis page. In this application, users could create new analysis so the report can be customised as they need. In every analysis, it is possible to produce some graphs or charts to support the generated report. Some advanced users need OLAP Navigator and MDX Query Editor to create powerful report.
Fig. 3. Analysis page of DSS Application
The sample chart can be seen in Figure 4. User can customised the type of the chart, so the generated report will be more meaningful for the reader.
Fig. 4. Chart page of DSS Application
Fig. 5. Advanced Analysis of DSS Academic
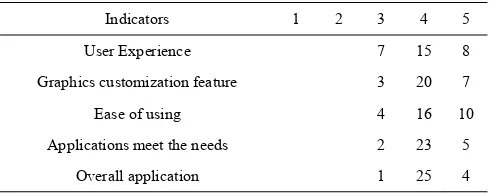
Questionnaires were distributed among thirty university staffs which cover from top management, middle management and bottom management. Rector and vice rectors are categorized as top management. In the middle management, it contains dean, vice dean and their staffs. Head of departments are grouped into bottom management. The assessed indicators include application interface, graphic customization features, ease of use of the application, ability to meet the user needs, and overall application. Detailed assessment of application usage can be seen in Table 2.
Table 2. Assessment of Application Usage
Indicators 1 2 3 4 5
User Experience 7 15 8
Graphics customization feature 3 20 7
Ease of using 4 16 10
Applications meet the needs 2 23 5 Overall application 1 25 4
Description of the rating scale: Value 1: Very bad
Value 2: Bad Value 3: Enough Value 4: Good Value 5: Very good
From the questionnaire responses, 77% of users has good user experience. Mostly, the respondents said the graphics customization feature is good. According to the users, 87% of application is easy to use. 93% of users said the applications meet the business requirements. Overall, 97% of survey respondents said that the application is good.
5.Conclusions
References
[1] Santoso, Leo Willyanto and Yulia. (2014) “Analysis of the impact of information technology investments - a survey of Indonesian universities.” ARPN JEAS 9 (12): 2404-2410.
[2] Santoso, Leo Willyanto (2011) “Classifier Combination for Telegraphese Restoration.” In: International Conference on Uncertainty Reasoning and Knowledge Engineering, Denpasar - Indonesia. DOI: 10.1109/URKE.2011.6007844
[3] Golfarelli, Matte and Stefano Rizzi. (2009) “A Survey on Temporal Data Warehousing.” Int Journal of data Warehousing & Mining 5(1): 1– 17.
[4] Ponniah, Paulraj (2010) “Data Warehousing: a Comprehensive Guide for IT Professional.” 2nd ed., New York:The McGraw-Hill Companies. [5] Reddy, G. Satyanarayana, Rallabandi Srinivasu, M. Poorna Rao, and Srikanth R. Rikkula. (2010) “Data Warehousing, Data Mining, OLAP and
OLTP Technologies Are Essential Elements To Support Decision-Making Process In Industries”. Int. Journal on Comp. Sci. and Eng. 2(9): 2865-2873.
[6] Gour, Vishal, S.S. Sarangdevot, G.S. Tanwar, and A. Sharma. (2010) “Improve Performance of Extract, Transform and Load (ETL) in Data Warehouse”. Int. Journal on Comp. Sci. and Eng. 2(3): 786-789.
[7] Turban, Efraim, Jay E. Aronson, Ting-Peng. Liang, and R. Sharda (2004) “Decision Support and Business Intelligence Systems”, 10th ed., New Jersey: Pearson Education, Inc.
[8] Youssef, Bassil (2012) “A Data Warehouse Design for A Typical University Information System”, Journal of Comp. Sci. & Research 1(6): 12-17, Dec. 2012.
[9] Dell’Aquila, Carlo, Francesco Di Tria, Ezio Lefons, and Filippo Tangorra. (2007) “An Academic Data Warehouse”, Proceedings of the 7th WSEAS Int. Conf. on Applied Informatics and Communications, Athens, Greece, August 24-26.
[10] Mirabedini, Shirin (2014) “The Role of Data warehousing in Educational Data Analysis”, Journal of Novel Applied Sciences 3(5): 1439-1445. [11] Salinas, Sonia Ordonez and Alba C.N. Lemus. (2017) “Data Warehouse and Big Data integration” Int. Journal of Comp. Sci. and Inf. Tech.
9(2): 1-17.
[12] S. G. Manikandan and S. Ravi. (2014) “Big Data Analysis Using Apache Hadoop,” in International Conference on IT Convergence and Security (ICITCS) 2014, pp. 1–4.
[13] J. Nandimath, E. Banerjee, A. Patil, P. Kakade, and S. Vaidya. (2013) “Big data analysis using Apache Hadoop,” 2013 IEEE 14th Int. Conf. Inf. Reuse Integr., pp. 700–703, 2013.