The 2
The 2
The 2
The 2
ndndndndManagement Innovation Technology International Conference
Management Innovation Technology International Conference
Management Innovation Technology International Conference
Management Innovation Technology International Conference
16-18 November
Conference Proceedings
Information Technology Management, Faculty of Engineering, Mahidol University
25/25 Putthamonthon sai 4 Rd., Salaya, Putthamonthon, Nakhonpathom
Management Innovation Technology International Conference
Management Innovation Technology International Conference
Management Innovation Technology International Conference
Management Innovation Technology International Conference
((((MITiCON2015
MITiCON2015
MITiCON2015))))
MITiCON2015
November 2015, Bangkok, Thailand
Conference Proceedings
Published by
Published by
Published by
Published by
www.miticon.org
Information Technology Management, Faculty of Engineering, Mahidol University
25/25 Putthamonthon sai 4 Rd., Salaya, Putthamonthon, Nakhonpathom
Editor
Editor
Editor
Editor
Sotarat Thammaboosadee
Associate Editor
Associate Editor
Associate Editor
Associate Editor
Yuttapong Aunhathaweesup
Jarurote Tippayachai
Management Innovation Technology International Conference
Management Innovation Technology International Conference
Management Innovation Technology International Conference
Management Innovation Technology International Conference
Information Technology Management, Faculty of Engineering, Mahidol University
! "
#
!
)* +
/
!
0!1
&" 1
/
!
" !
!
!
1
3 4
$
!5,
"!
1
!!
!
1
!!
!
.
1 !
! 1
!
1
!, 6
! #
,
!
#
1 1 !
!
1 1 !
!
, .
!
"!
#!
!
'!
""
!
#
"
$
! "
!
!
$
"
%
"
&
,
! !"11
-
% "
!1
!
$
"
2 "
!
!"11
!
"!
" !
#
0
!!
!
!
3 4
!5,
1
!
11
"
!
1 !
! "!!
! !!"
!
'
#
1
!
6
"
"!
!!
! 1
!
"
6
07"
1 1 !
!
! !
! #
1
!
" !
!
!
, .
1 1
# !
#
#
#
!
! 7"
1
8
"!
1
"" &
$
!
%
$
!
%
#
"
&
' ' (
!1
!
"
.
!
"!
!,
!
!
2
"
!!" !
!
!"
!
!! !!
!
1 !
"
!,
! !,
1 1 ! #
"
#
#
!
;
<
!1
!
"!
3
0 > , 2
>
'
'
4
>
0 6!! , -
, > , &
&" 1
/
!
"
,
0 &
$
>&2 &
-
5
;
1
! !!
!
1
;
1
! !!
!
@
6 !
!
!
"
!
1
"
!
(
,
61
"
!
B !
"
! # # "
'
!
# !
" !
"
7"
!
C
-,
!
!
! $ '
!
!
!
= "
'
6 "
/
!
>
.
-, &
1
?
$
"
2 "
!
1
!
"
- ,>
>&2 &
' 2
1
#
!
'
4
1 1
1 !
!
1 1
1 !
!
!
!
1
#
"
#
7"
$
"
%
"
1
"
"
&
' ' !1
A
!
,
# "
'
=1 !! " !
"
!"
!!,
'!
!
'
!1 ' !
1
!
! !!
!
1
"
"
! #
#
!
7"
!
, ? # !
"
! # !
!
""
!
#
!
5,
!
- ,>,
!
'
4/
!
!
"
"
# 0
!
#
"
&
' '
=1
A
#
"
!
1
1
1
!
!
# !
!
"
#
$$
%
$
"
! "
#"
"
$
&
'
(
))
'
*
+)), +
* -
'#
"$
$ .#
$
!
"
/
/
+ 0 *
+
1 $
2
( $
, +
$ ( #
,
$
(#*
$
"
(
!
#
$
%
&&
3
(
4
$
$
+
# #
"
#
#$
!
&
&5
& 6
)
+
7
"
'#
#
#$
'
!
(
)
)
3
/
(
'
+ $ 8
3 6
2
(
$
$
*
#$
.#
1#$
$$
9
$ $ #
#$
!
$
!
+
5
/ 33
+
# :
$ %$
0
$$ "
!
+
5
3& 36
+
$ $
; *
*
& &
$ +
" $
'
55
3/ &&
2 .#
"
7
(
-
2
$ "
1 $
#$
< # -
+
=
"
$$
$
+
! &
>
&
=
< #
1
+))
2
#
!
+
!
+
65
&
#
,
#$
; #)
)
*
&
$ !
+
!
#
% & "
&
"
$
!+ 3
/
'
$ +
+
) *
1
$
!
) $ 2 $ #
"
,
-
'
&
&
!+ >&
5 53
!
+
$ $
( $
$
%$
$
1
+
$ $
1+
!+ >5
5& 56
$
!
#
%$
#
*?
#
,
$ ( #
! )
)
$ "
$$
!
! '
#'%
&
!
&
&
(
1
>
5/ >
+ ( # #
!.#
)
(
@#
#$
(
$
2
$ ) @#
+
#$
4
(
'
' -
$
! &
(
)
)
1
>3 >6
%$
(
)
$
$#
*
)
$ 4 $
;
/
'
,
+ ,
+
'
1
&
>/ 63
+ ( % A
' =!
2!
)
$ +
"
( #
$
$#
( #
)
$
(
: !
0
+
1
6& 65
" )
$$
+))
@#
"
#
,
$
( #
)
:
(
2
"
1
$
&
1
>
6> /
+
) $
+
# $
2 #
8 #
" :
B
:
: "
(
"
$ $
'
$
1
3&
/ />
! )
! )
C !
)
#
" $)
$
# $
( #
$
=
! #
$ #
+
$
B "
))
$
1
3
/6
< # +
$ $
*
( #
1 $
+
:
) $
,
2
-
0
- 3
4
1
&
3
5
+
#$
) *
B
:
+*$ )
)
+
)
+
2#**
#$
,
(
)
)
1
&
>
/
2
2
#
'
#$
"
+
# $
- "
1
1
5
&
+ ( # #
!.#
)
(
@#
B 1
B
(-
$ +
#$
4
*
(
"
$
'$
&
(
)
)
!
#
"(
6
D'
*
:E
: (
, 1
'
# $B "
B
*
!
+))
$
!
+ -
&
!
+
!
+
"(
5
/
3
" $
'
$ +
< $
4
$ )
(#))
#
#
#$
, + ! )
( #
'
$ $
&
! " #
%
&
%
& "
&
)
3
&
/
)
$$
"
-
)
'#77 1 $
#
- :$
33
/ 3&
1
-
%$
4
.#
3
&
3
4
0
-3/
3
36
!
2
#$
!!;
-
# )
$$
'
- :
0
'
5
3/ &&
!
)
F
+
+
?#
("+2@4
1
"
'
'
'
3
1
5&
&
&/
+
!
)
(
$ +
+))
#$
2 *#$
) -
+*$ #
< #
#
$&
$
%
5
&
+ <
$
#$ +
#$
!
$$
(
$ 1 $
+(
!/>5 /& (
#
(
' #
$
1
$
%
5/
6
+))
2
2
( $
$
!
&
+
>
/ 53
+
)
!
2 #
+
+))
$)
- :$
!
!
+
>3
5& 5>
)
= $
+$)
$
? )
! )
+ #
1 $
(
;
>>
56 >
-
$
$ -
"
$$
+ !
)
= #$ (#
( $
"
$$
- $
+
-
3
>6
>3 >>
%$
" * * $
#
- :
3 +
F
2
+ - +
+
+
" $
>/
>6 6
)
$
1 -
(
) * $
+
+
* $
'
# $ !
F
2
- +
+
+ " $
+
63
63 65
#
%$
*
1 $
)
$
)
-!
#
&
&
!;
6> /
+ ( # #
!.#
)
!
"
!
"
!
!
$
#$
&
(
)
)
!; 36
/
/&
+))
+="
< 8 2
"
#
(
!
+ + !
!;
/
& +))
!
1#
" ?
!
+ + !
!; 53
)
$ *#
(
$ $
- :
$#
+
$$
!; 56
5
#)
=
= 7
$ < $ G
$
#$
(
!
H
$ ( #
$
'
$
$ '
, )
$ '
!; >
&
)
#
#
$)
!
&
'
!; /
$
1 $
( $
#$
"
*
+))
!
!
!
#
%
!
&
+ '
- :
! ) -
$
+#
*
$$
+
$
& &
1
-
$
3
$+
!
5
6
" )
<
$ ( #
$
1# )
%
$
+$
!
#
+!
(:
4 * #
:
4
"
++
&
!
>
/ 3&
+ ( #
2
$ )$
+
#
$
1
$
-
$
%$
;
$
( #
$
* &
!
$
!
+ -
&
!
+
!
&/
3
&3
+))
1
!
$$
!
+ + !
' $
!
!
!
&&
+))
@'
$
# $
1#
!
%
$
( #
$I A
4
B ;
B
!
)
#
+
#
,
$
!
)
# $ ) ( #
$
"
))
=
! #
$ #
1
$
"
!
&
5
/
$ #
2 $: 1
;#
+
$
( #
$ #$
$
!
+
!
>
5
5&
+
7
$
$
$
!
$
*
* $
;
$
"
(
3
3
$+ -
+ (
!
6>
5
56
$$
1 $
)#
(: $
(:
1 $
4
&
$ !
+
!
#
!
&
5/ >
การเปรียบเทียบประสิทธิภาพการทํางานของ
!
B
$
4
! 4
โดยใช ้ต ้นไม ้การตัดสินใจและตรรกศาสตร์คลุมเครือ
ณัฏฐพล นาคบัวแก้ว
สุภาภรณ์ เกียรติสิน
อดิศร ลีลาสันติธรรม
โษฑศ์รัตต ธรรมบุษดีสมิทธิ ดารากร ณ อยุธยา
>3 >/
การสรรหาเงินฝากเชิงกลยุทธ์ธนาคารออมสินในเขตอําเภอวิหารแดงจังหวัดสระบุรี
พรพรรณ รักนาค
ภูวรินทร์ นิลรังษี
ธีทัต ตรีศิริโชติ
6
6
6
มาตรฐานการบริการคนไร ้ที+พึ+งนนทบุรี ในสถานแรกรับคนไร ้ที+พึ+งนนทบุรี
ณัฐสินี วรัตน์กุลนันท์
นพดล เดชประเสริฐ
/
65 /
/3 /6
การพัฒนาคุณสมบัติของข ้อมูลสถิติเศรษฐกิจภาคต่างประเทศของธนาคารแห่ง
ประเทศไทย
รวี อาณานุการ
สุชนนี เมธิโยธิน
// 3 &
แนวทางการพัฒนาการจัดเก็บภาษีอากรและลดจํานวนผู ้เสียภาษีที+เป็นกลุ่มเสี+ยง
ของสํานักงานสรรพากรพื7นที+นนทบุรี
เรียม เขียนทอง
นพดล เดชประเสริฐ
3
3 /
แนวทางการปฏิบัติงานในการเข ้าถึงมวลชนของหน่วยทหารระดับกองร ้อยในพื7นที+
หน่วยเฉพาะกิจยะลา ระหว่างปี
>
วาทินี สุวรรณรักษ์
สุชนนี เมธิโยธิน
3
3
3
การบริหารจัดการที+ส่งผลต่อการมีส่วนร่วมในการพัฒนาสถานทํางานน่าอยู่ น่า
ทํางานของพนักงานและข ้าราชการ สํานักนโยบายและยุทธศาสตร์ สํานักงาน
ปลัดกระทรวงสาธารณสุข
สโรชิน สหสาคร
สุชนนี เมธิโยธิน
6
3 5 3
ผลกระทบจากอิทธิพลส่งผ่านของนวัตกรรมผลิตภัณฑ์ระหว่างสารสนเทศในการ
จัดการความรู ้และการบรรลุเป้าหมายองค์กร
นุจรี ภาคาสัตย์
ศักดิ+ชาย จันทร์เรือง
&>
3 3 3 6
การพัฒนาชุดจําลองเครือข่ายคอมพิวเตอร์บนพื7นฐานของ
#
,
การ
กําเนิด
F
จรัสพงศ์ กาญจนลักษณ์
เทอดพงษ์ แดงสี
ตุลย์ ไตรยสรรค์
พงษ์พิสิฐ วุฒิดิษฐโชติ
6
3 / 333
การประเมินประสิทธิภาพการดําเนินงานด่านชายแดนไทยด ้วยวิธีการวิเคราะห์การ
วางกรอบข ้อมูล
6
33& 33/
การเปรียบเทียบคุณลักษณะและประสิทธิภาพเครื+องแม่ข่ายเสมือนแบบก ้อนเมฆ
ของศูนย์ข ้อมูลกลาง
%
ระหว่าง ยูคาลิปตัสคราวด์และไมโครซอฟท์ซิสเต็ม
เซ็นเตอร์
ศรุต จันทรไกร
สุภาภรณ์ เกียรติสิน
อดิศร ลีลาสันติธรรม
สมิทธิ ดารากร ณ อยุธยา
6
3& 3&&
การตรวจหาภาพปืนโดยการแปลงลักษณะเด่นแบบไม่แปรผันตามขนาด
สุเมธ คํางําเมืองวีรพล จิรจริต
6/
3& 3&6
การวิเคราะห์สมรรถนะการทํางานของโรงไฟฟ้าพลังงานร่วม
,
กรณีศึกษา
อัญชิตา จิตตามัย
สุเมธ เนติลัดดานนท์
/
3&/ 3 &
การลดสัญญาณรบกวนข ้ามช่องใน
<4( $
โดยใช ้ทฤษฎีกบกระโดด
อติศักดิ+ จีบค้างพลู
นุสรา ฮวดโพธิ+พันธ์
อภิชาต ติรประเสริฐสิน
/
3
3 /
การจัดวางโครงสร ้าง
<4(
)
เพื+อลดเส ้นทางการเชื+อมต่อโดยใช ้ทฤษฎีกบ
กระโดด
วิไลพร แหว่กระโทก
สิทธิพงศ์ ชวนโพธิ+
พรภัสสร อ่อนเกิด
อภิชาต ติรประเสริฐสิน
/3
35 35&
การออกแบบจัดวางผังโรงงานเพื+อลดขั7นตอนการเดินทางโดยใช ้เทคนิคซัฟเฟิลฟร
อกลิปปิง
อนัญญา ศรีวงษ์
สิรินทิพย์ วันจันทึก
ประกาย นาดี
อภิชาต ติรประเสริฐสิน
/&
35 3>
$
;
$#
*
(
* %
$
' #
(
36
'
- :
,
)
'
!
" #
$
%
&
# %$$
" #
'
!
" #
$
%
&
# %$$
%( !( ) #
*!+#
,
# $*#
-.
,
#
.-# %*
/ 0
-
# $ 1- # ,
/
" )
# $,# ,.
2
)
3( +
# -$/# )1
1
2
# !
# !*
+
( ( /
#
# -$
3 "
# $,# ,.
*
4
3
"
# $,# ,.
!
# 1
4
# !
- "
+
"
#
$
) "
5
5
#
$
6
-
7 " #
$
"
4
#
$
2
#
$
* "
#
$
7 " 4
#
$
"
"
4
#
$
- "
+
"
#
$
-
-
"
#
$
!
4
# * $ *
+
%
"
# %$
4
# $
" 3
" #
$
) "
)
# )$
)
#
/$
*
!
4 8
# $
+
4# %$$
9
"
#
$
" +
9
" # %$$
4
)
"#
$
)
# *$
7 " 4
#
$
&
&
"
# ! $
%
&
# ! $
&
5
#
6
7 # %$$
9
"
#
$
!
9
*
"
"
9
;
(
" 7
9
9 "
""
" 9 "
9
9 "
""
"
9
"
"
"
.
(
"
9
7
9
$
!
"
#
3
"
"
(
"
" 8
" 7
"
"
3
:"
(
7
"
9
59 "
"" "
7
"( <,
=
"
"# 7
"
"
"(
"
"
(
"
"
"
#
9 "
"" 7
9
:"
/
:"
7
7 9
"
"
#
.
7
"
"
"
""
-
.-"
# "
!
"
"
" "(
( &
"
> ?( &
@
"
"
" 0
"
"
"
$
!
!
! %
"
"
"
"
>
( &
"
7
"( &
"
( -
#
9 "
9
" 7
(
"
9
"7
"
,
"
7
(
0
"
" 7
"
" 9 (
&
"
> &
&
"
0
A
A
" " ""
7
9 "
"(
$
%
"
@
"
"#
0
"
"
"
"
&
A
"
0
"
"
"
"#
"
"
7
"#
@
""
"
"
9
"
>
#
"
">
"
Information Format-Shopping Orientation Fit in
Mobile Commerce App:
A Contradiction between Functional and Psychological Consequences
Chiang-Yu, Cheng
School of Big Data Management, Soochow University, Taiwan.
taican.ccy@gmail.com
Yu-Tsu Lin
Department of Marketing and Logistics Management, Chaoyang University of Technology, Taiwan.
tsu@cyut.edu.tw
Chih-Wei, Cheng
Department of Applied English, Chaoyang University of Technology, Taiwan.
timcheng7687@gmail.com
Abstract—Mobile Commerce is the most prevalent way of shopping online that extends the transaction channel from traditionally fixed-line environment to ubiquitously mobile environment. With this advantage, retailers apply many mobile APPs to embrace such an extended channel for the purpose of profit amplifier. Although mobile APPs might be well qualified for getting in touch with more consumers than desktop shopping does, consumers with different orientations may shop differently in accordance to their shopping needs. For example, consumers with utilitarian orientation may spend less time in shopping because they know what they want to buy before getting into the APP. Conversely, consumers with hedonic orientation may spend more time in shopping as they enjoy taking around the store without the pre-established consideration list. These two shopping orientations result in a significant question, that is, what the information format presented on mobile APPs best fits the certain kind of shopping orientation. We suspect that consumers with utilitarian orientation may want to see information that is formatted to address their shopping needs efficiently, while consumers with hedonic orientation may need to have some information that is formatted to satisfy their needs of purposeless shopping. The current study aims to elaborate this important phenomenon using balance theory. We expect that a contradiction might happen as functional (information format) and psychological (shopping orientation) deployments cannot be reconciled simultaneously. Therefore, we suggest that the practitioners of mobile APPs need to identify consumers’ shopping orientations first and provide them with well-matched information format afterward.
Keywords—mobile commerce; mobile; APPs; shopping orientation; information format; balance theory
I. INTRODUCTION
Mobile technology is growing quickly which emerges the life of human being due to the prevalence of smartphone adoption. This phenomenon is consistent with the report conducted by eMarketer (2014) that the number of mobile users is significantly increasing worldwide and Asia
particularly receives the highest population which is up to 2.6 billion [1]. With this deluge, users can access different kinds of APPs without geographical limitation that encourages APP owners trying to figure out the attractiveness of mobile advertisements. Similarly, many governments take advantage of APPs conveying important policies to their compatriots. APPs, therefore, play an essential role of pipeline among APP owners, governments, and users [2]. On the other hand, retailers nowadays extent ubiquitous accessibility of APPs to their business models, so called M-economy. This implies that consumers can not only use their desktops for online activities, but also use their mobiles devices to conduct certain activities using APPs, such as mobile entertainments, mobile banking, or mobile shopping. Undoubtedly, mobile shopping is one of popular online activities found in the United State and the amounts of shopping APPs keep rising. Also, the user willing to taste the new types shopping APP and the most important things is during the user using the mobile device can gain the good shopping experience [3].
apps developers should consider the quality and durability so that can attract users to download the APP and keep using [6].
In view of this, our research will take shopping APP as a subject for exploring different information format how to affect the consumer decision making. First type is list type information format (list-type). Second is matrix information format (matrix-type). People can get the merchandise information by these two information format. List format offers more merchandise information and the matrix type shows the bigger picture. These different browsing modes might cause the conflict on visual and which one is more in line with the consumer’s demand.
Our research propose if the consumer didn’t have special purpose, the user prefer the hedonic and use the list browsing mode, the user can receive more detail information line by line. The user didn’t need to compare with others just search the product randomly. However, we propose people have the objective, the user will prefer the matrix browsing mode. We predict this mode can compare the lots of product at the same page because of users are focusing on the particular product and compare each elements.
In order to more deeply understand the user’s app using situation, we record the date through the analysis tools. First we use Google Analytic for collecting the user’s click information and second we use the scroll depth for collecting how much product have been browsing for the final decision. But the App preset the browsing view is showed the list version, consumer frequently didn’t know which way can achieve their goal. If this research can prove the different information format can show the different outcome. This achievement not only can help consumer to find their product by using less time but also helping the App developer on improving the interface design more efficiency.
II. LITERATURE REVIEW
A. Information Format
For the purpose of classify the lots of information, it can be divided into two types. First the information are sequenced as list, each line contain one product. Second the matrix type format, the mobile screen show 2*2 array, both including (picture, item name, price, etc.) We take two different formats into the user’s purpose for testing in what kind of situation the user will use what kind of format on browsing.
B. Orientation
When the users execute the App, they have different purpose to achieve. They probably have specific goal or just want to consume the time. If you’re trying to find out the product which matches your desire, you don’t want to waste too much time on browsing. Because you already know the product you want, so the showing result must fit to your need. Conversely, you are using the APP just without any objective, you will search the product by random. The time is not the first priority in this one. In the past literature point out the utilitarian and hedonic values as the final goal of shopping activities [7].Based on these situations we can dive two purposes by using the APP. First, the utilitarian is focus on
people who have main target and search the product name with the model number (e.g. IPhone 6 plus). Second, the hedonic is different from the utilitarian; this orientation is not for the particular item. While the user searching the result is showed varies cellphone (HTC, Samsung, etc.). Several researches also showed the utilitarian and hedonic values have significant impact on the perception for online users [8][9]. Therefore, in this study will discover the relationship between Information format and Orientation.
C. Funtional
Most people searching the website will use the features which offered for convenient. For example, if I want to see the latest news from Internet, you just set the date and the result will show the latest news at the top. It can make people find their subject more efficiency. The buyers are more interested in functional meaning by doing shopping [10][11]. In fact not everyone knows each function on the website and some even haven’t used more than twice. Because they not familiar with the interface or they have not noticed how powerful the functions bring to us. Though they didn’t use the functions they still could get the result but it was time-consuming. The researchers proposed the straddles which focus on designing, enabling, and enhancing valuable, functional, and user-friendly tools [12]. It’s worth to invest on the websites function [13]. If people doing the searching behavior at the same time use the right features they aim to, it will give the users to the good shopping environment. A well-designed website should be convenience and offer varieties products [14][15]. Over all, the shopping platform should be designed as a functional and easy to use so that can prevent elimination by other competitors.
D. Psychology
At the user’s perspective, when the decision making is related to the user’s shopping experience. There are some reasons will be considered by the consumer (price, brand, specification, past experience, etc.) It means the seller should notice the consumer’s aspect. The psychological recovery strategy also point out the situation should be ameliorated directly by showing concern for customer needs [16]. As a company owner, the outcome you received will depend what information you display for attracting people. A study suggested the web elements (attribute, and tools) combine will influence consumers’ psychological and behavioral reactions [17]. The consumer behavior reaction to the product is going to reflect on the psychology. There is a S-O-R model also can prove this phenomenon, when you receive the stimuli (s) by the environment that along of influence the consumer’s mental (O), which motivate their decision-making(R)[18]. So the mobile shopping environment is a new type of commerce, the situation of shopping should also make us feel satisfied then get more information moreover buy the product.
E. Balance Theroy
we compare two different brand shopping APP to
analyze the user’s feeling. Based on the P
-O-X theory,
we suppose the user (P), another APP (O), and the
competitor APP (X) for exanimating the balance
situation. We will make a best choice after you realized
the APPs quality. In our life, we won’t install the same
type application no matter in the computer or on the
mobile, unless it can complement each other. Hence, this
unbalanced phenomenon exist in our society, we
proposed the research model for improving this issue.
During the shopping process, each one can correspond
will lead this into a balance condition.
III. RESEARCH MODEL
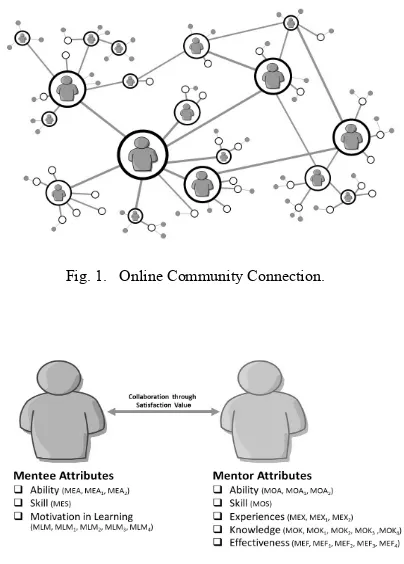
In the model we proposed two types of measures to evaluate the consumer’s shopping behavior. The first type is functional measures, which recording the consumer’s browsing information. It will detect how much content have been read. The second type is psychological measures, how will visual display produce metal effect to the consumers. Different information format might influence final decision. Based on the measures we suggest it can be matched to the information format (List type and Matrix type) and Orientations (Utilitarian and Hedonic). The following process will lead consumers into the place we proposed. Figure 1 shows the research framework.
A. The effects of information format on functional
The information format in the APP shopping environment plays the important role. Each format will show the different outcome on the screen. The format must design for the reason. Each type will show the different performance when consumer doing the shopping process. We can browse the product for saving the time. But how we know which type of format can help us find our product more efficiency. It will depend how much time we spend on browsing and how much content did we look through.
Therefore, we propose H1 as follows:
H1: The information format will affect the functional performance
B. The effect of information format on Psychology
The information format give two version when you using the mobile. The list version brings the users complete product information and the small picture. The matrix version offers the user a large picture but less information. In the psychology, you receive the similar information but the visual view is changed. The consumer probably will be influence by the visual. Some people like the large picture but some people like the more full content. The user’s psychology will be attracted in the different information format.
Therefore, we propose H2 as follows:
H2: The information format will affect user’s psychology
C. The effect of orientation on functional
We divided the orientation into two part, one is utilitarian another is hedonic. When the consumer shops on APP without any purpose, they could read each product slowly. Hence, consumer is trying to find the specific product, they would compare each product quickly and move to next page. So they won’t spend too much time at the same page. These two orientations will cause how long they stay on the page. In this phenomenon, we are going to explore the time they spend on search the product, and how many products have been browsed.
Therefore, We propose H3 as follows:
H3: The different orientation will cause functional performance
D. The effect of orientation on psychological
In the two orientations, the information they received probably have different feeling. The purpose of shopping will change the way you search. People want to see the detail information or see the large picture is not exactly the same. The utilitarian and hedonic which is fit the people’s psychology. When the consumers are partial of utilitarian, they are more evaluated the result of searching. The information completeness is not the most important reason. With the hedonic people are prefer the detail information, they can look through every product carefully. For more detail discover the relationship between the orientation and psychology.
Therefore, we propose H4 as follows:
H4: The different orientation will cause the psychological performance
IV. EXPECTED CONTRIBUTION
the company improve the existing APP and aim to the consumer’s perspective to design the interface. In the future, APP user’s behavior also will be discussed for making a better shopping environment.
REFERENCES
[1] Business Next Digital age (2015) “2015 Five Important Points on Mobile Evolution” available from:
http://www.bnext.com.tw/article/view/id/35049 [Accessed 18 June 2015]
[2] iThone (2013) “The mobile change the communication way” available from:
http://www.ithome.com.tw/node/80575[Accessed 25 June 2015] [3] Technology News (2015) “Flurry: 2014 APP rising rates 76%, Shopping
APP Leading the way” available from:
http://technews.tw/2015/01/07/app-usage-grew-76-in-2014-with-shopping-apps-leading-the-way/ [Accessed 29 June 2015]
[4] EZprice (2015), “Computer Shopping VS MOBILE SHOPPING” available from http://news.ezprice.com.tw/7520/ [Accessed 2 July 2015]
[5] Yahoo Emarketing (2015), “The Four key Factors, you must Know about Shopping APP” available from:
http://yahoo-emarketing.tumblr.com/post/120514855906/app [Accessed 8 July 2015]
[6] Common Wealth Magazine (2011), “APP Commercial” available from: http://www.cw.com.tw/article/article.action?id=5021169 [Accessed 12 July 2015]
[7] Gianluigi Guidoa, Alessandro M. Pelusob, Mauro Capestroa, and Mariafrancesca Migliettaa, “An Italian version of the 10-item Big Five Inventory: An application to hedonic and utilitarian shopping values” Personality and Individual Differences, Vol. 76, pp. 135–140, April 2015.
[8] E. Bridges, R. Florsheim, “Hedonic and utilitarian shopping goals: The online experience” Journal of Business Research, vol. 61 (4), 2008, pp. 309–314.
[9] L.C. Wang, J. Baker, J.A. Wagner, K. Wakefield, “Can a retail web site be social?” Journal of Marketing, vol. 71 (3) 2007, pp. 143–157. [10] C. Campbell, “Shopaholics, spendaholics, and the question of gender” I
Shop, therefore I Am: Compulsive Buying and the Search for Self, 2000, pp. 57–75.
[11] H. Dittmar, K. Long, R. Meek, “Buying on the internet: Gender differences in on-line and conventional buying motivations” Sex Roles, vol. 50 (5–6), 2004, pp. 423–444.
[12] H. Fan, M.S. Poole, “What is personalization? Perspectives on the design and implementation of personalization in information systems” Journal of Organizational Computing and Electronic Commerce, vol. 16 (3–4), 2006, pp. 179–202
[13] E. Bridges, R. Florsheim, “Hedonic and utilitarian shopping goals: The online experience” Journal of Business Research, vol. 61 (4), 2008, pp. 309–314.
[14] S. Menon, B. Kahn, “Cross-category effects of induced arousal and pleasure on the Internet shopping experience” J. Retail., vol. 78 (1), 2002, pp. 31–40.
[15] M. Wolfinbarger, M.C. Gilly, “Shopping online for freedom, control, and fun” Calif. Manag. Rev., vol. 43 (2), 2001, pp. 34–56.
[16] J.L. Miller, C.W. Craighead, K.R. Karwan, “Service recovery: A framework and empirical investigation” Journal of Operations Management, vol. 18 (4), 2000, pp. 387–400.
[17] Yong, Michael and Jie, “Aesthetics and the online shopping environment: Understanding consumer responses” Journal of Retailing, vol. 87 (1), pp. 46-58, March 2011.
[18] A. Mehrabian, J.A. Russell, An Approach to Environmental Psychology, The MIT Press, Cambridge, MA, 1974.
[19] F. Heider, The psychology of interpersonal relations Erlbaum, Hillsdale, NJ 1958.
! " ! # $
% & ! ' ( & " ( #
)**)+) , -* .' ' , ,' ' )/01/. ! 2 3 . .
!
"
!
#
! $%
!
! &
! '
! (% ) * + + !
! ,
-!
. ( 4 4(
5 2 '
$ 6 . & & '
& 2 .
7 5 . 4 &
5 5 2
& & . 7 '
55 & & & 5
&& 5 . 5 &
5 8 . 4
& 2 2
5 $ 9) :; 5 5 '
8 . < 2 ' 2 55
& 2 5
5 = ' % & 8 6 ( 91;'
8 5 9>;' 4 , ?
@ 2 9*;' < 6 5 9A;. < 2 '
' 2 &
' ' .
. &
'
& & 2 . % ' & '
5 ' 2 & ' <
& ( 7
& @ (. 5 '
. ' 5
5 5 &
& . & '
B 6 5 5 5
5 2 . ' &
2
7 ' & 5 &
$ 5 . % '
5 5
. 2 5 && 7 .
5 & '
5 5 . $ ' C &
' 2
5 . < 2 ' !8
5 ' 2 & .
& & ' 55 5 7
5 && & &&
& 5 . 5 5
& 5
5 2 5 &&
& '
55 .
. ! ! 4$ 4(
5 5 5 & ' &
' , & &&
& 5 2 55 & 0: 5
. && 2
5 2 & & @ 5
. 5 55
5 . 5 2
D . & 2 >: $ 8 4 . 4
& 2 5 2 ' ! 5 ' < . % . )
2 ! & .
& % . ) & '
. . & & ' 5 5 "@ #' 5 5
' 5 ' 5 .
55 2 & .
55 & 5
2 ' &
55 5 .
% . ). ! & .
. ! ! ! B( ( 4 ! 4(
C . % . 0
2 & " # 5 2 5 &&
& % . -. 4 5 5 2
& 5 5 . & '
2 5 5 . % ' 5 '
5 5 ' 5 ' ' 2 & ' 5
' & ' & . '
55 C '
&& & & . &
' % . : 2 5 5 . % .
1' 2 & 2 ' '
2 . 5 && 5
&& & 5 5 . & 5
' 5 2 5 2
% . >. !8 5 & 5 2 &
5 5 ' ' & ' '
5 . 6 ' 5 & 5 2
2 . & 2 2
& 5 &&
, & . < 2 ' & 2
5 5 . 8 2 2
&
5 , &
2 .
% . 0. 2 5 & (@ .
% . -. $ % .
% . :. 2 & 7 55
C .
% . >. !8 5 & 5 .
% . *. & 2 & 5 .
@. ( ( 4 ! ! B( ( 4 ! 4(
45 "4 # 5
' 2 ' 4 5
5 . 5 4 '
5 2 & 5 '
5 & 55 = 5
& 2 5 5 5
5 . & 4
6 , ' ! & ( & ' !
& 55 B 55 6 , '
5 ' & 46' B
6 .
% . A. $ & 55 .
% . E. 5 & .
2 , & C 45
& 55 & 2 &
. % . *.
2 & 2 & 5 .
& 2 % . A.'
, 2 . 4 ' &
' 5 ' & '
5 ' 2 & ' 5 5
. & &
2 % . E. % . )/. 2 8 5 & 5
, . 2 '
& .
@. 46 4( 4%!D ( (B ( 4 4 ! (! F !6
$! . 46 4( 4% !D (B ( 4 4 ! F !6
.
% 5
&&
%
&
C & @
% !8
%
55
5 5
& 7
2
2 55
2 & %
55 & %
( 2 (
$ F
( ' 7
5
-( 2 $
$
( ' && 2
&& 5
F
& ) 5 5
2 2 55 &&
& 8 &
&
2 55 . < 2 '
( $ 7 5
-5 .
/ 00 5 8 5 5
/ 0$ 5 & 5 5 5
/ 01 & & & .
@ . % 4( !!@ $ 4(
& & 5 5
& &
.
2 & & )
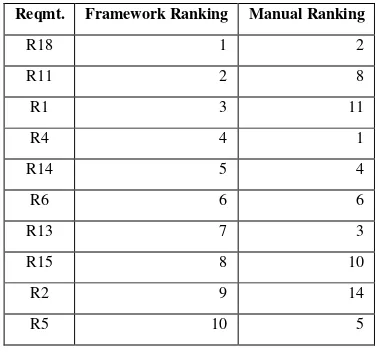
& 01 5 && 2 , .
& 2 5 &&
)//G & .
5 ' % .)) 2 5
8 5 5 2 A/G
. % .)0 2 5 &
5 5 5 . % .)- &
& & .
& 5 & )0G
.
@ . 4( $ 4(
% 8 5 5 ' 2
&& . & ' &
. 5 5 ' &
.
2 .
5
. 5 &&
2 5 5
8 5 5 .
!%! !( !
9); !. H B. B ' I 5 6 'I
& ' 0//*.
90; . 6 ' J. D. J & ' . < ' I!8 &
. B
' 5 @ ' 0//0.
9-; < , ' J.' 5 ' .' ' <.' K ( 2 ,
6 6 L
' 55. 0: 0>'0/)0
9:; < , ' J.' 5 ' .' ' <.' ,
6 ' .' K 5 % 2 , & 6
6 L'
" J #'. ) )-'0/)0
91; 5 ' 94 ; 222. 5 .
9>; 5 $ ' 94 ; 222. 5 $ .
9*; 6 ' 94 ; 222. 6 55 .
9A; 6 55 94 ;
IT Management for SCM and Logistics in
Agricultural Product Industry
Thongchai Surinwarangkoon
Department of Business Computer, Faculty of Management Science Suan Sunandha Rajabhat University
Bangkok, Thailand thongchai.su@ssru.ac.th
Abstract—The objective of this research were to study on Information Technology (IT) use for Supply Chain Management (SCM) and logistics in agricultural product industry and find IT guidelines for development of sustainable SCM and logistics in agricultural product industry. This research is a qualitative research. The research samples compose of two groups. The first group was 400 samples who were entrepreneurs, famers, processing plants, wholesalers and exporters in logistics and supply chain commodity in Nakorn Pathom province. The samples were selected using simple random sampling. The research tool for data collection for this group was questionnaire. The second group was corporate executives and technician representatives, total 5 samples, who were corporate executives and computer staff in agricultural product industries. The samples were selected by purposive sampling. The tool for data collection for this group was in-depth interview. Then research data was analyzed by descriptive analysis. The research result found out problems in IT use for SCM and logistics in agricultural product industry in terms of security of information system, competency of computer network, technology of computer hardware and software, and lack of expertise staff in IT. Guidelines to develop sustainable IT use for SCM and logistics in agricultural product industry are to focus on four aspects. 1) Corporate IT infrastructure has to be renovated up-to-date. The corporate management must support adequate resources and investment in improvement of IT infrastructure and computer network effectively. 2) Relevant information in SCM and logistics must be integrated. Provided information system must support processes of information creating, storing, sharing, and use of information about raw materials, productions, sales and logistics between business partners via communication channels effectively. 3) Employee skill and knowledge in the use of information technology for SCM and logistics must be developed. 4) Adequate security for SCM and logistics information system must be established.
Keywords—IT management, SCM and logistics; agricultural product industry
I. INTRODUCTION
Thailand was ranked 12th exporter of food and agricultural products in the world. Agricultural sector has a key role in generating income and creating food support. Food price in the country is low and it keeps economic balance because Thailand has comparative advantage in the production of certain products. Thai farmers hold higher producing than neighbor countries while the agricultural market is highly competitive.
Thailand is the world’s leader of food exporter. Thailand’s largest export products are rice, cassava, rubber and canned tuna, followed by sugar, pineapple, chicken, fresh vegetables, durian, seeds, and corn. Although pig export has some problems, but Thailand’s farms have efficient performance comparing to developed countries. However, some products of Thailand such as milk, beef, palm oil, and soy are lack of competitive advantages.
Nowadays, the main problems of Thailand’s agriculture are the rapidly degradation of natural resources due to the use of chemical in agriculture and urban growth, water shortage, young labor shortage, impact of epidemics such as bird flu, effects of liberalization of agricultural trade, fluctuations in crop prices, and global climate change. Moreover, Thai government supports a lot of budget to support agricultural prices.
In future, Thailand still faced with numerous problems and challenges such as labor shortages, water shortages interspersed with flooding, degradation of natural resources and external challenges such as climate change, global market demand for safety food, etc. These factors will affect its ability to compete, poverty of small farmers, disparity of income in the country, food supply for poor farmers in some areas, including food supply for the world’s citizens [1].
However, modern agriculture and modern SCM is still in the relatively limited scope of the middle class in urban markets and export markets. The most of farmers in the traditional market still faced with the volatility of output and prices, and low income.
In globalization, businesses are competing more fiercely. The effect of global economic conditions, natural disasters, terrorism, and political conditions affect business operation around the world.
A. Research Objectives
This research aims to study IT use for supply chain management and logistics in agricultural product industry, and find IT guidelines for development of sustainable SCM and logistics in agricultural product industry appropriately for the benefit of the businesses.
B. Research Scope
This research relies on a form of qualitative research which focused on the development of IT for SCM and logistics in agricultural product industry in Nakorn Pathom province, a source of vegetable crops in agriculture due to lots of abundant soil and water resources throughout the year, in order to find the possibility of the development of IT for SCM and logistics.
II. LITERATURE REVIEW
The original concept of logistics is the process to obtain goods, storage goods in warehouses, and distribute right product to consumers at the right time and correct location with the correct conditions, quantity, and cost [4].
The modern logistics emphasizes on three types of activities: handling and shipping for both of finished goods and services, information exchange, and money transfer and payment as shown in Fig. 1.
The concept of modern logistics not only focus on the movement of goods at the right time and the right places, but it also emphasizes on time reducing management and effort wasted activities, getting rid of thing that does not add value.
Resources are used cost-effectively and can meet the needs of their clients. It also known as lean logistics and lean manufacturing which focuses on the flow of goods, services and information instead of focusing on inventory or stock.
In modern management, SCM has a broader meaning than the meaning of logistics. Logistics is one of the five key elements of SCM: business alliances, IT, lean logistics, lean manufacturing, and business process integration [2].
SCM activities are manufacturing products with high added value and quality to meet the needs of customers. Product or service is delivered to customer with the lowest cost and trusted service.
The added competitive advantage in logistics strategy in palm oil industry was studied. They found that IT was used to assist their work in various departments, especially for communication. These factors resulted in the immediate, flexible and quick work operation. These made palm oil industry be capable of rising business competition, cost reduction, and fast response [3]. Logistics management system for cassava plant with RFID was studied and found that many cassava factories in Thailand were lack of effective logistics management within the plants. These made process of purchasing raw materials from famers to the plant late which had direct impact to other related processes such as warehouse management, product distribution, which also affected higher costs of overall national logistics management. The research developed a logistics management system within a cassava plant by using RFID technology to handle cars and trucks in the queue for weighting and traced the vehicles by web service technology in order to link internal logistics management system with the company’s existing Enterprise Resource Planning (ERP) system [5].
E-commerce was used in communications within the enterprise and between commercial organizations [6]. Moreover, intranet was used in communications within the enterprise which can support collaborative work rapidly. Organizations can reduce the amount of internal resources significantly and corporate costs were down [7, 8, 9].
The concept of SCM and logistics consists of links between those concerned by the information, production management and logistics, and integration of business processes with maximum efficiency.
III. RESEARCH METHODOLOGY
Two research sample groups were studied. The first sample group was entrepreneurs who were engaged in SCM and logistics of agricultural products in Nakorn Pathom; farmers, wholesalers, entrepreneurs, operators of processing plants and exporters, the samples were selected using simple random sampling based on a sample size of Taro Yamane at the confidence level 95 percentages. The questionnaire collected data from a sample of 400 samples.
The second sample group was corporate executives or computer staff in agricultural industrial in Nakorn Pathom about the development of IT for SCM and logistics of agricultural products industry in Nakhon Pathom. The samples were selected using purposive sampling. Data was collected from 5 samples in this group.
This research was a qualitative research using in-depth interview with individual samples. Structured questions were prepared in order to obtain information on depth. Questionnaire was also used to collect relevant data.
Primary data were collected from two sectors: (1) in-depth interview with corporate executives and computer staff in agriculture and logistics businesses in Nakhon Pathom, totally 5 persons, and 2) questionnaire to entrepreneurs in SCM and logistics of agricultural products in Nakorn Pathom. The target group included farmers, wholesalers, entrepreneurs, processed workers and exporters, totally 400 persons.
The secondary data were theoretical concepts, related research, and related information. These data were used as references, as well as framework for the study.
The data was analyzed from questionnaires and interviews. Data from questionnaires were analyzed using descriptive analysis method in terms of percentage, average and frequency. Moreover, data from in-depth interview was analyzed by data reasoning and relation, and presented in analytical description complying with the research objectives according to the theory, related research as a framework for analysis.
IV. RESEARCH RESULTS
The most of samples were males aged 25-34 years old, and graduated bachelor degree. Majority were entrepreneurs and company employees, earn between 10,000-20,000 Baht per month. Majority worked in retail business enterprise, production or service and wholesale business, respectively.
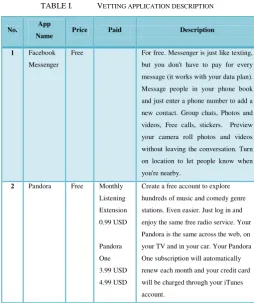
The research results of the study on the channels of IT for SCM and logistics of business found that the most of samples used phones, e-mail, intranet and corporate website for their business management as shown in Table I.
TABLE I. CHANNELS OF IT USE FOR SCM AND LOGISTICS IN AGRICULTURAL PRODUCT INDUSTRY
IT Channels Users (Persons) Percentages
Phone 313 78.25
E-mail 197 49.25
Intranet 173 43.25
Corporate websites 164 41.00
Table II shows objectives for IT use in SCM and logistics which consisted of ordering, sales, payment, internal coordination, and planning, respectively.
They found problems of IT using which was at moderate level. Main problems of IT use for SCM and Logistics were in terms of use cost, reliable of information, data accuracy, timeliness, flexibility, complying with the requirements, completeness of data, and security of information systems as shown in Table III. However, their satisfactions for IT using for SCM and logistics of the business was at high level because of modernization and ease of use factors.
TABLE II. OBJECTIVES OF IT USE FOR SCM AND LOGISTICS IN AGRICALTURAL PRODUCT INDUSTRY
Objectives Users (Persons) Percentages
Ordering 264 66.00
Sales 185 46.25
Payment 185 46.25
Internal coordination 132 33.00
Planning 116 29.00
Report data access 86 21.50
External coordination 84 21.00
Nowadays, agricultural product industries use IT in businesses in three major operational segments: (1) material procurement, (2) production, finance sales, and human resource management, and (3) shipping. These organizations use IT in terms of logistics in 6 sub-systems: planning and scheduling system, strategic supply system for supply chain, warehouse management, warehouse prediction, planning and production control, and transportation planning and distribution.
TABLE III. PROBLEMS OF IT USE FOR SCM AND LOGISTICS IN AGRICULTURAL PRODUCT INDUSTRY
Problems Average Standard deviation
Use cost 2.98 0.66
Reliable of information 2.83 0.64
Accuracy 2.80 0.66
Timeliness 2.80 0.64
Flexibility 2.80 0.65
Complying with
requirements 2.78 0.64
Completeness 2.78 0.64
In future, these organizations should use RFID instead of barcode systems because RFID can store more details of information. In addition, they should be encouraged sales and marketing through their websites and social network. However, IT supporting system should be easy to use, can work fast, accurate and secure.
V. CONCLUSION AND DISSUSSION
Results of the study will be discussed guideline for IT use for SCM and logistic in agricultural product industry in the following aspects:
The improvement of IT infrastructure and powerful computer network; they should use up-to-date technology which can support large amounts of data, especially for communication system via mobile phones application. This allows users to access information quickly and easily, and keep up with the demand, anywhere and anytime.
The integration of data creation, storage, sharing and use of raw materials, production, sales and logistics between business partners; each organization should provide useful information to share effectively by using modern technology such as data warehouse, data mining, ERP, Global Positioning System (GPS), Online Analytical Processing (OLAP), and groupware. The development of human resources in terms of IT knowledge and computer skills for SCM and logistics in order to accommodate the growth in trade liberalization in future; the organizations should encourage training for their staffs to develop skills in the areas of information systems, SCM and logistics. So that employees can use the system to their advantage fluently.
The development of adequate system security in order to protect the system; the organizations should maintain adequate security, so that the system can be used accurately and information does not leak out. This will help the organizations have advantage and competitiveness in sustainable business.
Researcher’s suggestions from this study were as follows:
The further study of IT use for SCM and logistics in agricultural product industry in Nakorn Pathom province should be compared to areas on other provinces of Thailand that there is any difference or not The further study of IT use for SCM and logistics in agricultural product industry should be compared to other industry groups.
ACKNOWLEDGMENT
Thongchai Surinwarangkoon thanks colleagues at the Institute for Research and Development, Suan Sunandha Rajabhat University for their kind support. Financial assistance for this research was provided by a scholarship from Suan Sunandha Rajabhat University, Bangkok, Thailand.
REFERENCES
[1] Thailand Development Research Institute. Guideline for Supply Chain Management and Logistics for Agricultural Products 2010. [2] J. Parik Pratik and D. Meller Russell, “Estimating Picker Blocking in
Wide-Aisle Order Picking Systems,” IIIE Transactions on Design & Manufacturing, vol. 3, 2009, pp. 232-246.
[3] C. Kerdphithak, et al., “The increment of competitive advantage in logistics strategy in the palm oil industry,” Proc. 9th Conference of Logistics and Supply Chain Management, 2009.
[4] K. Backer, “Heuristic procedures for scheduling job families with setups and due dates” in Naval Research Logistic, vol. 8, 1999, pp. 978-991. [5] A. Jesadapornphan and S. Arj-in, “ Logistics Management in Cassava
Plant by Using RFID: A Case Study of Wongsa-nguan Industrial Co., Ltd.,” Proc. 9th Conference of Logistics and Supply Chain Management , 2009.
[6] G. Shu, R. Tian-zhi, and Mao-hua, “Technology and Infrastructure Considerations for E-commerce in Chinese Agriculture,” Agriculture in China, vol. 1, 2007, pp. 1-10.
[7] A. S. Carr and L.R. Smellizer, “The Relationship between Information Technology Use and Buyer-Supplier Relationships: An Exploratory Analysis of the Buying Firm’s Perspective,” IEEE Transaction on Engineering Management, vol. 3, 2002, pp. 293-304.
[8] H.L. Lee, “The Triple-A Supply Chain,” Harvard Business Review, vol. 10, 2004, pp. 102-112.
A Model Development of Incremental Innovation
Affecting on Organization Performance in Thailand
Furniture Industry
Kitipong Tangkit
1and Vinai Panjakajornsak
2 Administration and Management CollegeKing Mongut’s Institute of Technology Ladkrabang
Bangkok, Thailand
Email :ktangkit@yahoo.com1, vinaidba6@gmail.com2
Abstract—The creative ideas, value-added skill increasing and industrial value are the essential factor to grow the Thailand furniture industry. Innovative capability of the firms in this industry is compulsory. This research aims to develop a structural model of incremental innovation and the relevant factors of market orientation, organizational learning, entrepreneurial orientation that affects organization performance in the furniture industry firms. The selective population in this study is the key man executives and the top marketing managers among 4,118 firms in this furniture industry. The research methodology, both in-depth interviews and questionnaires 7-point Likert scale were used in this study. The value of this research will be a structural model of innovation that can be applied to improve organization performance of firms in the furniture industry.
Keywords—Innovation; Incremental Innovation; Market Orientation; Organization Learning; Entrepreneurial Orientation; Organization Performance; Structural Equation Modelling.
I. INTRODUCTION
Furniture industries with appropriate technology can be successfully developed by the innovation we consider to be the root for the firm improvement if that firm realize that innovation originate the great extent of advancement in organization and lead to the superior organization’s
performance [31]. Literally, innovation can response to the newness with economically advantages and can be the usage of the new creative knowledge for completely advancement of the organization performance [18].
Therefore, the innovation is the competition tool for the current and future industries as its own commercial value and sustainable business capacity [27]. Moreover the innovation creates the competitive advantages, market opportunity as well as the business success [13] which result in the economic growth through the entrepreneur. [36] However, the innovation can be driven via the ability, vision, enthusiasm and decision-making courage of entrepreneur. [2] While it is
found that the management concept and the strategy in the past, present and future have entirely era-transition by the innovation engagement, [4] the innovation in furniture industries have been long reviewed for competitive ability plan which lead to the better capacity. As such this is the
complex appearance related to the firm’s cap