Off-Grid Fully Renewable Energy with Free Capacity
Shortage for Remote Electrification
Y. Tanoto
1, M. Santoso
2, C. Massay
3 1, 2, 3Electrical Engineering Department, Petra Christian University Jl. Siwalankerto 121-131 Surabaya, 60236 Indonesia
1
E-mail: [email protected]
Abstract- This paper presents feasibility study on optimal sizing and economic assessment of community electrification in the remote area using fully renewable energy system. The electricity is proposed to be delivered from a centralized renewable energy generating station. Study is focused to obtain the most appropriate power generation configuration with the lowest energy cost along with free system’s capacity shortage over the study period. Possible renewable energy technologies analyzed in this study consists of micro hydro, photovoltaic-battery and wind turbine. From the analyses, system configuration that consists of all renewable resources is the most preferred one with least net present cost as well as least cost of energy during the project period.
Keywords: Renewable energy, cost of energy, optimum sizing
I. INTRODUCTION
Potential of renewable energy resources as promising alternative power generation has been widely studied. System reliability is one of important issue, particularly if the load has to be uninterruptedly supplied. Hence, diesel generating set is considered to be involved in as what we call base load dispatcher, compromising the environmental effect of emitted CO2 [1]. However, problem comes when applying diesel
generating set for remote area is somehow not feasible due to continuity of diesel oil supply and transportation distance that affecting fuel price. In Indonesia, several remote areas have utilized diesel generating set to meet their electricity needs. However, because of high price of diesel oil plus the cost of transportation to the site, the plan could not operate continuously resulting in high system’s capacity shortage. In addition, some remote village could possibly have no access to diesel fuel eminently in terms of economic accessibility.
Therefore, this paper is focused on the development of fully renewable energy system to electrify typical households’ community in the remote area in keeping system reliability in terms of technically free capacity shortage. Similar study has been made for solar-wind hybrid system that allows improving the system efficiency and power reliability for stand-alone applications [2]. In this study, all locally available renewable energy resources which are possible to be implemented in affordable, simple and reliable technology are included.. The paper is organized as follows: methodology is presented in the next section followed by result and discussion in terms of proposed system configuration performance. The paper conclusion shall be provided finally.
II. METHODOLOGY
A. Load Profile
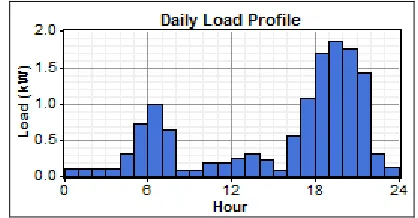
In this study, a mini survey has been conducted to collect sample of daily power consumption over 23 households bounding as one community in a village area of Mamasa District, West Sulawesi Province, Indonesia. The selected area is geographically located at 12˚5’ South Latitude and 2˚4’ East Longitude. The village is 1,025 m above sea level. Being a highland, the village is mostly forest area with somewhat grass terrain and rice fields. In aggregate, typical daily load profile for households surveyed would consume 13 kWh electricity with 3.3 kW peak demand. Fig. 1 shows one of the households’ communities in the village.
Fig. 1. Typical aggregate daily load profile for community households in a surveyed remote area of Mamasa, Indonesia
Fig. 2. Typical aggregate daily load profile for community households in surveyed remote area of Mamasa, Indonesia
From Fig. 2, we can see that the electricity demand is high during night time especially from 6 PM to 9 PM when various home appliances are on. Provided the household electricity consumption is around 13 kWh per day, the monthly consumption will be around 390 kWh, in which, for simplicity of analysis, the holiday effect is not taken into account.
B. Renewable Energy Resources
Utilization of solar radiation and wind energy are considered in this study since both two types of energy are, in principle, available for selected study area within sufficient amount and both are the most affordable in terms of technology implementation. As hourly data for solar radiation measurement as well as wind speed are not available, both data are taken from NASA through NASA Surface meteorology and solar energy database [3] with respect to the selected geographical location. Solar radiation are accounted as monthly averaged insolation incident on a horizontal surface (kWh/m2/day) whereas wind speed is taken as monthly averaged wind speed at 10 m above the surface of the earth (m/s). The solar radiation and wind speed data are given in Table 1.
TABLE I
MONTHLY AVERAGED SOLAR RADIATION, CLEARNESS INDEX, AND MONTHLY AVERAGED WIND SPEED
Month Monthly Averaged Solar Radiation
As seen in Table 1, the annual average for solar radiation is 5.169 (kWh/m2/day) whereas annual average for wind speed is 4.9 (m/s). The wind potential is considerably low for the selected area which may not give efficient operational toward the whole system. Hourly variation of annual wind speed at the selected location is shown in Fig. 3.
Jan Feb Mar Apr May Jun Jul Aug Sep Oct Nov Dec 0
Fig. 3. Hourly variation of annual wind speed in surveyed remote area of Mamasa, Indonesia
Besides, the village has some rivers which are potential to contribute sufficient hydro power through the application of
micro hydro technology. Based on the field survey and quick measurement, a river with 9 m width and 1.5 m depth as shown in Fig. 4 is selected as one of potential resources in this study. Its annual averaged stream flow rate is 16.6 m3/s and head of 4 m. According to the local people, the stream in that river is maintaining flown throughout the years since it is originated from the spring water up in the higher terrain.
Fig. 3. Selected river in surveyed remote area of Mamasa, Indonesia
C. Renewable Energy System Modeling
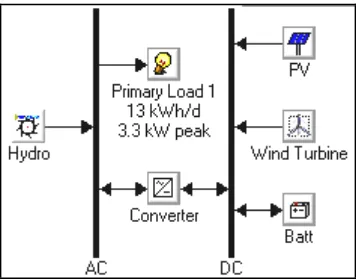
A proposed stand-alone centralized fully renewable energy power station is built up using the combination of existing renewable energy resources in which locally available. The system is then analyzed to supply a community households having a 13 kWh/day electricity consumption with 3.3 kW peak power demand. The “option one” system is consists of micro hydro, photovoltaic, wind turbine, and battery storage. Fig. 4 depicts the first option system.
Fig. 4. “Option 1” system proposed for stand-alone fully renewable energy
Besides, three other options considered in this study are: micro hydro/battery/wind turbine, namely “Option 2”; micro hydro/battery, namely “Option 3”; photovoltaic-battery/wind turbine, namely “Option 4”. In this study, system modeling and analyses in terms of system’s optimum sizing and economic parameter are conducted using Hybrid Optimization Model for Electric Renewable (HOMER), developed by the United States national Renewable Energy Laboratory (NREL) [4]. Among four options, system’s sizing optimization is evaluated in terms of technical feasibility and life-cycle cost of the system. The software performs
calculation to obtain the size of the search space that is the set of all systems over which HOMER searches [5]. The search space is defined by specifying the sizes and quantities of the different system components in the Sizes to consider tables in the search space window. In this study, the search space includes 36,000 distinct system configurations and the possible values of the decision variables comprise of 36,000 different combinations as 3 x 20 x 6 x 20 x 5; 3 sizes of micro hydro, multiplied by 20 sizes photovoltaic array, multiplied by 6 wind turbine quantities, multiplied by 20 battery quantities, multiplied by 5 sizes of converter. In the optimization process, every system configuration in the search space is simulated and the feasible ones are displayed in a table, sorted by net present cost.
The evaluation of the system in terms of economics is achieved by optimizing the total net present cost. It is used as to represent the life-cycle cost of the system. In this sense, the life-cycle cost of the proposed system includes the initial cost of construction, component replacement, operation and maintenance cost as well as any salvage value that occurs at the end of the project lifetime.
D. Components’ Technical and Economic Specification
The current cost of photovoltaic panel is taken US$ 2.29/Wp [6]. Thus, a cost of US$ 300 is used as the initial cost for a 135 Wp photovoltaic panel. The replacement cost is taken as the same price, and the maintenance cost is considered practically zero. The life time of the panel is taken 25 years. A de-rated factor of 80% is applied; meaning the electricity produce from the panels is reduced by 20% to approximate the varying temperature effect and dirt. No tracking system applied to the panel and it is tilted 12 degree relative to the horizontal in accordance to the site latitude.
The wind turbine used in this study is SW Whisper 200. It has a rotor diameter of 2.7 m, rated power 1 kW at 11.6 m/s and working at nominal voltage of 12/24/48 V DC [7]. Its nominal capacity per month is 158 kWh at 5.4 m/s with the starting speed of 3.1 m/s. The initial cost is taken at US$ 3,500 and the replacement cost is taken at US$ 2,500, with annual operation and maintenance cost is neglected. The hub and anemometer of this wind turbine is located at a height of 15.2 m as the location is located 1,025 m above the sea level, and it is estimated to serve for 15 years.
Fig. 5. Power curve with respect to wind speed variation for a 1 kW 12 V DC Wind turbine
A Low-Head Propeller Turbine is considered in the analysis for micro hydro implementation; as such turbine is suitable with available head. Initial and replacement cost for the selected turbine is taken US$ 2,975 and US$ 2,380, respectively. Annual operational and maintenance cost is considered US$ 15 or around 2% of the initial cost. With available head of 4 m only, the nominal power is achieved for 0.521 kW. The efficiency of this AC type micro hydro turbine is taken 80% with minimum flow ratio setting of 30% and expected lifetime of 25 years.
The battery is rated at a nominal voltage of 12 V DC with nominal capacity of 200 Ah, 2.4 kWh. The battery state of charge is 40% and the lifetime throughput is 917 kWh. Initial cost is US$ 746 and the replacement cost is US$ 746 as well with considered practically zero maintenance cost. In addition, initial cost a 1 kW converter (Bi-directional inverter type) is taken US$ 700 in accordance to the current retail price of US$ 0.7 per continuous Watt with replacement cost of US$ 700. The expected lifetime of the converter is 15 years in which the efficiency of the inverter is 90% and the rectifier 85%.
All prices used in the analyses are assumed to escalate at the same rate over theproject lifetime. System fixed capital cost is taken US$ 2,500 with fixed operational and maintenance cost of US$ 50. The real annual interest rate is considered 6% for the case of Indonesia and project lifetime is taken 25 years.
III. RESULTS AND DISCUSSION
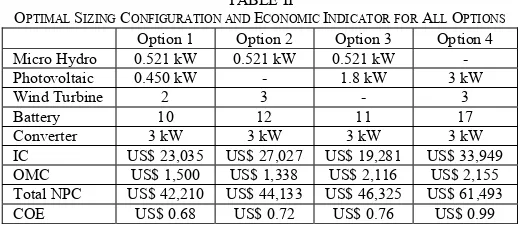
HOMER simulates the system operation by performing energy balance calculations for each hour over a year. HOMER compares the electricity demand in that particular hour to the energy that the generation system can supply, and calculates the flows of energy of the system. The economic parameters such as initial cost (IC), operating and maintenance cost (OMC), total net present cost (Total NPC), and cost of energy (COE) are calculated for each alternative system. Optimal sizing configuration and economic indicators of components for each option is presented in Table 2.
TABLE II
Based on Table 2, the hybrid system consist of all technologies is found to be the best option, provided the least total net present cost and the least cost of energy. In terms of sizing, therefore, the optimum configuration comprises 521 kW micro hydro, 0.450 kW photovoltaic panel, two SW Whisper 200 wind turbines having 1 kW 12 V DC specification, a converter rated at 3 kW, and ten battery 12 V
DC 200 Ah, 2.4 kWh. In this study, the economic indicators as presented in Table 2 is calculated based on predetermined economic and initial system fixed cost as mentioned earlier in Section 2.D. table 3 shows proportion of the electricity produced for each option.
TABLE III
PROPORTIONOF ANNUAL ELECTRICITY PRODUCED* FOR ALL OPTIONS Option 1 Option 2 Option 3 Option 4
Micro Hydro 4,008 4,008 4,008 -
Photovoltaic 736 - 2,946 4,909
Wind Turbine 4,248 6,372 - 6,372
Total
Production 8,993 10,380 6,954 11,281
Load Served 4,814 4,813 4,815 4,814
Excess
Electricity 3,378 4,830 1,072 5,311
*in kWh/year
From Table 3, we can see that under free capacity shortage, i.e. system is capable of producing electricity required by the load; the annual load served is accounted for 4,814 kWh. All options are capable of doing this, and for the option having micro hydro on it, it can be seen that the micro hydro is to serve the demand as base dispatcher with 4,008 kWh produced. Other technologies are controlled to produce the energy based on their resource availability. Monthly average electricity production for all configuration options is graphically shown in Fig. 6 to Fig. 9.
Fig. 6. Monthly average electricity production for Option 1
Fig. 7. Monthly average electricity production for Option 2
Fig. 8. Monthly average electricity production for Option 3
Fig. 9. Monthly average electricity production for Option 4
It is clear that for the case of Option 1, the optimal sizing is achieved with the substantially larger portion of wind turbine compared to photovoltaic in producing electricity. The relative availability of wind during day and night is one of the reasons; hence photovoltaic output is served as complement. Similarly, the constant micro hydro output for all options except in Option 4 is caused by assumed continually stream flow.
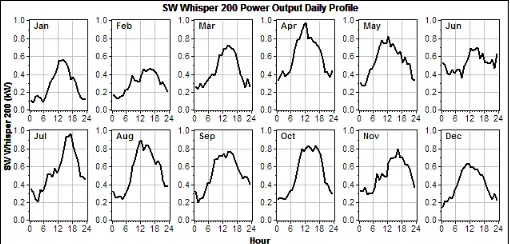
All options are observed to have excess electricity. It occurs when there is a surplus of power being produced (either by a renewable source or by the generator when its minimum output exceeds the load) and the batteries are unable to absorb it all. Excess electricity can be caused by the low load factor. The load factor for this study is calculated for 0.17 only. The large “valley” observed in the load profile is the cause of it, leading to the excess electricity. For the case of Option 1, we can see that although the daily wind turbine output are considerably high in the period of day time, low demand in that hours resulted excess electricity, as it can be carefully observed in Fig. 10 and Fig 11.
Fig. 10. Average daily power output of SW Whisper 200
The economic indicators such as total net present cost and cost of energy achieved in this study are closely influenced by the setting of economic values such as system fixed capital cost, annual real inflation rate, system fixed operation and maintenance cost, and project life time. In turn, the project cash flow also effected with the components’ lifetime as during the project cycle, the replacement cost could be occurred and hence affecting the net present cost. In this sense, accurate and careful setting in system economic value resulted in the realistic results in terms of technical and economic impact during the system life-cycle.
IV. CONCLUSION
In this study, optimal sizing and economic of fully renewable energy based off-grid generation system is analyzed. The aim of the study is to find the most appropriate system to electrify a community consists of 23 households in remote area of West Sulawesi province, Indonesia. From the analyses, it is found that system configuration consists of all considered technologies is the preferred one in accordance to its comparative benefit in terms of cost of energy and total net present cost over other options, among other.
The system reliability remains unaffected although the proposed system is not equipped with diesel generator, as micro hydro can handle this issue up to certain extend, and remain unaffected in the case of the absence of micro hydro. Another important benefit is that the proposed system said environmentally friendly since no CO2 emitted from it. The
issue of excess electricity is also highlighted in the discussion section. Further investigation to resolve this problem is one of the concerns in the next research.
ACKNOWLEDGMENT
The authors would like to thank all parties involved in this study, especially to all local people of Kopian village, Mamasa district during field survey and data gathering. The authors are grateful for the continuation support and funding provided by Petra Christian University to disseminate this article.
REFERENCES
[1] K. Karakoulidis, K. Mavridis, D.V. Bandekas, P. Adoniadis, C. Potolias, N. Vordos, “Techno-economic analysis of a stand-alone hybrid photovoltaic-diesel-battery-fuel cell power system,” Renewable Energy, 36, 2011, pp.2238-2244.
[2] K. Sood, P. Singh, P. Baredar, “Optimization of Sustainable Solar-Wind Hybrid System for Domestic Electrification,” International Journal of Mechanical and Production Engineering Research and Development, 2, 2012, pp. 31-41.
[3] NASA Surface meteorology and Solar Energy.2013. NASA Surface meteorology and Solar Energy: HOMER Data. 12 February 2013. Available: http://eosweb.larc.nasa.gov/cgi-bin/sse/homer.cgi?
[4] T. Lambert, PG. Gilman, P. Lilienthal (2006). Micropower System Modeling with HOMER. [Online]. Available:
http://www.pspb.org/e21/media/HOMERModelingInformation.pdf [5] A.M.A. Haidar, P.N. John, M. Shawal, “Optimal Configuration
Assessment of Renewable Energy in Malaysia,” Renewable Energy 36, 2010, pp. 881-888.
[6] Solarbuzz, retail price summary-March 2013 [Online].Available:
http://www.solarbuzz.com/facts-and-figures/retail-price-environment/module-prices
[7] SW Whisper 200 Wind turbine specification. 15 February 2013. Available:
http://www.energymatters.com.au/images/Southwest%20Windpower/W hisper_100_200_Spec_Sheet.pdf