IRSA Book Series
on
Regionol DevelopmentNo'
13Regional
Develgpment in
lndgnesia:
Some Notes
for the
Jokowi
Government
Editors:
Hamid
Paddu
D.S. PriYarsono
Arief
AnshorY Yusuf
Dloni Hartono
Budy
P
Resosudarmo
lndonesian Regional
Science Association
Jfi
'tri\
{r%
Icgional
Development
in
Indonesia:
-
Notes
for
the
|okowi
Government
Editor:
Hamid Paddu
D.S. PriYarsono
Arief AnshorY Yusuf
Djoni Hartono
Budy P. Resosudarmo
6 DISTRIBUTIVE POLITICS BEHIND THE
VEIL OF INDIGENCE:
A STUDY OF TARGETED
COMMUNITY-BASED
DEVELOPMENT PROGRAMMES
IN INDONESIA
1Inggrid
INTRODUCTION
A salient issue in any democratic country is whether public policy making and its outcomes will maximise the social welfare function. Yet, if the premises of the Downsian continue to hold, it is predicted that the policy outcomes will just closely reflect the median voter’s preferred policy. This work implies that, under a democracy, policy makers formulate policies which may contribute to electoral votes (Downs 1957).
If the literature has shown that economic outcomes are not independent from politics and this is especially true in democratic political systems, the next natural question is: how do government authorities distribute targetable economic benefits in order to increase the probability of winning votes? A continuing debate on this question
1
I would like to thank Kevin Evans for kindly sharing the political data and Pierre van der Eng and seminar participants at the 12th Indonesian Regional
Science Association (IRSA) for helpful comments. Any remaining errors are my own. An earlier version of this paper was circulated under the title: “Poverty or Politics: A Study of Targeted Community-Based Development Programmes in Indonesia”.
133
has leaned toward two competing models of electoral targeting. The first is the probabilistic voting model (Lindbeck and Weibull 1993;Dixit and Londregan1996) in which incumbent governments attempt to win political support by disproportionately channelling economic benefits to swing voters (i.e., voters that are ideologically indifferent between the candidates in the race) because their support is decisive for the final outcomes. Some empirical evidence underpins this hypothesis (Johansson 2003; Stokes 2005; Solé-Ollé and Sorribas 2008). The other variant suggests that risk-averse politicians should target their own supporters since they are less risky than other voters (Cox and McCubbins1986). This is true as long as political actors have intensive contacts with them, and thus are able to accurately predict their strategic reactions. Several observational studies seem lend support to this hypothesis (see for example, Levitt and Snyder 1995; Ansolabehere and Snyder 2006; Larcinese et al.2006).
This paper is the first attempt to test the above-mentioned models of distributive politics in Indonesia. The study is specifically focused on the allocation of National program of Community Empowerment (Program Nasional Pemberdayaan Masyarakat/PNPM Mandiri) block grants across Indonesian districts. Although the Coordinating Ministry for People’s Welfare publishes explicit criteria for determining the size of each sub-district’s block grant, there is no a strict predefined formula for the
grant allocation.2 Importantly, President Susilo Bambang Yudhoyono
(SBY), the incumbent president, and his Democratic Party also included PNPM Mandiri as a political platform during the 2009 elections. Therefore, there is reasonably open space for the incumbent government to
2
While the PNPM Mandiri programmes become the second pillar of the government’s anti-poverty policy based on community development programmes, the first pillar of the initiative comprises a set of social assistance programmes directed at poor and near-poor households, such as Raskin, Jamkesmas, PKH, and unconditional cash transfers. In contrast to the less transparent methods of allocating PNPM Mandiri grants, the first category uses a Proxy Means Test (PMT) which is by far a more objective and rigour approach to select eligible beneficiaries of the programmes. The details of criteria used to distribute PNPM grants will be discussed in the third section of this paper.
134
strategically distribute the grant, taking into consideration their re-election prospects.
Studying the model of distributive politics in the context of Indonesia is considerably relevant for at least two important explanations. First, as a young democratic developing country, Indonesia is not entirely insusceptible to the political manipulation because the status quo still takes control of major political parties, corruption is widely spread leading to strong incentives for the incumbent government to shape the allocation of grants, and given a large number of poorly educated and inexperienced voters, the incumbent can easily obtain additional votes by transferring resources to them. Second, this country has been challenged to provide sufficient public goods and services to society. Hence, a small difference in grant allocations will lead to sizeable welfare disparities across regions.
The contribution of this paper is expected to be twofold. From the literature on distributive politics, the issue of executive powers (i.e., the role of president) is addressed in distributive policy making even though the work of Case in (2001) is particularly close to this paper in spirit. While she examines the effect of party competition on the distribution of social assistance block grants from the central government to rural communities in Albania, instead this paper tested whether there is enough evidence for the presidential pork barrel. According to the literature, the simplest argument why the incumbent president manipulates grant allocations is indeed to enhance his chance to win the next election. In some cases, the president may promote his legislative agenda by channelling money to specific legislators. Perhaps the last motivation for distributive politics by the president is partisan arguments wherein he feels responsible for having a favour to regions dominated by members of his party (McCarty 2000). Furthermore, the availability of disaggregated block grants data by their components helps explain the type of the grant that is more prone to the presidential pork barrel. This issue is imperative but receives less attention from previous studies.
This paper also enriches the discussion of decentralised development programmes in developing countries. From an academic
perspective, the literature on decentralisation suggests that the outcomes of a decentralised service delivery system are more equitable and efficient than a centralised system (Bardhan and Mookherjee 2000; 2005; 2006). Nevertheless, such gains of decentralisation can be distorted by any political influences.
The paper is organised into 7 sections. First, it reviews the previous relevant literature, followed by the second section which describes the political system in Indonesia which is relevant to the period of the study. The following section gives a brief overview of the PNPM Mandiri programme. The fourth section discusses the data and the empirical strategy. The fifth section presents the results, followed by the section presenting the concluding remarks.
THEORETICAL BACKGROUND
Distributive Politics
Golden and Min (2013) classify the theoretical understanding of distributive politics into two classes: models of democratic accountability and notions of government accountability. The former presumes that politicians are office motivated and thus try to hold office by targeting specific groups of voters. Empirical work concerned with this is studied under four different categories. The first strand literature aims to provide an answer for the core versus swing voter debate which is basically the main focus of this current paper. Few studies discuss the model of population favouritism in which a specific population group distinguished by race, ethnicity, partisanship, and etcetera receives disproportionate distributions of pork barrel spending from the government. Another related work known as the Political Business Cycle (PBC) is intended to reveal a positive association between the allocation of goods and services and the electoral cycle. The idea is that political actors increase the distribution of those materials in the period just before the election to boost their votes. The PBC literature also entails fiscal and monetary policies. The final branch analyzes the political returns to government distributions, that is, the possibility that politicians
obtain more votes as a result of diverting economic benefits to electorally critical regions or certain groups of voters.
The second category is the theory of democratic responsiveness. This thesis attempts to examine whether the existing distributions are welfare maximising and equitable. Political distortions by special interests (e.g., lobbies by local elites) seem to be present if the distributions fail to meet the welfare maximisation condition. To sum up, in contrast to the previous class of distributive politics, this framework does not assess the electoral returns to politicians but the gains to voters from particularistic benefits. The rest of this section is devoted to review the first model of democratic accountability: the swing and core hypothesis.
Model of Democratic Accountability: The Swing and Core
Hypothesis
The formal model for studying the core versus swing debateis introduced by Dixit andLondregan (1998), developing the work of Lindbeck and Weibull (1987) and Cox and McCubbins (1986). The model is constructed under the assumptions as follows. There are
two candidates, 𝐿𝐿 and 𝑅𝑅, compete within a region to maximise their
votes. Voters can distinguish the candidates according to their different ideological positions and their redistributive strategies. A continuum of voters is rational, meaning that they care for economic benefits and they differ from each other in their ideological
preferences𝑋𝑋 over the candidates. The electorate comprises 𝑖𝑖=
(1, 2, . . . ,𝑘𝑘)identifiable regions, and people within each region are heterogeneous with respect to a trade-off between their ideological
affinities vis-à-vis economic benefits. Those candidates have identical
capabilities to allocate benefits once in the office. It is assumed that
the utility of a member of region𝑖𝑖 from consuming 𝐶𝐶𝑖𝑖 or
𝑈𝑈𝑖𝑖(𝐶𝐶𝑖𝑖) follows an increasing and strictly concave function. Hence, a
voter from region 𝑖𝑖 will vote for Candidate 𝐿𝐿only if his additional
utility of consumption from the win of 𝐿𝐿is greater than his
ideological preference for𝑅𝑅, i.e. 𝑈𝑈𝑖𝑖(𝐶𝐶𝑖𝑖𝑖𝑖)− 𝑈𝑈𝑖𝑖(𝐶𝐶𝑖𝑖𝑖𝑖) >𝑋𝑋𝑖𝑖.
Given a certain amount of benefits, there is a cut point dividing
voters for either Candidate 𝐿𝐿 and Candidate 𝑅𝑅 in region 𝑖𝑖, that is
𝑋𝑋𝑖𝑖=𝑈𝑈𝑖𝑖(𝐶𝐶𝑖𝑖𝑖𝑖)− 𝑈𝑈𝑖𝑖(𝐶𝐶𝑖𝑖𝑖𝑖). The candidates attempt to shift this critical value
by using the particularistic benefits to increase their vote shares.
Dixit and Londregan (1996) underline that the cheapest voters for a certain group to buy are those who ideologically indifferent or a group
of people with 𝑋𝑋𝑖𝑖= 0. This implies that each candidate will target his
resources towarda region whose has a high density of voters
around𝑋𝑋𝑖𝑖= 0, representing the group of swing voters. Moreover, due
to the fact that poorer voters get higher utility from the incremental income wrapped up in the benefit, the model also suggests that these voters demand smaller benefits to shift their votes than non-poor voters.
Lindbeck and Weibull (1987), however, articulate that the objectives of candidates are not only to maximise the number of votes but also to maximise the probability of winning majority. Under this scenario, more resources should be allocated to pivotal regions since it would be less likely to win a majority of the vote without their contributions.
Unlike the previous models, Cox and McCubbins (1986) argue that swing voters are a group of voters with the lowest rate of returns. As a result, risk-averse candidates will over-invest in their own supporters or core voters because this group is considered as a safer investment. Empirically, a group of core voters is identified as the group through which a candidate obtains the highest share of votes.
Several papers mainly using developed countries data have tested these two competing theories. Ansolabehere and Snyder (2006) find evidence that state transfers to local governments directed toward core voters in the US during 1957-1997.The same result is also well-documented in a few papers (Levitt and Snyder 1995;Larcinese et al.2006).
A large number of empirical studies, however, provide
evidence on the importance of swing voters. Using data on
social assistance block grants, Case (2001) finds that the central
government of Albania allocates larger grants to swing
communes. She demonstrates that the incumbent president
seeks to maximise the probability of his own re-election by
winning a majority of legislative seats. Likewise, utilising a more
appropriate measure of swing voters,
3Dahlberg and Johansson
(2002) also confirm that the temporary ecological grants in Sweden are generously allocated to municipalities with many swing voters, whereas they reject the core voter thesis. The other Swedish country of study tests whether vote seeking distorts the allocation of intergovernmental grants in this country (Johansson 2003).She uses the closeness of the last election and the new measure as employed by Dahlberg and Johansson (2002) to identify swing voters. She reports the closeness variable does not yield statistical significant effects on the grant allocation, whereas the latter proxy has a positive and significant effect on municipal grants, suggesting that municipalities with high numbers of swing voters receive a larger proportion of intergovernmental grants. These results also shed light on the significance of swing voters in the public policy decision-making process. For the case of Portugal, Veiga and Pinho (2007) reveal that the allocation of intergovernmental grants rises during election periods and prove that swing municipalities receive more grants. Surprisingly, the grant manipulation is stronger in the subsequent years of Portugese democracy. They argue that these findings are partially attributable to the domination of a strong single party government and the voters are not well-informed about the existence of the grants.
Stokes (2005) studies distributive politics under a dynamic setting. She models the interactions between parties and voters over multiple elections, allowing for a repeated interaction game where the party can observe the voter’s behaviour and both sides know that these relations keep on going in the future. The basic prediction of her model
3
The authors use survey data from the Swedish election studies to construct measures of the ideological preferences of voters in each municipality. The obtained measures or cut point densities divide supporters of the incumbent party from other voters. The purpose of the incumbent party, however, is to shift this cut point by using grants, pushing a number of voters to vote for this party.
139
is in line with the swing voter model. She claims that loyal voters will not receive private transfers because this group cannot be threatened to vote for the other party. Her empirical evidence from Argentina does not depart from the swing voter literature as well.
A recent study of Arulampalam et al. (2009) also extends the swing-core analysis. They address the importance of political party alignments between the central and lower levels of government. They reveal that a state that is aligned with the central government and swing in the last general elections tend to receive larger central grants than a state that is unaligned and non-swing.
While results in this line of research are mainly interpreted as favouring the swing voter hypothesis, there are at least two major challenges in studying tactical redistribution. First, it could be attributable to the flawed methods employed. Second, it is very hard to identify the exact dissimilarity of the two hypotheses since the variables used to measure them are very similar (e.g., vote margin against vote share). In some cases, the political actors choose symmetric strategies by disproportionally sending benefits to thin margin regions and to their own supporter regions. Against this background, the swing-core hypotheses are acceptable indeed (Dahlberg and Johansson 2002).
THE INDONESIAN POLITICAL INSTITUTIONS
Indonesia is a republic country with a presidential system. After the Suharto’s era in 1998, the country has undertaken substantial political and economic reforms. One of the major changes has been the implementation of fiscal decentralisation since 2001. The new idea of decentralisation gives some discretion to regional governments to manage their own domestic affairs, while the role of the central government is only limited to the areas of foreign policies, national defence and security, legal systems, macroeconomic policies, and
religion (Law No. 22/1999 amended by Law No.32/2004).4The two
4
The Republic of Indonesia is a unitary country with a three-tier of regional government structures: province (provinsi), district (kabupaten/kota), and
sub-140
provinces, Nanggroe Aceh Darussalam (NAD) and Papua, have been granted special autonomy. With this entitlement, these provinces accept government’s greatest priorities compared to their counterparts and receive special intergovernmental grants (Dana Otsus).
Looking at the political system, the general election held in 1999 has also signified the process of democratisation in Indonesia. The election was considerably very transparent and proceeded without violence. For the first time, after practicing a three-party system for more than 20 years, there were 48 parties took part during the elections to select members of the parliamentary assembly (DPR/DPRD). The parliamentary election system was based on a closed-list proportional system in which parties gained seats in proportion to their share of the vote at the provincial level, and voters selected parties not candidates, meaning that the parties decided who would sit in the parliament (Sherlock 2004). The Indonesian Democratic Party of Struggle (PDI-P) led by the daughter of the first president, Megawati Soekarnoputri, won the election. The elected parliamentary members then had their legislative privileges to select a new president and vice president. Ideally, as the leader of the winning party, Megawati Soekarnoputri had a greater chance of becoming the president. However, the parliament elected Abdurrahman Wahid (Gus Dur) to be Indonesia’s new president. The drama was ended when President Gus Dur was removed from the office and replaced by the Vice President Megawati Soekarnoputri in 2001 after an extended conflict between President Wahid and the parliament.
The general elections in 2004 could be regarded as the most complex elections in the country’s history even though fewer political parties in the race than the previous elections (Sherlock 2004). As usual, voters voted for DPR and DPRD members in the first round of the elections. Unlike the 1999 elections, the April parliamentary elections in 2004 adopted an open-list proportional system wherein voters casted their votes for one party and chose a
district (kecamatan). All regional governments have their own parliamentary bodies.
141
particular candidate from that party. Seats were allocated to each party on the basis of the share of the total vote that party received. Candidates won seats in the order they appeared on the party’s list unless a lower-ranked candidate reached a quota. Partai Golkar associated with the New Order Regime became the strongest party among 24 parties. Yet the Democratic Party founded in 2001 by the Minister of Defense, Susilo Bambang Yudhoyono, at that moment, shocked the public as the party successfully finished on the fifth place. The next round was held to directly elect the president and the vice president. It should be noted that only parties that at least won 5% of the national vote or won 3% of parliamentary seats were eligible for the presidential election. There were five contestants in the first presidential election on July 5, 2004, including Susilo Bambang Yudhoyono and the incumbent Megawati Soekarnoputri. The race was tough and none of the candidates reached the majority and were able to receive more than 20% of the vote in over half of the provinces. This led to a run-off election between the two highest ranking candidates, Susilo Bambang Yudhoyono and Megawati. Susilo Bambang Yudhoyono was finally elected as the new president in this second round election.
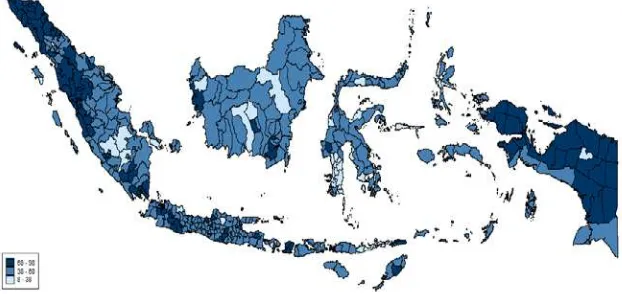
The elections in 2009 demonstrated superiority of the Democratic Party and the incumbent president indeed. The party became the largest faction in the parliament with 26.40% of the votes. This achievement was beyond the 2.50% threshold for parliamentary representation and passed the 20% threshold for nominating presidential candidates as required by the 2008 General Election Law. As for the presidential election, it followed an absolute majority system in which a candidate would become the president if he could receive over 50% of the vote and 20% of the votes in at least half of the provinces (Sherlock 2009). At that time, the incumbent president and his running mate, Boediono, were able to sway votes in almost all districts (Figure 1). They came out with more than a 30% margin of victory over the second place, Megawati-Prabowo. Susilo Bambang Yudhoyono won a surprising 60.80% of the vote in the first round election and re-elected to the presidency for the period 2009-2014.
Figure 1.2009 Presidential Election Results by District (Vote for SBY, %)
The incumbent’s performance in stabilising the national economy and in improving the well-being of households during his first term in office partly explained why Indonesians casted their ballots for him and his party. Moreover, the incumbent’s economic platforms which
were à la a left wing party had helped Susilo Bambang Yudhoyono to
attract more voters (Mujani and Liddle2010).
THE COMMUNITY-DRIVEN DEVELOPMENT (CDD) PROGRAMME IN INDONESIA: PNPM MANDIRI
President Susilo Bambang Yudhoyono introduced PNPM Mandiri programmes on 30 April 2007 in Palu, Central Sulawesi. Nowadays, it becomes the main government’s flagship community-driven development (CDD) programmes which are intended to reduce poverty and increase employment opportunities by promoting local community participation in development planning and management.
PNPM Mandiri is made up by PNPM-Core (PNPM Inti) and PNPM-Support (PNPM Penguatan). The PNPM-Core programme which focuses on area-based community empowerment programmes consists of five key components. These include: (1) PNPM Mandiri
Rural initiated in 1998 as the Kecamatan Development
Programme(KDP);(2) PNPM Mandiri Urban modelled as the Urban Poverty Programme (UPP);(3) PNPM Mandiri Support for Poor and Disadvantaged Areas (SPADA) which were initiated in 2005 as the
Development Acceleration Programme for Disadvantages and Special Regions (P2KP) and have given emphasis on the socio-economic development of underdeveloped, post-disaster, and conflicting regions; (4) PNPMMandiri Rural Infrastructure (RIS); and (5) PNPM Mandiri Regional Socio-Economic Infrastructure (RISE). The last two, however, are expected to harmonise economic growth between the cores and their peripherals.
The PNPM-Support programme delivers specific services through sectoral programmes,such as: (1) PNPM Healthy and Smart Generation (PNPM Generasi Sehat dan Cerdas) to support health and education; (2) PNPM Green to assist in natural resources management and micro-hydro initiatives; (3) PNPM SADI which facilitates agricultural development plans; (4) PNPM Respek to accelerate development process in Papua and West Papua; and etcetera (PNPM Support Facility 2011).
The protocol of PNPM Mandiri constitutes a community to conduct open meetings with their members. During the meeting, participants may propose several activities as long as their designs are intended to reduce poverty (e.g., providing and renovating dwelling areas and provision of financial resources through saving and revolving funds and micro credits), are able to accelerate the achievement of the Millennium Development Goals (MDGs) target, strengthen capacity of local government and community, and promote good governance. After the collection of proposals, there will be another meeting by community representatives in order to make the final decision on which projects are going to be funded. It should be noted that proposals recommended by women’s groups will be given higher priorities. The selected proposals will receive direct block grants (BantuanLangsungMasyarakat/BLM) which are delivered from the central government to local communities at the sub-district level. The PNPM Mandiri programme is financedthroughthe National Budget (APBN) and Regional Budget (APBD) along with private and community contributions.
A matching grant system has been used to finance the activities of PNPM Mandiri. This scheme requires each district to
provide a specified percentage of the granted block grant.The contribution from the regional budgetaccounts for approximately 20-30% of the total BLM. The variation of the matching provisionsfrom one district to another depends on a district’s fiscal capacity which is measured through fiscal index and poverty level for the respective district or Indeks Fiskal dan Kemiskinan Daerah (IFKD).
In any year, the Coordinating Ministry for People’s Welfare releases a list of eligible sub-districts for funding, where the fiscal needs of each region principally determine the amount of the block grant to each sub-district. The fiscal needs measure itself is made up of a number of variables, that is, population size, poverty incidence, and geographical factors (i.e.,whether a sub-district is located in or outer the island of Java and Bali). Apart from the allocation criteria used for the distribution of the PNPM block grants, however, the central government does not provide further information on the exact formula to deliver the fund to the sub-district. Referring to the needs of the population, everysub-district will receive an annual rural block grant from about IDR 0.75 billion (USD 75,000) to IDR 3 billion ( USD300,000); and the grant is continually distributed to the relevant sub-district for a minimum of 3 years. Conversely, PNPM Urban provides block grants of approximately IDR 125 million (USD 12,500) to IDR 300 million (USD 30,000) to every village (kelurahan/desa) per year.
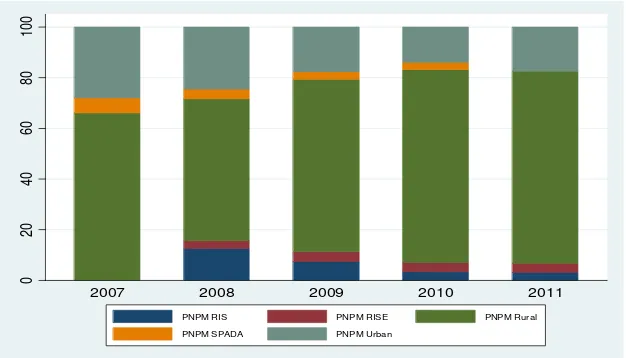
In the early period of its implementation, the PNPM Mandiri programme benefited nearly half of the Indonesian sub-districts, and it scaled up activities to cover almost all areas of the country (more than95% of sub-districts from 2009).During 2007-2011, PNPM Rural had the largest share among the other elements of PNPM-Core, accounting for around 75% of the total coverage. PNPM Urban reached approximately 20% sub-districts in Indonesia in the same period, whereas the rest came from PNPM SPADA, PNPM RIS, and PNPMRISE respectively (Figure 2).
As shown by the evaluation of its impacts, PNPM Mandiri, particularly the PNPM Mandiri Rural, has contributed to increase the welfare and self-sufficiency of the poor. It has been successful in
reducing poverty among rural households, increasing income and consumption, opening up new employment opportunities, increasing access to basic services such health care, education, water, and sanitation, local infrastructure provision at lower costs, and developing local capacity building. It was reported that the effects have been stronger in poorer and remote areas (PNPM Support Facility 2011).
DATA AND EMPIRICAL STRATEGY
Data
This paper uses a panel of all Indonesian districts from 2010 to 2011. The data on the allocation of PNPM Mandiri block grants are extracted from the Coordinating Ministry for People’s Welfare. The data provide detailed statistics for the size of PNPM Mandiri block grants that come from the budget of national and regional governments. More importantly, they are also disaggregated by the five types of the PNPM-Core programmes. This dataset is aggregated at the district level, thus, they can be merged with the other used variables which are only available at the district level.
Figure 2. The Composition of PNPM Mandiri across Sub-district by Type of Programme (%), 2007-2011
0
20
40
60
80
10
0
2007 2008 2009 2010 2011
PNPM RIS PNPM RISE PNPM Rural
PNPM SPADA PNPM Urban
As explained in the previous section, the general formula to allocate the grant to a sub-district is determined by the level of poverty, the population density, and the geographical condition of the relevant region. The study uses a broader definition of the control variables which are closely associated with the main purposes of the block grant programme under study. These represent socioeconomic conditions, demographic, educational attainment, health practices, and basic infrastructure. All these data are taken from the Indonesian Central Bureau of Statistics (BPS). The remaining data are the presidential election results in 2009 drawn from the Elections Monitoring Agency (Bawaslu).
Empirical Strategy
The model is focused principally on the distribution of block
grants to district 𝑖𝑖in year 𝑡𝑡 as a function of a vector of variables that
are supposed to be important for the PNPM Mandiri grant and a vector of political variables as follows:
𝑃𝑃𝑃𝑃𝑃𝑃𝑃𝑃𝑃𝑃𝑅𝑅𝑃𝑃𝑃𝑃𝑃𝑃𝑖𝑖𝑖𝑖=𝛼𝛼+𝛽𝛽𝑍𝑍𝑖𝑖𝑖𝑖′ +𝛾𝛾𝑃𝑃𝑖𝑖𝑖𝑖′ +𝑣𝑣𝑖𝑖+𝜀𝜀𝑖𝑖𝑖𝑖 (1)
where𝑃𝑃𝑃𝑃𝑃𝑃𝑃𝑃𝑃𝑃𝑅𝑅𝑃𝑃𝑃𝑃𝑃𝑃 is the real per capita PNPM block grant
(in the 2000 prices and in logarithms). The grant may take the form of PNPM Rural, PNPM Urban, PNPM RIS, and PNPM RISE. It is also separated based on the sources of funding, whether it originates from the national budget (APBN) or the regional budget (APBD).
The first part of the vector 𝑍𝑍′captures need factors and other
relevant socioeconomic variables. These explanatory variables are population size (in logarithms), the rate of poverty, the real per capita gross regional domestic product (in the 2000 prices and in logarithms), and the unemployment rate. The inclusion of the unemployment rate is motivated by the fact that one goal of the PNPM grants is to increase the employment rate in the eligible district. Thus, the estimated coefficient for this variable is expected to be positive.
A poor district is also expected to have lower levels of education and health status. The variables of the average years of schooling and the literacy rate, thus, are used as the proxies for the educational attainment of the population and they are expected to show negative signs. When it comes to the health practices, the size of the grant is supposed to inversely related to the rate of birth assisted by medical staff, whereas the block grant should have a positive association with the morbidity rate. The last control variables are the access to basic infrastructure, represented by the access to basic sanitary and electricity. Negative signs are expected for the estimated coefficients associated with these two variables.
The vector of 𝑃𝑃′ captures our variables of interests, the two
measures of tactical motivations in the block grant allocation process. The first political variable is the vote share for the incumbent president in the 2009 presidential election, which enables the Cox and McCubbins model to be tested. A positive sign of the variable can be interpreted that the incumbent president is in favour of his supporter. The next political variable measures the absolute difference in vote shares between the incumbent president and his main competitor. By utilising this variable, the Lindbeck and Weibull and Dixit and Londregan hypotheses were examined, stating that districts with many swing voters are targeted by the incumbent president to win the election. From the theoretical prediction, a negative coefficient for this variable is expected.
Finally, 𝑣𝑣𝑖𝑖 is district specific fixed effects, accounting for
persistent differences among districts that could be correlated with
the allocation of the PNPM Mandiri block grant. 𝜀𝜀𝑖𝑖𝑖𝑖is the error term.
A FIRST LOOK AT THE DATA
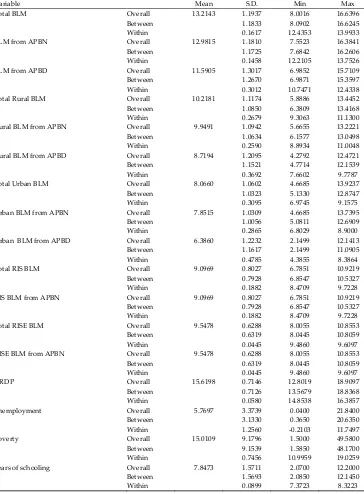
In order to get some insight into the data set used in the main analysis, Table 1 displays the mean, standard deviations, maximum, and minimum for the related variables. In addition to the overall variation, the table also reports the between variation that indicates
the variation across districts and the within variation that is essentially the temporal variation.
Table 1. Summary Statistics for the Variable Used in the Analysis
Variable Mean S.D. Min Max
Total BLM Overall 13.2143 1.1937 8.0016 16.6396
Between 1.1833 8.0902 16.6245
Within 0.1617 12.4353 13.9933
BLM from APBN Overall 12.9815 1.1810 7.5523 16.3841
Between 1.1725 7.6842 16.2606
Within 0.1458 12.2105 13.7526
BLM from APBD Overall 11.5905 1.3017 6.9852 15.7109
Between 1.2670 6.9871 15.3597
Within 0.3012 10.7471 12.4338
Total Rural BLM Overall 10.2181 1.1174 5.8886 13.4452
Between 1.0850 6.3809 13.4168
Within 0.2679 9.3063 11.1300
Rural BLM from APBN Overall 9.9491 1.0942 5.6655 13.2221
Between 1.0634 6.1577 13.0498
Within 0.2590 8.8934 11.0048
Rural BLM from APBD Overall 8.7194 1.2095 4.2792 12.4721
Between 1.1521 4.7714 12.1539
Within 0.3692 7.6602 9.7787
Total Urban BLM Overall 8.0660 1.0602 4.6685 13.9237
Between 1.0323 5.1330 12.8747
Within 0.3095 6.9745 9.1575
Urban BLM from APBN Overall 7.8515 1.0309 4.6685 13.7395
Between 1.0056 5.0811 12.6909
Within 0.2865 6.8029 8.9000
Urban BLM from APBD Overall 6.3860 1.2232 2.1499 12.1413
Between 1.1617 2.1499 11.0905
Within 0.4785 4.3855 8.3864
Total RIS BLM Overall 9.0969 0.8027 6.7851 10.9219
Between 0.7928 6.8547 10.5327
Within 0.1882 8.4709 9.7228
RIS BLM from APBN Overall 9.0969 0.8027 6.7851 10.9219
Between 0.7928 6.8547 10.5327
Within 0.1882 8.4709 9.7228
Total RISE BLM Overall 9.5478 0.6288 8.0055 10.8553
Between 0.6319 8.0445 10.8059
Within 0.0445 9.4860 9.6097
RISE BLM from APBN Overall 9.5478 0.6288 8.0055 10.8553
Between 0.6319 8.0445 10.8059
Within 0.0445 9.4860 9.6097
GRDP Overall 15.6198 0.7146 12.8019 18.9097
Between 0.7126 13.5679 18.8368
Within 0.0580 14.8538 16.3857
unemployment Overall 5.7697 3.3739 0.0400 21.8400
Between 3.1330 0.3650 20.6350
Within 1.2560 -0.2103 11.7497
poverty Overall 15.0109 9.1796 1.5000 49.5800
Between 9.1539 1.5850 48.1700
Within 0.7456 10.9959 19.0259
years of schooling Overall 7.8473 1.5711 2.0700 12.2000
Between 1.5693 2.0850 12.1450
Within 0.0899 7.3723 8.3223
Variable Mean S.D. Min Max
literacy Overall 91.9296 11.8844 27.3900 99.9500
Between 11.8845 27.5850 99.9450
Within 0.3721 88.5296 95.3296
births assisted by medical staff Overall 75.108 21.147 2.865 100.000
Between 20.787 2.903 100.000
Within 3.941 51.277 98.939
morbidity Overall 17.453 6.749 1.486 51.786
Between 6.019 5.651 47.905
Within 3.058 -3.058 37.964
access to adequate sanitation Overall 49.155 23.226 0.000 99.093
Between 23.242 0.000 98.500
Within 3.760 34.215 64.095
access to electricity Overall 85.869 20.186 0.000 100.000
Between 20.346 0.000 100.000
Within 2.743 66.233 105.505
population Overall 5.449 0.456 3.788 6.686
Between 0.453 4.161 6.682
Within 0.052 4.856 6.042
vote for SBY Overall 59.7241 17.326 8.372 97.756
Between 17.335 8.372 97.756
Within 0.000 59.724 59.724
swing Overall 15.8551 11.967 0.144 47.756
Between 11.973 0.144 47.756
Within 0.000 15.855 15.855
Notes: The time period is 2010-2011. The number of observations is 935.
As indicated by the statistics presented in Table 1, the variation across districts makes the largest contribution to the overall standard deviation. This conclusion is particularly true for the infrastructure variables (i.e., access to basic sanitary and access to electricity) and the variable of birth assisted by medical staff. The striking difference in the between variation in the rates of poverty and literacy is also noted. This inspection explains that a fixed effect might be able to capture most of the variation in these variables. However, this would lead to insignificant coefficient estimates for the variables in the analysis. With regard to the two political variables measuring the number of core and swing voters, it can be observed that the within variation for these variables is zero. This is because, within each district, this study only makes use of the 2009 presidential election results. Looking at the
percent voting in favour of the incumbent president, the mean value for this variable is very close to the number reported by the General
Elections Commission (KPU), 59.72% against 60.80%.
Main Findings
This section presents the main results from the regression analysis based on the specification in equation (1). As mentioned previously, two sets of regressor are used, whereas the reported
standard errors are robust with respect to heteroscedasticity.5
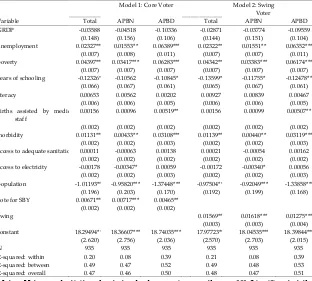
Column (1), (2), and (3) of Table 2 provide the estimates of the total grant received, the grant from APBN, and finally the grant from APBD.
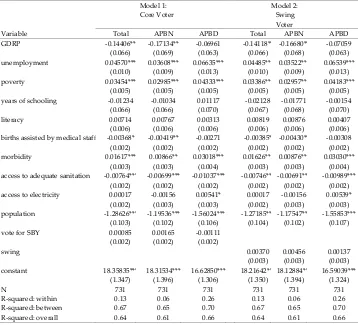
The results for the core voter model are shown in Model 1. Starting with the political variable, the estimated coefficients are clearly significant in all estimations and have the expected positive sign, suggesting that the higher the number of people in a particular district vote for the incumbent president in the election, the higher the amount of the grant to be transferred to that district will be. Holding all else equal, a 1% increases in the district’s voting for the incumbent president is associated with an increase in the real block grant per capita received, ranging from approximately 0.005% to 0.007%.
Turning to the measure of the swing voters, although the point estimates are statistically different from zero at the 5% level, they have an unexpected positive sign, implying that the incumbent president allocates less grants to districts with many swing voters (Model 2 of Table 2). Does this indicate that the incumbent tries to penalise swing districts? Nevertheless, this finding should be interpreted with some caution since this variable is not essentially the excellent measure of swing voters. The validity of this measure rests on strong assumptions that the distributions of ideological preferences among voters are symmetric and single-peaked,
5
I have experimented with other specifications, but these do not affect the main results.
151
knowing that there are only two competing candidates in the
race. In fact, these assumptions do not always hold.
Table 2. Determinants of PNPM Mandiri Block Grants
Notes: Heteroscedasticity robust standard errors in parentheses. *** Significant at the 1% level. ** Significant at the 5% level. * Significant at the 10% level.
Model 1: Core Voter Model 2: Swing Voter
Variable Total APBN APBD Total APBN APBD GRDP -0.03588 -0.04518 -0.10336 -0.02871 -0.03774 -0.09559
(0.148) (0.156) (0.106) (0.144) (0.151) (0.104) unemployment 0.02327*** 0.01553** 0.06389*** 0.02322** 0.01551** 0.06352***
(0.007) (0.008) (0.011) (0.007) (0.007) (0.011) poverty 0.04397*** 0.03417*** 0.06283*** 0.04342** 0.03383*** 0.06174***
(0.007) (0.007) (0.007) (0.007) (0.007) (0.007) years of schooling -0.12326* -0.10562 -0.10845* -0.13599* -0.11755* -0.12478**
(0.066) (0.067) (0.061) (0.065) (0.067) (0.061) literacy 0.00653 0.00562 0.00202 0.00927 0.00839 0.00467 (0.006) (0.006) (0.005) (0.006) (0.006) (0.005) births assisted by medic
staff
0.00156 0.00096 0.00519** 0.00156 0.00099 0.00507** (0.002) (0.002) (0.002) (0.002) (0.002) (0.002) morbidity 0.01131*** 0.00433** 0.03108*** 0.01139** 0.00440** 0.03119***
(0.002) (0.002) (0.003) (0.002) (0.002) (0.003) access to adequate sanitatio 0.00011 -0.00063 0.00138 0.00021 -0.00054 0.00162 (0.002) (0.002) (0.002) (0.002) (0.002) (0.002) access to electricity -0.00178 -0.00347* 0.00059 -0.00172 -0.00340* 0.00056 (0.002) (0.002) (0.003) (0.002) (0.002) (0.003) population -1.01193** -0.95820*** -1.37448*** -0.97504** -0.92049*** -1.33858***
(0.196) (0.203) (0.170) (0.192) (0.199) (0.168) vote for SBY 0.00671*** 0.00717*** 0.00465**
(0.002) (0.002) (0.002)
swing 0.01569** 0.01618*** 0.01275*** (0.003) (0.003) (0.004) constant 18.29494** 18.36607*** 18.74035*** 17.97723** 18.04535*** 18.39844***
(2.620) (2.756) (2.036) (2.570) (2.703) (2.015) N 935 935 935 935 935 935 R-squared: within 0.20 0.08 0.39 0.21 0.08 0.39 R-squared: between 0.49 0.47 0.52 0.49 0.48 0.53 R-squared: overall 0.47 0.46 0.50 0.48 0.47 0.51
Perhaps the distributions are right-tailed or left-tailed, and many people in the district are very conservative and consequently they would not even think of switching their support (Johansson2003).
We continue our empirical analysis by discussing the other control variables. We can see they all have the expected signs, except for the literacy rate, the proportion of births assisted by medical staff, and the access to basic sanitation. We can leave the last three variables since they are not significant. That several control variables are not statistically significant is probably due to the present of fixed effects and relatively short periods of time.
Table 2 also confirms a substantial effect of the poverty rate on the allocation of PNPM Mandiri grants. This result is not surprising when we know that the block grant is partly distributed according to the incidence of poverty as well. The higher the poverty rate, the larger the amount of the block grant to be transferred to the district. The regression coefficient of unemployment, however, is statistically distinguishable from zero and is nearly half of the estimated coefficient on poverty. On average, there will be a 0.02% higher in the allocation of the grant per capita to a district with a 1% additional of the unemployment rate. The same is also true for the morbidity rate. In this case, the allocation of the grant is also higher if the morbidity rate is higher (point estimates of 0.004 - 0.031).
Despite the main objective of the grant under study differs a lot from the purposes of standard intergovernmental grants, the allocation of the block grants to local governments also addresses the horizontal equity. The estimate coefficient for the population variable is negative and statistically significant at the 1% level. If the number of the population increases by 1%, the regression result shows that the allocation of PNPM grants increases by 1.01%. Notably, it is also suggests that the government puts the largest weight to this variable compared to the other independent variables. The existence of economies of scale in the provision of public goods by local governments demands a decrease in per capita grants together with
the size of the population. Moreover, because larger districts can provide public goods with low-cost resources, the central government should ideally transfer smaller grants.
Differential Effects by the Types of PNPM Mandiri
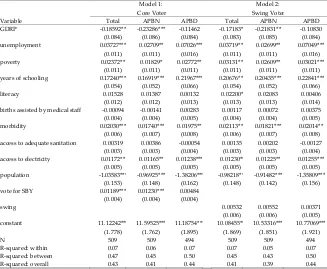
The main problem with previous studies is that they have not been able to distinguish types of grant programmes that are more susceptible to political manipulationand whether different block grants are exploited to achieve different objectives. The analysis now proceeds to address such issues by running separate regressions for each type of the PNPM-Core programmes on the covariates. The
results of this exercise are presented in Table 3 – Table 6.6We focus
our attention on the two political variables. While none of the types of PNPM-Core grants are significantly affected by the swing voter measure, the core voter variable enters positively and significantly to the allocation of the PNPM Urban block grant. The effect of this tactical variable, however, is larger than the previous finding with the estimate coefficients that are0.0119 versus 0.0067 (Table 4). This evidence seems to strengthen the analysis of the 2009 election results, reporting that the main supporters of the incumbent president and his party are concentrated in urban areas and come from the middle class. Therefore, it is very plausible that the incumbent politicians divert more funds toward their loyal supporters.
6
Because of an extremely small sample size, I could not perform regressions that use the SPADA block grant as the dependent variable.
154
Table 3. Determinants of PNPM Mandiri-Rural Block Grants
Notes: Heteroscedasticity robust standard errors in parentheses. *** Significant at the 1% level. ** Significant at the 5% level. * Significant at the 10% level
Model 1: Core Voter
Model 2: Swing Voter
Variable Total APBN APBD Total APBN APBD
GDRP -0.14406** -0.17134** -0.06961 -0.14118** -0.16680** -0.07059 (0.066) (0.069) (0.063) (0.066) (0.068) (0.063) unemployment 0.04570*** 0.03608*** 0.06635*** 0.04485*** 0.03522*** 0.06539***
(0.010) (0.009) (0.013) (0.010) (0.009) (0.013) poverty 0.03454*** 0.02985*** 0.04333*** 0.03386*** 0.02957*** 0.04183***
(0.005) (0.005) (0.005) (0.005) (0.005) (0.005) years of schooling -0.01234 -0.01034 0.01117 -0.02128 -0.01771 -0.00154
(0.066) (0.066) (0.070) (0.067) (0.068) (0.070)
literacy 0.00714 0.00767 0.00313 0.00819 0.00876 0.00407
(0.006) (0.006) (0.006) (0.006) (0.006) (0.006) births assisted by medical staff -0.00368* -0.00419** -0.00271 -0.00385* -0.00430** -0.00308
(0.002) (0.002) (0.002) (0.002) (0.002) (0.002) morbidity 0.01617*** 0.00866** 0.03018*** 0.01626*** 0.00876*** 0.03030***
(0.003) (0.003) (0.004) (0.003) (0.003) (0.004) access to adequate sanitation -0.00764*** -0.00699*** -0.01037*** -0.00746** -0.00691** -0.00989***
(0.002) (0.002) (0.002) (0.002) (0.002) (0.002) access to electricity 0.00017 -0.00156 0.00541* 0.00017 -0.00156 0.00539*
(0.002) (0.003) (0.003) (0.002) (0.003) (0.003) population -1.28626*** -1.19536*** -1.56024*** -1.27185** -1.17547** -1.55853***
(0.103) (0.102) (0.106) (0.104) (0.102) (0.107)
vote for SBY 0.00085 0.00165 -0.00111
(0.002) (0.002) (0.002)
swing 0.00370 0.00456 0.00137
(0.003) (0.003) (0.003) constant 18.35835*** 18.31534*** 16.62850*** 18.21642** 18.12884** 16.59039***
(1.347) (1.396) (1.306) (1.350) (1.394) (1.324)
N 731 731 731 731 731 731
R-squared: within 0.13 0.06 0.26 0.13 0.06 0.26
R-squared: between 0.67 0.65 0.70 0.67 0.65 0.70
R-squared: overall 0.64 0.61 0.66 0.64 0.61 0.66
Table 4. Determinants of PNPM Mandiri-Urban Block Grants
Model 1: Core Voter
Model 2: Swing Voter
Variable Total APBN APBD Total APBN APBD GDRP -0.18592** -0.23286*** -0.11462 -0.17183* -0.21831** -0.10830
(0.084) (0.086) (0.084) (0.083) (0.085) (0.084) unemployment 0.03727*** 0.02709** 0.07026*** 0.03719** 0.02699** 0.07049***
(0.011) (0.011) (0.016) (0.011) (0.011) (0.016) poverty 0.02372** 0.01829* 0.02772** 0.03131** 0.02609** 0.03021***
(0.011) (0.011) (0.011) (0.011) (0.011) (0.011) years of schooling 0.17240*** 0.16919*** 0.21967*** 0.20676** 0.20435*** 0.22841***
(0.054) (0.052) (0.066) (0.054) (0.052) (0.066) literacy 0.01528 0.01387 0.00132 0.02200* 0.02083 0.00406 (0.012) (0.012) (0.013) (0.013) (0.013) (0.014) births assisted by medical staff -0.00094 -0.00141 0.00283 0.00117 0.00072 0.00375 (0.004) (0.004) (0.005) (0.004) (0.004) (0.005) morbidity 0.02030*** 0.01740*** 0.01975** 0.02113** 0.01821*** 0.02014**
(0.006) (0.007) (0.008) (0.006) (0.007) (0.008) access to adequate sanitation 0.00319 0.00386 -0.00054 0.00135 0.00202 -0.00127 (0.003) (0.003) (0.004) (0.003) (0.003) (0.004) access to electricity 0.01172** 0.01165** 0.01238*** 0.01230** 0.01225** 0.01255***
(0.005) (0.005) (0.005) (0.005) (0.005) (0.005) population -1.03583*** -0.96925*** -1.38206*** -0.98218** -0.91482*** -1.35809***
(0.153) (0.148) (0.162) (0.148) (0.142) (0.156) vote for SBY 0.01189*** 0.01230*** 0.00484
(0.004) (0.004) (0.004)
swing 0.00532 0.00552 0.00371 (0.006) (0.006) (0.005) constant 11.12242*** 11.59525*** 11.18754*** 10.08455** 10.53316*** 10.77069***
(1.778) (1.762) (1.895) (1.869) (1.851) (1.921) N 509 509 494 509 509 494 R-squared: within 0.07 0.06 0.07 0.07 0.05 0.07 R-squared: between 0.47 0.45 0.50 0.45 0.43 0.50 R-squared: overall 0.43 0.41 0.44 0.41 0.39 0.44
Notes: Heteroscedasticity robust standard errors in parentheses. *** Significant at the 1% level. ** Significant at the 5% level. * Significant at the 10% level.
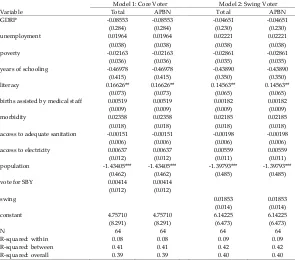
Table 5. Determinants of PNPM Mandiri-RIS Block Grants
Model 1: Core Voter Model 2: Swing Voter Variable Total APBN Total APBN GDRP -0.08553 -0.08553 -0.04651 -0.04651
(0.284) (0.284) (0.230) (0.230) unemployment 0.01964 0.01964 0.02221 0.02221 (0.038) (0.038) (0.038) (0.038) poverty -0.02163 -0.02163 -0.02861 -0.02861 (0.036) (0.036) (0.035) (0.035) years of schooling -0.46978 -0.46978 -0.43890 -0.43890 (0.415) (0.415) (0.350) (0.350) literacy 0.16626** 0.16626** 0.14563** 0.14563**
(0.073) (0.073) (0.065) (0.065) births assisted by medical staff 0.00519 0.00519 0.00182 0.00182 (0.009) (0.009) (0.009) (0.009) morbidity 0.02358 0.02358 0.02185 0.02185 (0.018) (0.018) (0.018) (0.018) access to adequate sanitation -0.00151 -0.00151 -0.00198 -0.00198 (0.006) (0.006) (0.006) (0.006) access to electricity 0.00637 0.00637 0.00559 0.00559 (0.012) (0.012) (0.011) (0.011) population -1.43405*** -1.43405*** -1.39793*** -1.39793***
(0.462) (0.462) (0.485) (0.485) vote for SBY 0.00414 0.00414
(0.012) (0.012)
swing 0.01853 0.01853 (0.014) (0.014) constant 4.75710 4.75710 6.14225 6.14225 (8.291) (8.291) (6.473) (6.473) N 64 64 64 64 R-squared: within 0.08 0.08 0.09 0.09 R-squared: between 0.41 0.41 0.42 0.42 R-squared: overall 0.39 0.39 0.40 0.40
Notes: Heteroscedasticity robust standard errors in parentheses. *** Significant at the 1% level. ** Significant at the 5% level. * Significant at the 10% level.
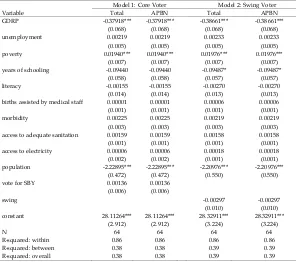
Table 6. Determinants of PNPM Mandiri-RISE Block Grants
Model 1: Core Voter Model 2: Swing Voter Variable Total APBN Total APBN GDRP -0.37918*** -0.37918*** -0.38661*** -0.38661***
(0.068) (0.068) (0.068) (0.068) unemployment 0.00219 0.00219 0.00233 0.00233 (0.005) (0.005) (0.005) (0.005) poverty 0.01940*** 0.01940*** 0.01976*** 0.01976***
(0.007) (0.007) (0.007) (0.007) years of schooling -0.09440 -0.09440 -0.09487* -0.09487*
(0.058) (0.058) (0.057) (0.057) literacy -0.00155 -0.00155 -0.00270 -0.00270 (0.014) (0.014) (0.013) (0.013) births assisted by medical staff 0.00001 0.00001 0.00006 0.00006 (0.001) (0.001) (0.001) (0.001) morbidity 0.00225 0.00225 0.00219 0.00219 (0.003) (0.003) (0.003) (0.003) access to adequate sanitation 0.00159 0.00159 0.00158 0.00158 (0.001) (0.001) (0.001) (0.001) access to electricity 0.00006 0.00006 0.00018 0.00018 (0.002) (0.002) (0.001) (0.001) population -2.22895*** -2.22895*** -2.20976*** -2.20976***
(0.472) (0.472) (0.550) (0.550) vote for SBY 0.00136 0.00136
(0.006) (0.006)
swing -0.00297 -0.00297 (0.010) (0.010) constant 28.11264*** 28.11264*** 28.32911*** 28.32911***
(2.912) (2.912) (3.224) (3.224) N 64 64 64 64 R-squared: within 0.86 0.86 0.86 0.86 R-squared: between 0.38 0.38 0.39 0.39 R-squared: overall 0.38 0.38 0.39 0.39
Notes: Heteroscedasticity robust standard errors in parentheses.*** Significant at the 1% level. ** Significant at the 5% level. * Significant at the 10% level.
CONCLUSION
In sum, the understanding of the main findings has documented the idea of Cox and McCubbins (1986), stating that politicians have favour over their own supporters. At the empirical level, this evidence is in agreement with little research on presidential politics. Chief among them is the pioneering paper of Wright (1974) that studies the political economy of the New Deal spending during Roosevelt’s presidency and several recent research that still uses the US data (Larcinese et al. 2006; Taylor 2008). On the contrary, this study does not find any support for the swing voter thesis as postulated by Lindbeck and Weibull (1987) and Dixit and Londregan (1996). In the similar vein, it is not possible to corroborate the findings from the Swedish cases (Dahlberg and Johansson 2002; Johanson2003), Case (2001) for Albania, and Arulampalam et al. (2009) for India.
Because voting is not mandatory in the current election system and the registered voters are allowed to not cast their votes, the results of this study to some extent also speak to the contemporary turnout-buying model of Nichter. His proposal suggests that political actors will target their own supporters due to their effort to drive voters to the polls.
The evidence that the distribution of PNPM Mandiri grants is principally based on a simplistic fiscal needs formula raises a question about the appropriate design of the programme itself. There are four implications that can be highlighted related to the formulation of the block grant. First, it should be ensured that the used relative weights are able to meet the needs of the population with a strong focus on poverty. Second, because PNPM Mandiri facilitates a wide range of activities, the inclusion of population age structure seems to be reasonable to address the needs of different age groups. Third, Indonesia is a huge country with unique geographical patterns. One major concern with this, of course, is how to adjust the grant formula to take into account variations in the cost of inputs as a result of differential
accessibility among regions. Fourth, because the PNPM grant is also intended to increase employment opportunities, it is essential to consider labour market conditions, such as the unemployment rate, into formulation of the block grants. The finding from this study also strengthens the last proposal.
As mentioned previously, this paper studies the models of distributive politics. The focus is on tactical redistribution in which the benevolent government disproportionately allocates particularistic benefits to purchase votes from a specific group of people and thus increase the probability of winning (re)elections.
This is the first attempt to reveal any pure political motivations in the allocation of PNPM Mandiri block grants across districts in Indonesia. The study shows that the districts that are the main supporters of the incumbent president tend to receive larger block grants. On the other hand, there is no evidence for the prediction that the incumbent government delivers more grants to the districts where there are a lot of swing voters. The empirical exercises also underscore the heterogeneous impact of the presidential politics, that is, urban areas that gave the incumbent president large proportions of votes in the previous election are rewarded.
Although the findings of this paper provide new insights into the tactical distribution of block grants in Indonesia, there are several interesting questions that leave aside for the future work. This study has not incorporated a model of political competition in which parties compete for voters’ electoral support. This analysis is particularly suited in our case because the Indonesian parliament plays an important role in the newly consultative budget process, including the budget for PNPM Mandiri. Thus, if the party of the incumbent president wins a majority of the parliamentary seats, the president along with the parliament could also try to bolster their electoral advantage by diverting block grants toward a particular group.
There are some effects of political alignment between the central government and lower levels of government. The idea is that the central government grants lower-tier governments to obtain political credits from voters in a specific region. This is obviously not a problem for the central government if the local government belongs to the same party. However, it could be problematic when there is no political alignment between the two different layers of government because the local government may refuse to receive the grant or reject to implement the project. As for PNPM Mandiri, it was reported that some local governments opted to take part in the programme, especially in the early years of programme implementation, and they also did not comply with the procedure of the programme to provide joint funds from the their local budgets. More research in this vein is necessary to broaden the understanding of the political economy of PNPM Mandiri.
A non-trivial issue in newly democratising country like Indonesia is the possibility of an electoral incumbency effect as a result of the ability of the incumbent to manipulate public funds for his own political advantage. Moreover, many voters in Indonesia are politically inexperienced or uninformed. Therefore, they could be easily convinced to support the incumbent through extra provision of public goods and services. Recent seminal work by Lee (2008) seems to confirm this incumbency effect. To provide a satisfactory answer whether this is also true for Indonesia still needs a careful investigation.
Lastly, along with the implementation of the Village Law of 2014 and the introduction of village funds, the finding that the allocation of the government’s anti-poverty programme is not politically neutral calls for a well-designed and transparent formula to enhance the overall effectiveness of the programme in reaching its goals.
REFERENCES
Ansolabehere, S. and Snyder, J. 2006.‘Party Control of State Government and The Distribution of Public Expenditures.’
Scandinavian Journal of Economics 108(4): 547-569.
Arulampalam, W., Dasgupta, S., Dhillon, A. andDutta, B. 2009. ‘Electoral Goals and Centre-State Transfers: A Theoretical
Model and Empirical Evidence from India.’ Journal of
Development Economics 88 (1): 103-119.
Bardhan, P. and Mookherjee, D. 2000. ‘Capture and Governance at
Local and National Levels.’ American Economic Review 90 (2):
135-139.
Bardhan, P. AndMookherjee, D. 2005.‘Decentralizing Antipoverty
Programme Delivery in Developing Countries.’ Journal of
Public Economics 89 (4): 675-704.
Bardhan, P. and Mookherjee, D. 2006.‘Decentralization and Accountability in Infrastructure Delivery in Developing
Countries.’ Economic Journal 116 (508): 101-127.
Case, A. 2001. ‘Election Goals and Income Redistribution: Recent
Evidence from Albania.’ European Economic Review 45(3):
405-423.
Cox, Gary W. and McCubbins, M. 1986.‘Electoral Politics as A
Redistributive Game.’The Journal of Politics48 (2): 370-389.
Dahlberg, M. and Johansson, E. 2002. ‘On The Vote-Purchasing
Behaviour of Incumbent Governments.’ American Political
Science Review 96(1): 27-40.
Dixit, A. and Londregan, J. 1996. ‘The Determinants of Success of
Special Interests in Redistributive Politics.’The Journal of
Politics 58(4): 1132-1155.
Downs, A. 1957. An Economic Theory of Democracy. New York:
Harper & Row.
Golden, M. and Min, B. 2013.‘Distributive Politics around The
World.’ The Annual Review of Political Science 16: 73-99.
Johansson, E. 2003.‘Inter-governmental Grants as A Tactical Instrument: Empirical Evidence from Swedish
Municipalities.’ Journal of Public Economics 87(5-6): 883-915.
Larcinese, V., Rizzo, L. and Testa, C. 2006.‘Allocating The U.S. Federal Budget to The States: The Impact of The
President.’The Journal of Politics 68(2): 447-456.
Lee, D. 2008. ‘Randomized Experiments from Non-Random
Selection in U.S. House Elections.’ Journal of Econometrics 142:
675-697.
Levitt, S. David and Snyder, J. 1995. ‘Political Parties and the
Distribution of Federal Outlays.’American Journal of Political
Science39 (4): 958-980.
Lindbeck, A. AndWeibull, J. Waloddi.1993. ‘A Model of Political
Equilibrium in ARepresentative Democracy.’Journal of Public
Economics51(2): 195-209.
McCarty, N.Matthew. 2000. ‘Presidential Pork: Executive Veto
Power and Distributive Politics.’ American Political Science
Review 94 (1): 117-129.
Mujani, S.AndLiddle, R.William.2010. ‘Personalities, Parties, and
Voters.’Journal of Democracy 21 (2): 35-49.
Nichter, S. 2008. ‘Vote Buying or Turnout Buying?Machine Politics
and The Secret Ballot.’ American Political Science Review 10 (1):
19-31.
PNPM Support Facility. 2011. “2011 PSF Progress Report.” World Bank, Jakarta.
Sherlock, S. 2004. ‘The 2004 Indonesian Elections: How The System Works and What The Parties Stand for.’CDI Policy Papers on Political Governance 2004-17.Australian National University, Canberra.
Sherlock, S. 2009.”Indonesia’s 2009 Elections: The New Electoral System and The Competing Parties.”CDI Policy Papers on Political Governance 2009-01. Australian National University, Canberra.
Solé-Ollé, A.AndSorribas, P. 2008. ‘The Effects of Partisan Alignment on The Allocation of Intergovernmental Transfers:
Difference-In-Differences Estimates for Spain.’Journal of Public Economics92
(12): 625-671.
Stokes, S. 2005. ‘Perverse Accountability: A Formal Model of
Machine Politics with Evidence from Argentina.’American
Political Science Review99(3): 315-325.
Taylor, A. 2008.‘Presidential Pork Barrel and The Conditioning Term
Effect.’Presidential Studies Quarterly 38 (1): 96-109.
Veiga, L. Gonçavales and Pinho, M. Manuel. 2007. ‘The Political Economy of Inter-governmental Grants: Evidence from A
Maturing Democracy.’ Public Choice 133: 457-477.
Wright, G. 1974.‘The Political Economy of New Deal Spending: An
Econometric Analysis.’The Review of Economics and Statistics 56
(1): 30-38.