Data Warehousing Disease Track Record Historical
RSU Dr. Soetomo for Supporting Decision Making
Abstract – A database for transaction recording system
is usually designed and optimized to increase the recording and verification transactions processing, it calls OLTP. RSU Dr. Soetomo only has an OLTP for recording disease track records. This database is difficult to be analyzed and take long processing time because it designs and optimizes for recording facts detail about treatment, such as patient, disease, doctor and others data. Therefore a Star Scheme is designed in our research to support the analyzing disease track record easier and faster. As a result, decisions making for preventive and curative the disease can be done faster. In addition, we develop a prototype for transforming the origin database into Star Scheme and we develop OLAP prototype system. Base on the OLAP prototype evaluations, we conclude that the Star Scheme has well designed. The OLAP database is ready to use for further research.
Keywords: Data Warehousing, Star Schema, OLAP,
Disease Track Record
1
Introduction
RSU Dr. Soetomo is the biggest hospital in the Eastern Indonesia. Therefore, the hospital becomes a reference hospital from other medium and small hospitals. One of RSU Dr. Soetomo commitments is implementation Indonesia Sehat 2010 vision, which proposed by [3]. • Disease records include disease code, disease name • Live at a healthy environment
• Practice a hygienic and healthy life style • Prepare and reach a high quality health service • Have a high health degree.
General medical records are huge and complexity data. This kind of database form is difficult to be analyzed because it designed and optimized for transactional for recording facts detail about treatment, such as patient name, disease, doctor, diagnosis time, and others. Base on RSU Dr. Soetomo background of study, a Star Scheme is designed in our research for supporting the analyzing disease track record historically easier and faster. Therefore decisions making for preventive the disease can be done faster. The Star Scheme is built using the Oracle 9i. We develop a prototype for transforming the origin database (OLTP) into Star Scheme. In addition, we develop an On Line Analytical Processing (OLAP) prototype system for the Star Scheme using the Java Netbeans IDE 6.1.
2
Basic Concept
2.1
Data Warehouse Definition
A data warehouse is a system that retrieves and consolidates data periodically from the source systems into a dimensional or normalized data store. It usually keeps years of history and is queried for business intelligence or other analytical activities. It is typically updated in batches, not every time a transaction happens in the source system [8].
Gregorius Satia Budhi1
Informatics Engineering Department, Faculty of Industrial Technology
Petra Christian University Siwalankerto 121-131, Surabaya, 60236
e-mail: [email protected]
Oviliani Yenty Yuliana2
Informatics Engineering Department, Faculty of Industrial Technology
Petra Christian University Siwalankerto 121-131, Surabaya, 60236
e-mail: [email protected]
Silvia Rostianingsih3
Informatics Engineering Department, Faculty of Industrial Technology
Petra Christian University Siwalankerto 121-131, Surabaya, 60236
e-mail: [email protected]
Sunny Kuncoro4
Informatics Engineering Department, Faculty of Industrial Technology
Figure 1. A Diagram of a Data Warehouse System [8]
2.2
Dimensional Modeling
The terms dimensions and facts originated from a joint research project conducted by General Mills and Dartmouth University in the 1960s. In the 1970s, both AC Nielsen and IRI used these terms consistently to describe their syndicated data offerings, which could be described accurately today as dimensional data marts for retail sales data. Long before simplicity was a lifestyle trend, the early database syndications gravitated to these concepts for simplifying the presentation of analytic information [6], [7].
• Fact Table:
A fact table is the primary table in a dimensional model where the numerical performance measurements of the business are stored. The most useful facts are numeric and additive, such as dollar sales amount. There are three fundamental types of fact tables: transaction, periodic snapshot, accumulating snapshot and factless fact tables. All types serve a useful purpose. We often need two complementary fact tables to get a complete picture of the business [6], [7].
• Dimension Tables:
Dimension tables are integral companions to a fact table. The dimension tables contain the textual descriptors of the business. In a well-designed dimensional model, dimension tables have many columns or attributes. These attributes describe the rows in the dimension table. It is uncommon for a dimension table to have 50 to 100 attributes. Dimension tables tend to be relatively shallow in terms of the number of rows but are wide with many large columns. Each dimension is defined by its single primary key [6], [7].
• Conformed Dimension:
Conforming dimensions is a basic requirement in a data warehouse. Conformed dimensions are the dimension tables that are shared among fact tables. For dimensions to be conformed, make sure that common dimensions may be used between two or more fact tables deliberately [4].
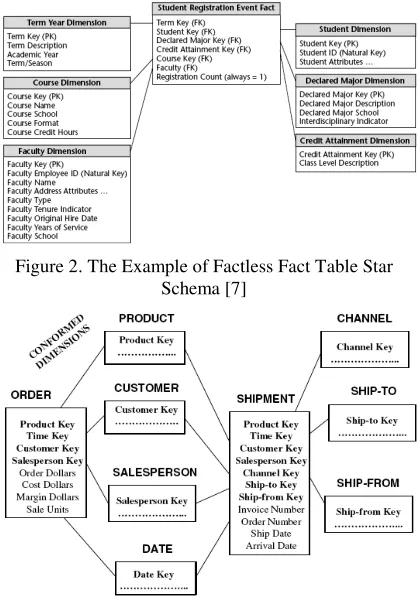
Figure 2. The Example of Factless Fact Table Star Schema [7]
Figure 3. The Example of Transaction Fact Table and Conformed Dimensions [4]
2.3
Online Analytical Processing (OLAP)
OLAP is the activity of interactively analyzing business transaction data stored in the dimensional data warehouse to make tactical and strategic business decisions. Typical people who do OLAP work are business analysts, business managers, and executives. Typical functionality in OLAP includes aggregating (totaling), drilling down (getting the details), and slicing and dicing (cutting the cube and summing the values in the cells). OLAP functionality can be delivered using a relational database or using a multidimensional database [8].
2.4.
Data Warehouse In Health Care
One of the key aspects of designing a healthcare data warehouse is finding the right scope for different levels of analysis. Analysis of healthcare outcomes is proposed to fine-scope studies of progress from one visit to the next treatment. These scopes allow the database to support multiple levels of analysis, which is imperative for healthcare decision making [1].
2.4
Six Steps To Build Medical Data
Warehouse
The six steps to build medical data warehouses [5]: • Identify the requirement for the building of the
data warehouse:
The developers should be able to convince the stakeholders that they have a sound solution for this critical requirement.
• Quality and scope of the sources:
Identify the quality and scope of each data source and also the rate of updating (depending on the dynamics of the entities to which the data refers).
• Identify what data is needed by the stakeholders: Match the potentially collectible data with the results that are desired by the stakeholders and the decision makers.
• Build an ontology:
In distributed environments, the denominators for data attributes and values can be different.
• How to update the central repository:
Establish the update policy for each local source and estimate the costs involved.
• Enact exception handling protocols.
The sources should be analyzed with the simplest
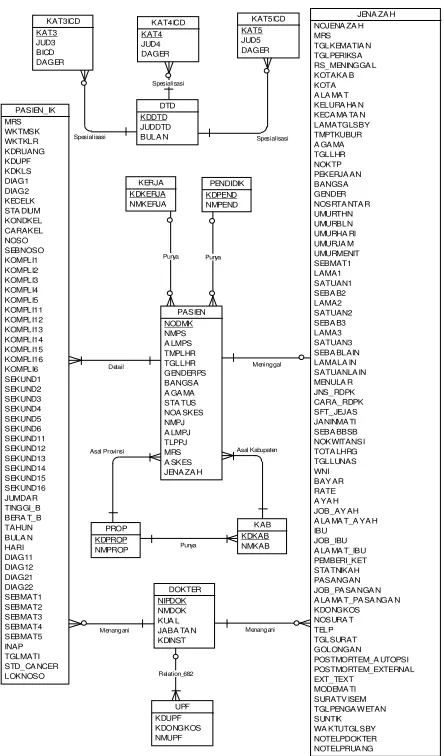
The disease track record RSU Dr. Soetomo skema data which is the data source for our research is shown in Figure 4.
Figure 4. Conceptual ERD of Disease Track Record Database RSU Dr. Soetomo
3
Star Schema Design
3.1
Requirements
• Discovering the treatment trends based on the disease type, such as: age and sex. For example, analyze the number of disease types in a period of time.
• Discovering the death trends based on time and disease type. For example, analyze the number of death in a period of time.
3.2
Star Schema
Base on the existing OLTP database can be designed two Fact Tables, i.e. Treatment Fact and Death Fact Tables. Both Fact Tables are designed as factless fact table because the fact happening of treatment and death are happened exactly only one time in the same time period. Both facts have no measurement metrics. By designing both facts as the factless fact tables can be able measured the following:
• How many treatments or deaths because of a disease in a period of time at a certain location.
Relation_682
• How many treatments that have been handled by certain doctor or how many death patients that handled by the doctor.
• etc.
There are many supporting attributes (dimensions) from both facts are same, therefore Star Scheme dimensions are designed as Conformed Dimensions. Figure 5 shows the designed Star Scheme ERD.
Figure 5. ERD of Treatment and Death Star Schema RSU Dr. Soetomo
4
OLAP Prototype Design
This prototype OLAP is created for testing the designed Star Scheme. It will be used as basic for further research that fund by PHB DIKTI Figure 6 shows a block diagram of the designed prototype OLAP.
Figure 6. OLAP Prototype Block Diagram There are two modules that exist in the designed prototype OLAP, i.e.:
• Extracting, Cleasing and Transforming Module: At this module, the existing data in Disease Track Record Database RSU Dr. Soetomo will be extracted. Furthermore the data will be cleaned from the damage data, by repaired or deleted them. At last the data will be transformed into the Star Scheme format. This process can be conducted repeatedly, especially if there are much new data. Therefore to minimize redundant data the transforming data must be validated.
• On-Line Analytical Processing Module:
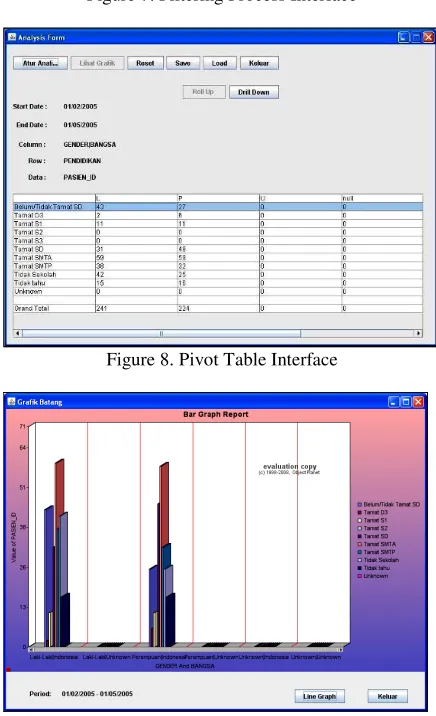
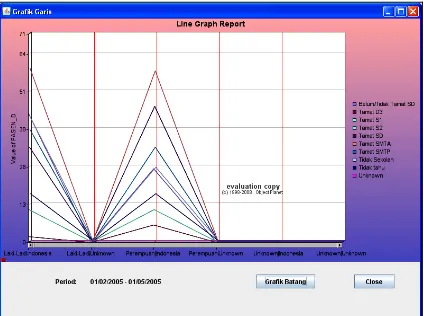
This Module produces a Pivot Table. The table is used to see and analyze dynamically the saved data on Star Scheme. From the produced Pivot Table can be further analyzed in a graph form, such as a bar or a line diagram. The content of Pivot Table can be saved to redisplay without having through filtering data process as mention. A user interface for filtering data process to generate a Pivot Table is shown in Figure 7. The generated Pivot Table is shown in Figure 8. Moreover, a Bar Diagram and a Line Diagram base on the Pivot Table data are shown in Figure 9 and Figure 10 respectively.
Figure 7. Filtering Process Interface
Figure 8. Pivot Table Interface
Detail Pasien Penyebab Kematian
Bentuk Diagnosa
Tanggal Meninggal Tanggal Keluar
Alamat Pasien
No Jenazah
Dokter yang Menangani Tanggal Keluar
Dokter yang Merawat
Bentuk Diagnosa Penyakit yang Diderita
Alamat Pasien Tanggal Masuk
Detail Penjaga Pasien
Detail Pasien
DIMENSI_PA SIEN PASIEN_ID PASIEN_NO PASIEN_ALA MA T TEMPAT_LA HIR TANGGA L_LAHIR GENDER BANGSA A GA MA PENDIDIKAN PEKERJA AN STA TUS NO_ASKES JENIS_A SKES
DIMENSI_DOKTER DOKTER_ID DOKTER_NO DOKTER_NA MA SPESIA LISA SI KUA LIFIKASI JABATA N INSTANSI
DIMENSI_JENAZAH JENA ZA H_ID TEMPAT_MENINGGA L UMUR LAMA
DIMENSI_TEMPA T TEMPAT_ID KABUPA TEN PROPINSI DIMENSI_PENJA GA
PENJAGA_ID PENJAGA_NAMA PENJAGA_A LA MA T PENJAGA_TELP
DIMENSI_WA KTU WA KTU_ID TANGGA L BULAN TAHUN KUA RTER MINGGU
DIMENSI_DIA GNOSA DIAG_ID DIAG_KODE DIAG_NA MA
BENTUK_DIA GNOSA BENTUK_ID BENTUK_NA MA
FAKTA_PERAWATA N MASUK
Figure 9. The Bar Diagram Example
Figure 10. The Line Diagram Example
5
Conclusion And Discussion
Base on an evaluation to the developed OLAP prototype, such as patient treatment fact, doctor who take care the patient, disease diagnose, and others, we conclude that the Star Scheme has well designed. It can accommodate the historical disease track record in another form without losing meaning and purpose for every data itself. Database base on the propose Star Scheme is ready used for further research to be conducted.
OLAP Application will be further developed for easy and flexible use. In addition, the data warehouse will be integrated with spatial information (GIS) application for visualization an epidemic disease at an area and also it’s spreading. This information will be useful if the same epidemic disease emerge at the area later.
Acknowledgement
This research is supported by Direktorat Jendral Pendidikan Tinggi, Departemen Pendidikan Nasional (110/SP2H/PP/DP2M/IV/2009) with title "Design and Development of Medical Record Data Warehouse Application System for Supporting RSU Dr. Soetomo Strategic Decisions".
References
[1] Bambang Parmanto, “A Framework for Designing a Healthcare Outcome Data Warehouse”, Perspectives in Health Information Management/AHIMA, Volume 2, No 5, 2005.
[2] Denise C. Ramick, “Data Warehousing in Disease Management Programs”, Journal of Healthcare Information Management, Volume 15, No 2. John Wiley & Sons, Inc., 2001.
[3] Departemen Kesehatan Republik Indonesia, Indikator Indonesia sehat 2010 dan pedoman penetapan
indikator provinsi sehat dan kabupaten/kota sehat, Departemen Kesehatan Republik Indonesia, Jakarta, 2003.
[4] Paulraj Ponniah, Data Warehousing Fundamentals: A Comprehensive Guide for IT Professionals, John Wiley & Sons, Inc., 2001.
[5] N. B. Szirbik and Pelletier C., “Six methodology steps to build medical data warehouses for research”, International Journal of Medical Informatics, Volume 75, Issue 9. 2006.
[6] Ralph Kimball and Joe Caserta, The Data Warehouse ETL Toolkit: Practical Technigues for Extracting, Cleaning, Conforming and Delivering Data,Wiley Publishing Inc., 2004.