THIS REPORT CONTAINS ASSESSMENTS OF COMMODITY AND TRADE ISSUES MADE BY USDA STAFF AND NOT NECESSARILY STATEMENTS OF OFFICIAL U.S. GOVERNMENT POLICY
Palm oil production is expected to increase from 38.5 million tons in 2017/18 to 40.5 million tons in 2018/19. Exports and stocks are forecast to increase. Harvested area is revised for 2008-2017 based on analysis of seed sales and seed trade data. Soybean imports are forecast up slightly to 2.85 million tons for 2018/19.
Garrett McDonald, Arif Rahmanulloh Chris Rittgers
Indonesia Oilseeds and Products Annual 2018
Oilseeds and Products Annual
Indonesia
Commodities: Oil, palm
Production
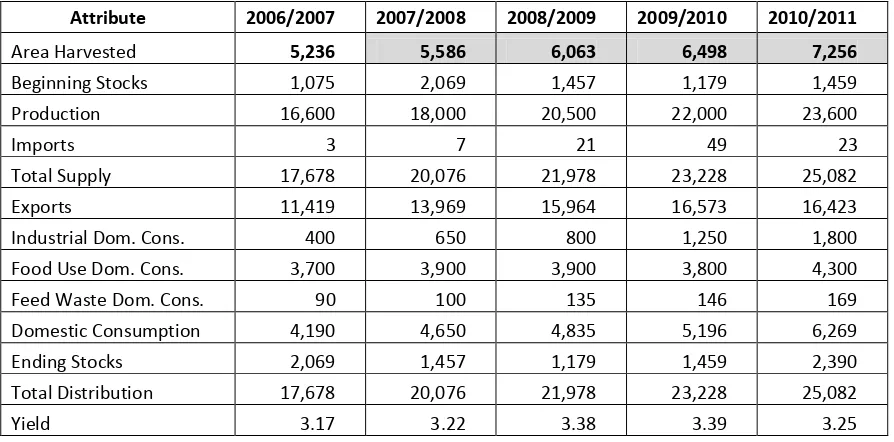
Based on expectations for trend yield growth and revised area, 2018/2019 palm oil production is forecast at 40.5 million tons, a 5 percent increase from 2017/2018. Total harvested area for 2008 – 2017 was revised based on seeds sales and seed trade data (Figures 1 and Table 1). Harvested area for 2018/2019 is forecast at 11.3 million hectares.
Figure 1 Indonesia seed sales, mature area and immature area
Source: industry contact, post calculation
Table 1 Revised PS&D Table --Updated Area Harvested 2008-2016
Attribute 2006/2007 2007/2008 2008/2009 2009/2010 2010/2011
Area Harvested 5,236 5,586 6,063 6,498 7,256
Beginning Stocks 1,075 2,069 1,457 1,179 1,459
Production 16,600 18,000 20,500 22,000 23,600
Imports 3 7 21 49 23
Total Supply 17,678 20,076 21,978 23,228 25,082
Exports 11,419 13,969 15,964 16,573 16,423
Industrial Dom. Cons. 400 650 800 1,250 1,800
Food Use Dom. Cons. 3,700 3,900 3,900 3,800 4,300
Feed Waste Dom. Cons. 90 100 135 146 169
Domestic Consumption 4,190 4,650 4,835 5,196 6,269
Ending Stocks 2,069 1,457 1,179 1,459 2,390
Total Distribution 17,678 20,076 21,978 23,228 25,082
2011/2012 2012/2013 2013/2014 2014/2015 2015/2016
Domestic Consumption 7,115 8,035 8,750 7,520 8,870
Ending Stocks 3,022 3,152 3,210 2,734 2,958
Total Distribution 28,590 31,560 33,679 36,218 34,734
Yield 3.25 3.38 3.40 3.47 3.14
Grey: revised
To revise the area, seed sales and seed import/exports from 2008 through 2017 were analyzed and it was assumed that an average 200 seeds per hectare were used, minus 25 percent nursery mortality, and less 1 percent planted mortality. The year 2008 was selected as the first year because it was that year that discrepancies between USDA data and other sources began to appear, and then the divergence became more pronounced post-2011.
Seed sales data suggests significant growth in area planted beginning in 2009, with total seed sales reaching 171 million seed in 2012. During these years, seed producers struggled to provide enough high- quality seeds as global prices for CPO increased seed demand beyond suppliers’ production capacity. As a result, many small holder farmers purchased “uncertified” seeds from local vendors. Some estimates place “uncertified” seeds at up to 20 percent of total seed sales during this period. The planting of underperforming seeds by small holder farmers during this period only exacerbated and already significant yield difference between small holder and large holder plantations. Additionally, a moratorium imposed on large holder plantations beginning in 2011 further incentivized area expansion to small holder plantations.
All these factors suggest an overall increase in area planted compared to previous estimates, especially for small holder farmers, and a corresponding decrease in average yield (Figure 2).
Figure 2. Yield: New Post estimate vs. DG of Estate
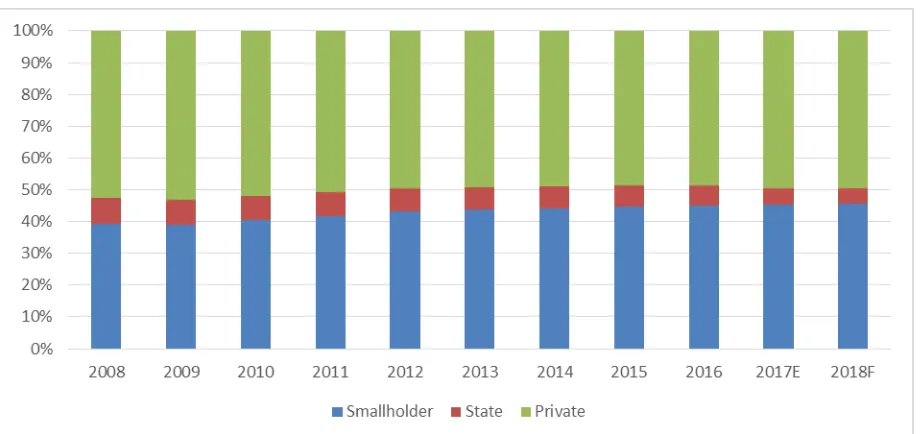
Indonesia’ palm plantations are divided between large holder plantations, state-owned plantations, and small holder farms (generally considered less than 25 hectares). Total area planted is divided among these groups at an estimated 52 percent, 7 percent and 41 percent respectively. Post-2011, large holder plantations have continued to grow, though at a slower pace, utilizing lands acquired prior to the moratorium. State-Owned plantations have generally remained stagnant.
Figure 3. Indonesia oil palm area 2008-2018F
Figure 4. DG of Estate, Post Mature and Immature Area
Source: DG of Estate (2017), Post calculation
Assuming replanting will be done for all 25 year-old palm trees, immature area is forecast to decline to 7 percent in 2021, before rebounding and increasing to 13 percent in 2024.
Consumption
In line with expectations for population growth and industrial demand, palm oil consumption is forecast to increase slightly to 9.48 million tons in 2018/19. Industrial consumption remains tied to biodiesel production with potential growth linked to policy expanding biodiesel subsidies. Details of an
expansion of subsidies to the non-Public Sector Obligation (PSO), or non-Public Transport Sector are still being debated.
Based on 2017 export data, Indonesia’s CPO fund collected more revenue in 2017 than the previous year, making it feasible to subsidize a larger biodiesel volume. The BPDPKS, the agency managing the CPO fund, states that during 2017 the agency collected IDR 14 trillion (~USD 1 billion), while the expenses (including biodiesel subsidy) reached IDR 10.3 trillion (~USD 757 million). The fund has accumulated IDR 11 trillion (~USD 808 million) since 2015.
If the replanting portion of the fund program reaches IDR 2.5 trillion (~USD 181 million), there would still be IDR 8.5 trillion (~USD 616 million) left for expanding the biodiesel program. This amount could cover up to 2.8 billion liters, assuming the subsidy (spread between biodiesel and diesel price) is set at IDR 3000. This calculation doesn’t include any funds being collected for 2018.
Unless/until a regulation is issued to expand the biodiesel mandate program beyond the PSO sector, biodiesel production is not expected to grow.
Trade
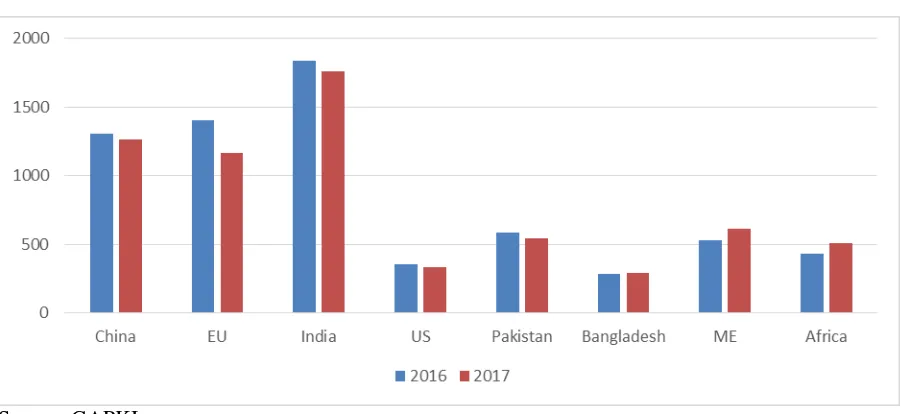
Based on a 4 percent slower pace of exports during October to December 2017, the 2017/18 palm oil export forecast is reduced to 27.5 million tons. Shipments to major destinations such as China, India and EU were 3, 4, and 17 percent lower, respectively (see Figure 5).
MY 2018/19
Based on 5 percent growth in demand from China, 3 percent from EU, 1.5 percent from India, and trend growth from other key markets, 2018/19 exports are forecast to reach 29.5 million tons.
Figure 5. Indonesia Palm oil and laurics exports October-December 2016 vs 2017 (thousand MT)
Source: GAPKI
Policy
A moratorium on the expansion of large plantations into peatlands and primary forest area was adopted in 2011. This initial moratorium applied primarily to large holder plantations and has likely contributed to the expansion of small holder farms. A new policy further limiting the expansion of oil palm
plantations was announced in April 2016 and has been circulated through various ministries for
approval. If enacted the new policy would halt all new permits for converting forest area to plantations and reclaim undeveloped (unplanted) area within concession permits.
Labor
Although Indonesia has yet to experience labor shortages in the palm oil sector on the scale of neighboring Malaysia, early signs of labor stress are noticeable, especially in regions such as
Kalimantan, where labor is already being provided by temporary workers from East Java and East Nusa Tenggara. As new planted area continues to shift towards eastern provinces, and urbanization attracts a better educated and younger workforce from traditional palm areas such as Northern Sumatera, labor shortages are likely to increase.
Production, Supply and Distribution Data Statistics
Indonesia USDA Official New Post USDA Official New Post USDA Official New Post
Assuming an oil extraction rate at 23 percent, fresh fruit bunch (FFB) production is estimated at 170 million tons in 2017/18 and 179 million tons in 2018/19. Palm kernel (PK) production is estimated at 6 percent of total FFB weight; therefore, PK production is forecast to reach 10.2 million tons in 2017/18 and 10.6 million tons in 2018/19.
Consumption
Palm kernel crush is forecast at 10.5 million tons in 2018/19, 400,000 tons higher than 2017/18.
Trade
Post expects PK exports stable at 10,000 tons for 2017/18 and 2018/19.
Production, Supply and Distribution Data Statistics
Oilseed, Palm Kernel 2016/2017 2017/2018 2018/2019 Market Begin Year Oct-16 Oct-17 Oct-18
Indonesia USDA Official New Post USDA Official New Post USDA Official New Post
Feed Waste Dom. Cons. 70 70 80 75 0 80
Based on expected 10.1 million tons of palm kernel to be crushed in 2017/18 and 10.5 million tons in 2018/19, estimates palm kernel oil production is forecast to reach 4.35 million tons in 2017/18 and 4.5 million tons in 2018/19.
Consumption
Industrial sector palm kernel oil consumption is expected to increase to 2.2 million tons in 2018/19, a 100,000 ton increase over 2017/18. This growth is possible given expected ample supplies and industrial expansion in oleo-chemicals.
Trade
Palm kernel oil exports are expected to increase from 1.85 million tons to 1.9 million tons in 2018/19, based on the competitive price forecast.
Production, Supply and Distribution Data Statistics
Oil, Palm Kernel 2016/2017 2017/2018 2018/2019 Market Begin Year Oct-16 Oct-17 Oct-18
Indonesia USDA Official New Post USDA Official New Post USDA Official New Post
Assuming a palm kernel crush yield of 52 percent, palm kernel meal (PKM) production is estimated to reach 5.5 million tons in 2018/19.
Consumption
Palm kernel meal consumption is tied to ruminant feed consumption. However, due to logistical constraints, palm kernel consumption is forecast to reach only 650,000 metric tons in 2018/19.
Trade
More than 90 percent of palm kernel meal is exported. Palm kernel meal exports are estimated to be 4.7 million tons in 2017/2018, based on the pace of shipments today. Exports for 2018/19 are forecast to reach 4.9 million tons due to expected ample supplies and competitive prices.
Production, Supply and Distribution Data Statistics
Meal, Palm Kernel 2016/2017 2017/2018 2018/2019 Market Begin Year Oct-16 Oct-17 Oct-18
Indonesia USDA Official New Post USDA Official New Post USDA Official New Post
Crush 9380 9380 10100 10100 0 10500
Soybean production is forecast to decline from 540,000 tons in 2017/18 to 520,000 tons in 2018/19. The continuing decline is the result of farmers’ preference for planting more lucrative crops, including rice and corn. Government policy establishing a minimum price for corn has added incentive for risk-averse farmers, while policies restricting imports for both corn (for feed use) and rice have resulted in higher prices for farmers (and in turn consumers).
Soybeans are still considered a secondary crop, often planted as a third crop between rice plantings. In several regions soybean plantings also compete with mung beans which also provide better returns for farmers. Despite GOI efforts to dramatically increase soybean production, these efforts have been unsuccessful.
Soybeans use for food products is expected to continue to increase with population growth. Soybean
consumption for the feed sector is expected to continue to increase as well due to the use of full fat soybeans as a feed component. Feed use for 2017/18 at 160,000 tons and at 170,000 tons for 2018/19 is maintained.
Trade
Soybean imports are forecast to reach 2.85 million tons in 2018/19, driven by population growth that fuels demand in the food sector.
Production, Supply and Distribution Data Statistics
Oilseed, Soybean 2016/2017 2017/2018 2018/2019 Market Begin Year Oct-16 Oct-17 Oct-18
Indonesia USDA Official New Post USDA Official New Post USDA Official New Post
Area Planted 480 480 450 470 460
Indonesia does not produce any soybean meal. All soybean meal is imported.
Consumption
Fueled by continued growth in the broiler sector, Indonesia’s feed industry continues to grow, and soybean meal consumption is forecast to reach 4.6 million tons in 2018/19, 150,000 tons higher than in 2017/18. The feed industry expansion is being driven by increased demand for processed meat products, and the broiler average growing period increasing from 28-30 days to 32-35 days. Indonesia’s per capita meat consumption remains low, which portends further growth.
Trade
Soybean meal imports are expected to reach 4.5 million tons in 2018/19. More than 90 percent of imported comes from Brazil and Argentina due to price competitiveness compared with US origin meal.
Production, Supply and Distribution Data Statistics
Market Begin Year Oct-16 Oct-17 Oct-18
Copra production is forecast to reach 1.42 million metric tons in 2018/19, a slight decrease from 1.45 million metric tons in 2017/18. Coconut plantations continue to decline as result of the land conversions and low profitability. The majority of coconut plantations are owned by smallholder farmers with less intensive maintenance practices, resulting in lower yields.
Consumption
The coconut oil (CNO) industry is the main consumer of copra. The CNO industry is forecast to consume 1.39 million metric tons of copra in 2018/19, a decline from 1.42 million metric tons in 2017/18, due to lower overall production.
Trade
Small amounts of copra were exported to destinations such Bangladesh and the Philippines. Copra exports are forecast to be stable at 25,000 tons for 2018/19.
Production, Supply and Distribution Data Statistics
Oilseed, Copra 2016/2017 2017/2018 2018/2019 Market Begin Year Oct-16 Oct-17 Oct-18
Indonesia USDA Official New Post USDA Official New Post USDA Official New Post
Total Dom. Cons. 1555 1555 1563 1425 0 1395
Based on copra production trends, coconut oil (CNO) production is forecast to decrease to 890,000 tons in 2018/19, crushed from 1.39 million tons of copra.
Consumption
CNO consumption for food and industrial use and industrial minimal, with the oleo-chemical industry being the largest consumer. The sectors prefer lower-priced palm-based products. CNO domestic consumption is forecast to be stable at 385,000 tons in 2017/18 and 2018/2019.
Trade
CNO exports are forecast to reach 550,000 tons both in 2017/18 and 2018/19. Major destinations of CNO exports were U.S., China and Netherlands.
Production, Supply and Distribution Data Statistics
Oil, Coconut 2016/2017 2017/2018 2018/2019 Market Begin Year Oct-16 Oct-17 Oct-18
Indonesia USDA Official New Post USDA Official New Post USDA Official New Post
Crush 1550 1550 1558 1420 0 1390
Based on decreasing crushed copra volumes, copra meal (CM) production is expected to decline from 480,000 tons in 2017/18 to 470,000 tons in 2018/19.
Consumption
Trade
Based on October to December 2017 trade data, copra meal exports are forecast to reach 250,000 tons in 2017/18. About 97 percent of Indonesia copra meal was shipped to South Korea and India during 2016/17.
Production, Supply and Distribution Data Statistics
Meal, Copra 2016/2017 2017/2018 2018/2019 Market Begin Year Oct-16 Oct-17 Oct-18
Indonesia USDA Official New Post USDA Official New Post USDA Official New Post
Crush 1550 1550 1558 1420 0 1390
Peanut production is forecast to decline from 1.075 million tons in 2017/18 to 1.06 million tons in 2018/19. Area is declining due to urbanization and infrastructure development. This situation is exacerbated by the current agricultural policy preference for planting rice and corn.
Consumption
Human consumption falls into three categories: traditional, snack foods and confectionary. In traditional markets, peanuts are used as condiments and sauces. The snack food industry prefers smaller peanut size, which is needed for fried coating applications. Each group requires different specifications as follows:
Market group Specification Estimate Market Share
Traditional 80/90 peanuts per ounce 70 percent
Snack food Small round shape, 140/160 peanut per ounce 20 percent
Confectionary 60/70 peanut per ounce 10 percent
Source: Post / Industry Contacts
Peanut consumption is not expected to grow.
Trade
Import duties for peanut (HS code 1202) is set at 5 percent. However, ASEAN Trade in Goods Agreements eliminates import duties among members.
Production, Supply and Distribution Data Statistics
Oilseed, Peanut 2016/2017 2017/2018 2018/2019 Market Begin Year Jan-17 Jan-18 Jan-19
Indonesia USDA Official New Post USDA Official New Post USDA Official New Post
Area Harvested 600 600 590 580 0 570
Beginning Stocks 84 84 87 87 0 82
Production 1120 1120 1100 1075 0 1060
MY Imports 300 300 310 320 0 320
Total Supply 1504 1504 1497 1482 0 1462
MY Exports 7 7 8 5 0 5
Crush 50 50 50 50 0 50
Food Use Dom. Cons. 1280 1280 1280 1270 0 1260
Feed Waste Dom. Cons. 80 80 75 75 0 75
Total Dom. Cons. 1410 1410 1405 1395 0 1385
Ending Stocks 87 87 84 82 0 72
Total Distribution 1504 1504 1497 1482 0 1462