Washington’s
Water Quality Management Plan
to Control Nonpoint Sources of Pollution
FINAL
June 2005
Washington’s
Water Quality Management Plan
to Control Nonpoint Sources of Pollution
FINAL
June 2005
Authors
William A. Hashim Helen Bresler
For additional copies of this document contact: Department of Ecology
Publications Distribution Center P.O. Box 47600
Olympia, WA 98504-7600 Telephone: (360) 407-7472
Adams
TTY (for the speech and hearing impaired) statewide is 711 or 1-800-833-6388
Regional
The Department of Ecology is an equal opportunity agency and does not discriminate on the basis of race, creed, color, disability, age, religion, national origin, sex, marital status, disabled veteran's status, Vietnam Era veteran's status, or sexual orientation.
The Nonpoint Plan
This plan has been a cooperative effort of the following agencies:
Department of Agriculture
Department of Community, Trade and Economic Development Conservation Commission
Washington State University, Cooperative Extension Department of Ecology
Department of Fish and Wildlife Department of Health
Department of Natural Resources Parks and Recreation Commission Puget Sound Action Team
Department of Transportation
These agencies will also be implementing the actions identified in the plan.
Acknowledgements
This plan has taken the effort of many people and agencies. Thanks goes to Washington State Nonpoint Source Workgroup: Kirk Cook, Department of Agriculture; Stu Trefry from the Conservation Commission; Chris Parsons, Community Trade and Economic Development; Bob Simmons, WSU Cooperative Extension; Selden Hall, Department of Health; Carol Walters, Department of Natural Resources, Chris Regan, Parks and Recreation Commission; Harriet Beale, Puget Sound Action Team; Tim Hilliard, Department of Transportation.
Washington's Nonpoint Source Management Plan
Volume 3
Table of Contents
Executive Summary ... vii
Chapter 1 A Summary of Water Quality in Washington State... 1
Introduction... 1
Population Growth ... 1
High level of development... 3
Forest Cover... 3
Land Use and Nonpoint Source Pollution ... 3
What is the Quality of Washington State’s Water? ... 5
Water Quality Assessment... 5
Ecology’s Water Quality Index ... 6
Chapter 2 The Nonpoint Problem ... 9
Lessons Learned from Five Years of Implementation... 9
The Way We Use the Land... 9
The Impacts of Land Use Practices ... 10
Forest Practices ... 10
Background ... 10
Water Quality Impacts from Forest Practices... 14
Impacts on Designated Uses ... 16
Impacted Designated Uses from Forest Practices... 16
Agriculture ... 16
Background ... 16
Water Quality Impacts from Agriculture... 17
Impacts on Designated Uses ... 19
Impacted Designated Uses from Agriculture... 19
Urban/Suburban Growth... 20
Background ... 20
Water Quality Impacts from Urban/Suburban Sources ... 22
Impacted Designated Uses from Urban/Suburban pollution ... 23
Recreation ... 24
Background ... 24
Water Quality Impacts from Recreational Activities... 26
Impacted Designated Uses from Recreational Activities ... 27
Habitat Alteration... 27
Background ... 27
Water Quality Impacts from Loss of Aquatic Ecosystems... 29
Chapter 3 Being in a State of Clean Water ... 33
The Objectives of this Water Quality Plan are: ... 33
How Will We Achieve These Objectives? ... 36
Chapter 4 Roles in Implementation: Water Quality Partners: Working with Local, State, Tribal, and Federal Agencies... 37
Local Governments... 37
Local Government Implementation Activities... 38
Washington State Agencies ... 38
Washington State Agency Nonpoint Workgroup ... 40
State Agency Implementation Table... 41
Chapter 5 Activities and Milestones ... 47
Outputs vs. Outcomes ... 47
Joint Legislative Audit Review Committee... 47
Federal Office of Management and Budget (OMB) ... 48
Outcome Performance Measures ... 49
Activities Table... 49
Through these Agriculture Activities... 51
Chapter 6 Nonpoint Water Quality Monitoring... 65
Chapter 7 Implementation Strategy ... 67
Implementation Strategy for Local Governments... 67
Grants and Loans ... 67
Technical Assistance... 69
Enforcement... 69
Implementation Strategy for State Agencies ... 69
Federal Grants... 70
Progress Review... 71
Five Years from Now... 71
References... 73
List of Figures and Tables
Figure 1.1 Washington State Population Trend... 1
Figure 1.2 2000 Census Block Population Density of Washington State... 2
Table 1.1 Land cover changes from 1991 - 1999 ... 3
Figure 1.3 Land Use Changes in Washington State ... 4
Figure 1.4 Numbers of Listings for Nonpoint Pollutants, 2004 ... 6
Figure 1.5 Water Quality Index Status of Washington State Waters ... 7
Figure 2.1 Land Use Categories... 10
Figure 2.2 Forest Land Ownership inWashington Stat... 11
Figure 2.3 Agricultural Land Use 2002 ... 17
Figure 2.4 Number of Farms in 2002 ... 17
Figure 2.5 Leading sources of river and stream impairment ... 18
Table 2.1 Population Covered Under Stormwater Permits... 22
Figure 2.6 Participation in General Recreation Categories as a Percent of State Population... 26
Table 2.2 Pollutants generated by different land uses ... 31
Table 4.1 Washington State Agency Nonpoint Workgroup ... 40
Table 4.2 Matrix of Agency Nonpoint Responsibilities ... 44
Abbreviations and Acronyms
Abbreviation
Agency, Organization or Program
AFO, CAFO Animal Feeding Operation, Concentrated Animal Feeding Operation
AGC Associated General Contractors BMPs Best Management Practices
CC Washington State Conservation Commission
COE US Army Corps of Engineers
CCWF Centennial Clean Water Fund
CERCLA Comprehensive Environmental Response, Compensation, and Liability Act (Superfund)
CIDMP Comprehensive Irrigation District Management Plan CRAB Washington State County Roads Administration Board CREP Conservation Reserve Enhancement Program (State) CRP Conservation Reserve Program (Federal)
CSP Conservation Security Program
CTA Conservation Technical Assistance
CWA Clean Water Act
CZARA Coastal Zone Management Act Reauthorization Amendments of 1990
DCTED, CTED Washington State Department of Community, Trade and Economic Development
DFW, WDFW Washington State Department of Fish and Wildlife DNR Washington State Department of Natural Resources DOH, Health Washington State Department of Health
ECY, Ecology Washington State Department of Ecology EPA, US EPA US Environmental Protection Agency EQIP Environmental Quality Incentives Program
FFR Forests and Fish (Report)
ESA Endangered Species Act
FSA Farm Services Agency
GMA Growth Management Act
HCP Habitat Conservation Plan
HPA Hydraulic Project Approval
HUC Hydraulic Unit Code
IAC Washington State Interagency Committee for Outdoor Recreation
LLP Landowner Landscape Plan
MOA, MOU Memorandum of Agreement, Memorandum of Understanding NALMS North American Lake Management Society
NMFS National Marine Fisheries Service
Abbreviation
Agency, Organization or Program
NPS Nonpoint Source (pollution)
NRCS Natural Resources Conservation Service (USDA) NWMTA Northwest Marine Trade Organization
OSPI Washington Office of the Superintendent of Public Instruction Parks Washington State Parks & Recreation Commission
PSAT Puget Sound Action Team
RCRA Resource Conservation Recovery Act SEPA State Environmental Policy Act
SMA Shoreline Management Act
SRA Salmon Recovery Act
SRO Salmon Recovery Office
TFW Timber Fish and Wildlife (replaced by FFR – Forests and Fish)
TMDL Total Maximum Daily Load Tribes Indian Tribes of Washington USDA US Department of Agriculture USFS US Forest Service
USFWS US Fish and Wildlife Service USGS US Geological Survey
UW University of Washington
WACD Washington Association of Conservation Districts WALPA Washington Lake Protection Association
WHIP Wildlife Habitat Incentives Program
WPA Watershed Planning Act
WRAS Watershed Restoration Action Strategy WRIA Watershed Resource Inventory Area
WSDA Washington State Department of Agriculture WSWSDOT Washington State Department of Transportation
WSGP, UW Washington Sea Grant Program, University of Washington
Executive Summary
Even though Washington State has been working on controlling nonpoint sources of pollution for many years, it has only been in the last five that a comprehensive focused approach was developed. Prior to that, controlling point sources of pollution was a priority for the Department of Ecology and other state agencies. It was assumed that reducing polluted flows that came out of the end of a pipe would go a long way to solve our water quality problems. It did, but another source of pollution then became more obvious.
After a majority of point source discharges were controlled, Washington still suffered from water quality degradation. What were these other causes of water quality problems? They were nonpoint sources of pollution. Federal and state environmental agencies have long realized that controlling these sources requires a different approach than controlling point sources. Why? Because nonpoint pollution is inextricably tied to local land uses and individual actions.
Washington’s first statewide Water Quality Plan to Control Nonpoint Source Pollution was published in April 2000. In that plan, the state obligated itself to update the nonpoint every five years by analyzing programs and progress in achieving plan results. This rewrite of the nonpoint plan recognizes the problem of trying to manage local land uses and individual actions from the state’s perspective. State agencies recognize that compliance with the Clean Water Act is a mutual effort with the local jurisdictions and the public. Thus, the distinguishing characteristic of this plan is to support sustainable communities through the creation and preservation of relationships with local entities. This plan recognizes the role that local governments play in water quality improvements and the importance of public participation in understanding and addressing nonpoint pollution.
This plan does not capture every activity the state performs to address nonpoint pollution problems. For instance, it does not contain lengthy descriptions of existing programs, such as Ecology’s invasive aquatic weeds program or stormwater permit program, and make recommendations about how they should proceed. Instead, the plan focuses on areas where no programs are in place or where state agency efforts can help to make a difference.
Chapter 1
A Summary of Water Quality in Washington State
The land ethic simply enlarges the boundaries of the community to include soils, waters, plants, and animals, or collectively: the land. Leopold, 1948
Introduction
This introduction is a summary of Volume 1 of the nonpoint plan, which contains information for each of the 62 Water Resource Inventory Areas (WRIAs) of Washington State. The purpose of this summary is to identify statewide problem areas and to identify the reasons for water quality problems.
The summary for each WRIA contains demographic information, 303(d) listed problem areas, a list of impacted designated uses, and the programs and plans in place to control nonpoint sources of pollution. Information has been compiled and synthesized into a series of problem statements describing the nonpoint pollution problems we have identified. Washington State agencies can use this information to understand the range and extent of water quality degradation, to help determine priority areas, and to develop projects and programs needed to solve those problems.
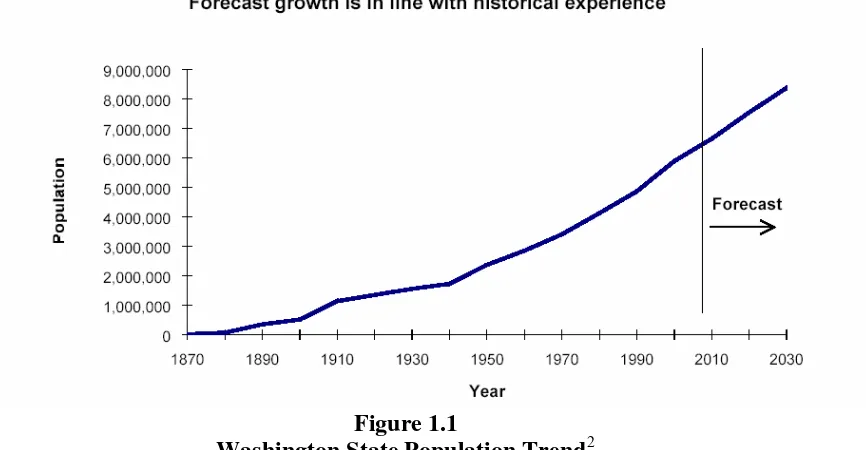
Population Growth
The most startling change in demographics is the growth in population in the last five years (see Figure 1.1). The largest change from 1990 to 2004 is the growth of urban areas.
Figure 1.1
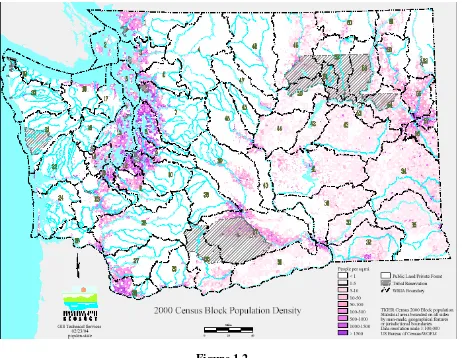
There are three areas in Washington that are exhibiting large population growth (Figure 1.2). • Communities along the I-5 corridor through the Puget Sound area and south into the
Vancouver area.
• Along I-82, from Yakima into the Tri-cities. • The Spokane area.
Other areas are also exhibiting strong population growth, but do not have as large a growth factor as these three areas. During the 1990s, an average of about 130,000 people moved into the state each year. That, combined with increased birth rate, forced an increase in construction and development. Most of this growth originally centered in urban districts associated with metropolitan Puget Sound, the I-5 Corridor, the I-82 corridor, and the Spokane area. More recently, however, growth has spread throughout the state, with rates ranging from 0.3 percent annual growth in the rural southeastern part of the state, to 5 percent growth in Clark County. The growth in Clark County is more than double the statewide rate of 2.3 percent.
Figure 1.2
What does population growth have to do with nonpoint source pollution? Simply stated, a major factor is the increase of impervious surfaces associated with increases in housing, roads, and business areas. When pavement, roofs, and other hard surfaces replace forests, meadows, and other natural areas they generate stormwater runoff. Stormwater runoff picks up oils, grease, metals, yard and garden chemicals, dirt, bacteria, nutrients, and other pollutants from paved areas, and carries them to streams, rivers, wetlands, and other water bodies.
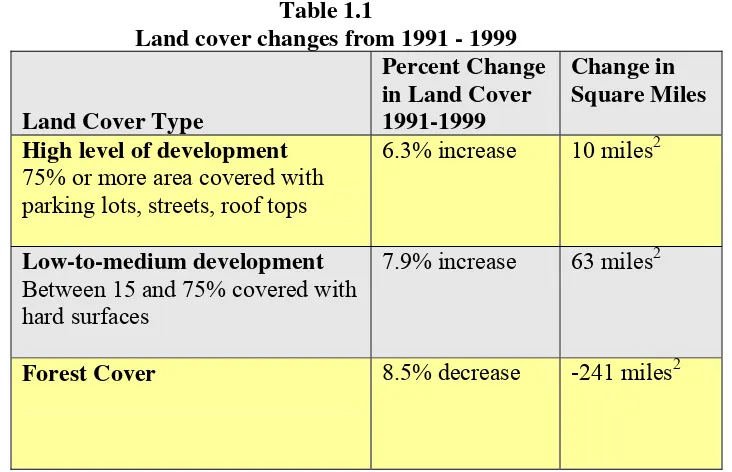
The current State of the Sound Report, 2004, documented the increase in impervious surfaces within the Puget Sound Region. The following table shows land cover changes from 1991-1999.
Table 1.1
Land cover changes from 1991 - 1999
Land Cover Type
Percent Change in Land Cover 1991-1999
Change in Square Miles
High level of development 75% or more area covered with parking lots, streets, roof tops
6.3% increase 10 miles2
Low-to-medium development Between 15 and 75% covered with hard surfaces
7.9% increase 63 miles2
Forest Cover 8.5% decrease -241 miles2
Land Use and Nonpoint Source Pollution
Nonpoint pollutants are introduced into water through runoff. Rainfall and snow melt wash pollutants from the land into rivers, streams, lakes, oceans, and underground aquifers. Land use is strongly correlated to nonpoint pollution. Therefore, to manage nonpoint pollution, we must focus on land use activities.
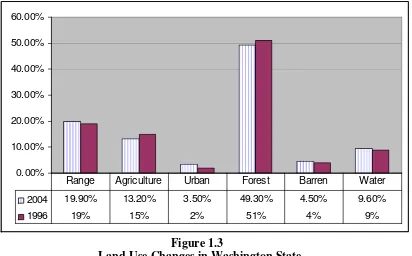
The intensity of environmental impact from each land use differs. For example, urban districts, making up about 3.5 percent of the land base, are generally under the highest environmental stress. On the other hand, park areas, with far more land area in the state, cause minor
Figure 1.3
Land Use Changes in Washington State
However, nonpoint source problems associated with land uses vary from none to very extensive, depending upon location and control programs in place. It is interesting to note that the land use that covers the smallest land area (urban areas) may pose the greatest threat to surface water quality by means of stormwater runoff.
The major sources of nonpoint pollution can be divided into the following categories.
Categories
Associated
Land
Uses
Agriculture Livestock keeping; dryland and irrigated crops; grazing; non-commercial agriculture
Forest Practices Road construction and maintenance; harvesting; chemical applications.
Urban/Suburban Growth Stormwater runoff; on-site sewage systems; hazardous materials; construction and maintenance of roads and bridges; residential use of fertilizers and pesticides.
Habitat Alteration Filling of wetlands and alteration of riparian areas; shoreline development, stream channelization, dikes, dredging, riprap, and dams.
Recreation Marinas and boats, off-road vehicles.
0.00% 10.00% 20.00% 30.00% 40.00% 50.00% 60.00%
2004 19.90% 13.20% 3.50% 49.30% 4.50% 9.60%
1996 19% 15% 2% 51% 4% 9%
What is the Quality of Washington State’s Water?
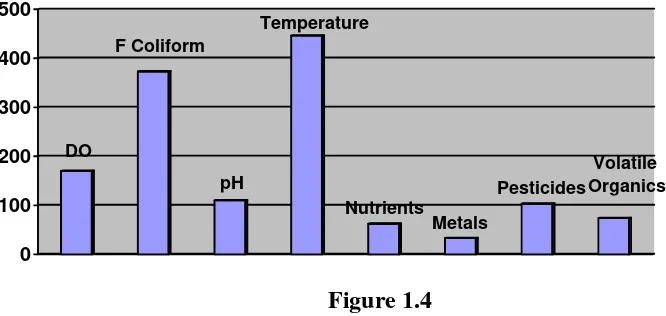
Water Quality AssessmentAccording to the draft 2004 Water Quality Assessment, the most common water pollution problems in Washington are high temperature, fecal bacteria, pH, low dissolved oxygen, metals, and nutrients. Most of these problems are caused by nonpoint source pollution, which is the primary source of pollution in rivers, lakes, and ground water. Although the state has fewer monitoring programs focused on toxic pollutants, we suspect that they are also a problem.
Ecology’s primary means of reporting on the status of water quality is through the development of an integrated water quality monitoring and assessment report, based on EPA’s 2002
Integrated Water Quality Monitoring and Assessment Report Guidance (November 2001). Washington State's Water Quality Assessment satisfies Clean Water Act requirements for both Section 305(b) water quality reports and Section 303(d) lists. Ecology’s Water Quality Program has adopted Policy 1-11 that describes the methods used for assessing information to evaluate attainment of water quality standards. The policy includes criteria for compiling, analyzing, and integrating data on ambient conditions with project implementation information. The policy describes how the state integrates data from numerous sources, collected for a variety of purposes under a variety of quality control practices. Washington State's Water Quality Assessment places waterbody segments into one of five categories. All waters in Washington (except on reservation lands) fall into one of the five categories, which describe the status of water, from clean to polluted. Washington State's Water Quality Assessment may be found on Ecology's website4 athttp://www.ecy.wa.gov/programs/wq/303d/2002/2002-index.html
The typical pollutants from nonpoint sources and their relative frequency of detection in
Washington are shown in Figure 1.4. It should be noted that the water quality assessment is not a full accounting of the water quality problems in Washington. There are still many water bodies that have not yet been monitored.
DO
F Coliform
pH
Temperature
Nutrients Metals
Pesticides
Volatile Organics
0 100 200 300 400 500
Figure 1.4
Numbers of Listings for Nonpoint Pollutants, 2004
Although not listed in the chart as commonly found pollutants, toxics are an issue here in Washington. Contaminants of increasing concern include polychlorinated biphenyls (PCBs), chlorinated pesticides, polychlorinated dibenzo-p-dioxins and polychlorinated dibenzo-p-furans (PCDD/Fs), and mercury. The accumulation of these chemicals can result in various health effects on humans and wildlife such as reproductive abnormalities, neurological problems, and behavioral changes. Many of these contaminants in our environment are classified persistent, bioaccumulative, and toxic compounds (PBTs). This means that they last a long time in the environment, tend to accumulate in the tissues of living organisms, and can cause diseases or other disorders in humans, animals, or plants. In the 2004 legislative session, Ecology was directed to establish, through rule, specific criteria for use in identifying PBTs that pose human health or environmental impacts in Washington, and a clear process for developing chemical action plans to address those impacts. The draft rule has been released for public comment, and the rule is expected to be final in fall of 2005. For more information on the draft rule and Ecology’s other work on toxic pollutants, please see the Ecology PBT strategy website at http://www.ecy.wa.gov/programs/eap/pbt/pbtfaq.html
Ecology’s Water Quality Index
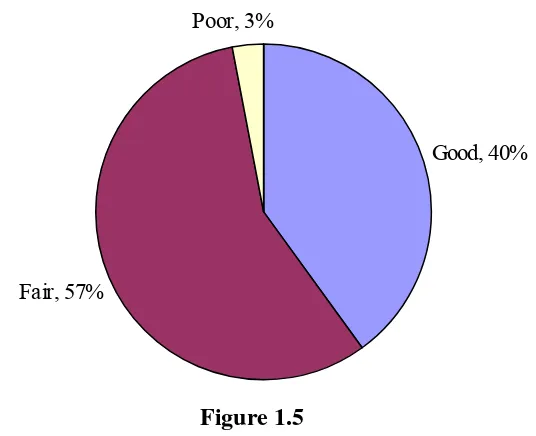
Ecology's stream monitoring Water Quality Index (WQI) attempts to answer non-technical questions about water quality by creating a long-term trend analysis at a regional scale. The index represents both point and nonpoint sources of pollution. It is a unitless number ranging from one to one hundred; a higher number indicates better than expected water quality. In general, stations scoring 80 and above met expectations for water quality and are of "lowest concern," scores 40 to 80 indicate "marginal concern," and water quality at stations with scores below 40 did not meet expectations and are of "highest concern." The WQI may not be
consistent with Ecology’s 303(d) listing because the WQI and the 303(d) analyses use different data sources, assess different pollutants, occur during different time periods, and use different evaluation techniques. The WQI does not cover every waterbody and focuses primarily on conventional pollutants.
Ecology’s water quality index can be found at
Figure 1.5
Water Quality Index Status of Washington State Waters
Good, 40%
Fair, 57%
Chapter 2
The Nonpoint Problem
A thing is right when it tends to preserve the integrity, stability, and beauty of the biotic community. It is wrong when it tends otherwise. Leopold, 1948
Chapter 1 summarized demographic and environmental information from Volume 1of the nonpoint plan–Water Quality Summaries of Watersheds of Washington State5. The summary showed obvious problems associated with the causes and control programs for nonpoint source pollution. When Washington’s first nonpoint plan was written in 1990, equal emphasis was placed on all the potential sources of nonpoint pollution: agriculture, forestry, urban areas, recreation, and loss of aquatic ecosystems (including hydromodification). However, after five years of program implementation, coordination of activities, biennial meetings of the state agency nonpoint workgroup, and looking at nonpoint problems with a critical eye, problem areas, some more apparent than others, have appeared.
Lessons Learned from Five Years of Implementation
Nonpoint source pollution is linked to local land uses and individual actions. In order to control water quality impairments resulting from nonpoint sources of pollution, we need to continue efforts to understand the connections that land use activities have to water quality and to make sure that citizens understand them, too. We also need to coordinate closely with local
governments and other groups. This is the only way we can effectively achieve water quality improvements, create sustainable communities, and maintain the environment that benefits all of us.
From the past five years of implementing this plan, we learned that it takes time and effort to coordinate implementation activities among the various responsible entities. We learned that state and federal agencies need to work more closely with local governments to effectively implement nonpoint programs. Thus, creating, sustaining, and improving relationships among federal, state, and local entities will be a hallmark effort during this next five years.
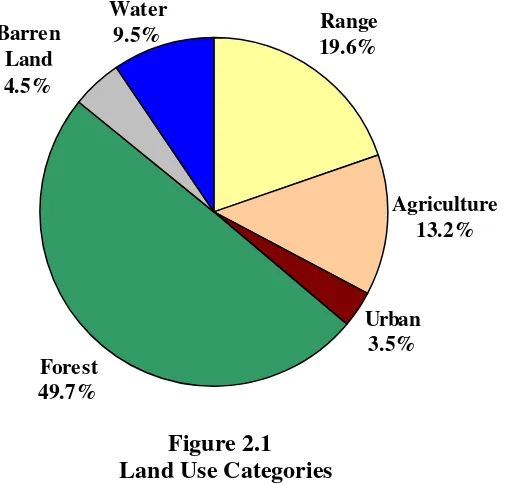
The Way We Use the Land
The way land is used is the major contributing factor to nonpoint source pollution. The following chart shows the relative geographic area covered by the different land uses in
Figure 2.1 Land Use Categories
The second largest land use category is agriculture (which includes rangelands). Nutrients from dairies and other livestock operations are regulated through livestock nutrient management programs that are currently co-administered by the Washington Department(s) of Agriculture and Ecology. These programs work to protect water quality from livestock nutrient discharges through the combination of clear guidance, education, and technical assistance, as well as
through coordination with related agencies, industry, and other stakeholders. However, there are no state regulations that deal systematically with other agricultural practices as there are for forest practices.
The land use that had the largest growth in the last five years is urban use. Even though it has the smallest land base, urban uses cause the greatest impacts. It has been evident for some time that urban and suburban development cause serious water quality problems Because of the increased area covered by impervious surfaces and the concentration of people whose individual actions can contribute nonpoint pollution.
There is still concern with recreational activities, especially boats and marinas, as contributors to water quality impairment, and there is concern with the loss of aquatic habitat. Intact riparian areas and wetlands are essential for treating stormwater runoff before it enters a water body. However, let us first look at how land use practices lead to water quality impairments.
The Impacts of Land Use Practices
Forest Practices
BackgroundWashington’s forests provide abundant resource benefits, such as wood products, fish and wildlife habitat, clean air and water, opportunities for outdoor recreation, and natural beauty.
Agriculture 13.2% Range
19.6%
Urban 3.5% Barren
Land 4.5%
Forest 49.7%
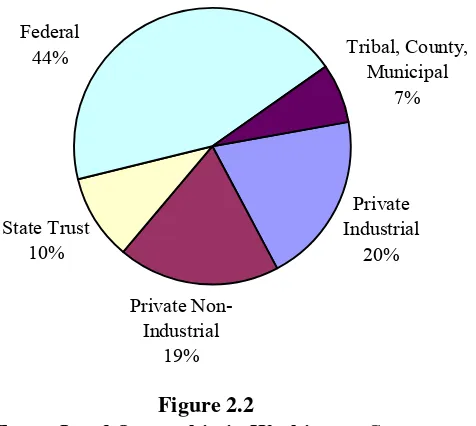
The forest products industry is the third largest industry in Washington. Over 22 million acres of private, state, and federal lands are managed for a myriad of objectives, including commercial timber production. The following chart shows the diversity of forestland ownership in
Washington State (Figure 2.2).
Figure 2.2
Forest Land Ownership in Washington State Private Industrial
20%
Private Non-Industrial
19% State Trust
10% Federal
44% Tribal, County,
Municipal 7%
Source: Washington Forest Protection Association, FYI, 20036
Figure 2.2 Forest Land Ownership inWashington State
Many land management strategies address the challenges of protecting water quality and maintaining aquatic species on forest lands. Plans that benefit fish habitat and water quality in Washington include large, multi-state federal forest management plans, state and private landowner habitat conservation plans, recovery plans being developed through the coordinated efforts of regional organizations, growth management and local watershed planning, and individual conservation and management efforts. These conservation plans and protection strategies continue to improve salmon habitat and water quality and put listed species—including salmonids, wildlife, and plants—on a positive path toward recovery in Washington. The
management, conservation, and preservation strategies work together to protect and enhance natural resources and also to help conserve the forestland base and prevent its conversion to non-forest uses.
Forest Practices Rules
reforestation, brush control, and use of fertilizers or pesticides. All of these forest practices have the potential to affect water quality. The rules contain an array of best management practices designed to protect water quality, provide fish and wildlife habitat, protect capital improvements, and ensure that harvested areas are reforested.
Ecology’s Role in Rule Adoption and Enforcement
Ecology has a unique role in the adoption and implementation of the forest practices rules because the Washington State Forest Practices Act and rules were designed and adopted, in part, to meet the requirements of the Clean Water Act and the state water quality standards. The Forest Practices Board is the agency responsible for adopting the forest practices rules. However, for those sections of the rules pertaining to water quality protection, the board must reach agreement with the director of Ecology, or the director’s designee on the board (RCW 76.09.040(1)(e)). The director’s (or designee’s) membership on the Forest Practices Board also gives the agency a role in adopting other forest practices rules. In addition:
1. Ecology’s Water Quality Program staff collaborates with DNR and other cooperating agencies and organizations to develop forest practices rules and Forest Practices Board Manual guidelines related to water quality protection.
2. Ecology staff participates in forest practices application and notification review by providing DNR with technical input and recommendations for avoiding and/or mitigating water quality impacts associated with individual forest practices.
3. Ecology is involved in the adaptive management program at all levels, including the Cooperative Monitoring, Evaluation, and Research (CMER) Committee; Forests and Fish Policy; and the Forest Practices Board.
While DNR implements and enforces the Forest Practices Rules, Ecology also has enforcement authority related to forest practices. If Ecology determines that a forest landowner or operator has failed to comply with forest practices rules related to water quality, the agency can initiate an enforcement action if DNR does not. However, Ecology may not impose civil or criminal penalties for actions conducted pursuant to a DNR approval or directive. Ecology must notify DNR prior to taking action under statutes or rules related to water quality. Ecology may also appeal an approval of a forest practice to the Forest Practices Appeals Board.
Forests and Fish Report and the Forest Practices Rules
The Forests and Fish Report was signed into state law in 1999. As a result, based on FFR findings, new forest practices rules - effective in 2001 - were designed to improve water quality and habitat for aquatic species, including native salmon, and to maintain a viable and responsible forest products industry in Washington. New rules were adopted and guidelines developed to:
• Protect steam banks from erosion.
• Ensure fish passage to upstream habitat.
• Minimize the construction of new roads and ensure that roads being used meet upgraded standards.
• Require landowners to prepare and implement Road Maintenance and Abandonment Plans (RMAPS) designed to address road related impacts. While some landowners are exempt from the planning requirement, all must comply with forest practice rules for road construction and maintenance.
• Establish mature, conifer-dominated riparian forests to provide adequate shade to streams and recruit wood to streams.
• Establish an adaptive management and monitoring program.
The Forest Practices Rules, consistent with the Forests and Fish Report, contain an array of best management practices believed to be most effective in protecting and improving water quality and habitat for threatened and endangered species while maintaining a viable forest products industry. The rules also contain a robust adaptive management program. The rules, in
combination with the adaptive management program, provide a pathway to achieve compliance with the state water quality standards and the Clean Water Act.
The forest practices program and the forest practices rules are described more fully in Volume 2 of Washington’s Water Quality Management Plan to Control Nonpoint Source Pollution. Compliance with the forest practices rules comprises the state’s primary strategy for addressing nonpoint pollution caused by forest practices. In addition, the following plans further assure that forest practices are intended to meet both Clean Water Act (CWA) and Endangered Species Act (ESA) requirements.
Forest Practices Habitat Conservation Plan
these ground breaking rules comply with the Endangered Species Act. The state is seeking an incidental take permit from the Services for a period of fifty years through the implementation of a plan known as the Forest Practices Habitat Conservation Plan (FPHCP).
Given the geographic scope of lands covered by the FPHCP and the associated Forest Practice Act and rules (approximately 9.1 million acres of forestland in Washington), the large number of landowners involved, and the multiple species for which coverage is being sought, the state has developed the FPHCP as a programmatic plan. Whereas most habitat conservation plans approved to date are agreements between the federal government and an individual landowner, the programmatic nature of the FPHCP provides ESA coverage for forest landowners through the state’s forest practices program.
Forest practices activities covered by the FPHCP include road and skid trail construction, road maintenance and abandonment, final and intermediate harvesting, pre-commercial thinning, reforestation, salvage of trees, and brush control. Adaptive management research and
monitoring activities are also covered by the plan. The FPHCP includes protection measures to monitor, minimize, and mitigate any impacts caused by these activities.
DNR State Trust Land Habitat Conservation Plan (HCP)
Approximately 2.1 million acres of state-owned forestlands (State Trust) are managed by the Department of Natural Resources. In accordance with the state constitution, timber harvest from these lands is a major source of revenue for public school construction, county government, universities, prisons, and other state institutions. Management of this highly productive forestland has generated over $250 million annually over the last two years for the trust beneficiaries.
The DNR State Lands HCP covers approximately 1.6 million acres of state trust land. It includes all of the state trust forest lands in western Washington, as well as trust lands within the range of the spotted owl on the east slope of the Cascade Range. The plan provides protection for
salmon, aquatic species, the marbled murrelet, and a number of other wildlife species on the west side of the cascades, for the northern spotted owl throughout its range, and for other upland wildlife species.
Private and Local Government Habitat Conservation Plans
Several private timber companies and two municipalities have completed habitat conservation plans that protect aquatic species and riparian habitat on approximately 600,000 acres of forestland. Only the Simpson HCP has been provided with CWA assurances through a TMDL.
Water Quality Impacts from Forest Practices
Forest practices can affect the quantity and quality of aquatic and riparian habitat by altering physical watershed processes such as erosion, large wood recruitment, and availability of shade. Timber harvesting, road construction and maintenance, and the use of pesticides have the
The types of forest practices activities that can cause water quality problems are:
Road Construction and Maintenance
The fine sediment in the surface runoff from forest roads can impact spawning gravels and egg survival, and fill pools needed for rearing. Coarse and fine sediments entering small headwater channels are routed to downstream depositional reaches where they can affect lower mainstem fish species such as chinook, chum, steelhead, and coho.
Poorly designed, constructed, or maintained forest roads can also divert surface water from one drainage to another, harming the hydrology of the natural stream system. Improperly maintained ditches that direct surface water to streams, blocked culverts, or inadequate road surfacing can all contribute to increased sedimentation. If conducted on steep or unstable slopes, these practices can accelerate the rate of mass wasting processes such as debris avalanches, debris flow, and debris torrents .Movements of large amounts of sediment and debris through a stream can cause extensive physical damage, including streambank erosion and degrading habitat by changing the channel morphology—causing a stream to widen and become shallower and susceptible to higher temperatures.
Timber Harvest
Timber harvest, particularly within riparian areas, can affect streambank and floodplain integrity. Riparian vegetation slows water velocity on the floodplain and the roots inhibit erosion along stream banks, reducing sediment deposition in streams.
Riparian areas are an important source of large woody debris (LWD) that enters, or is recruited to the stream channel. Large wood is an important component of fish habitat. It forms pools, provides cover, supplies spawning gravels, and creates channel complexity—all important to fish rearing and survival. Large wood recruitment originates from a variety of processes including tree mortality, windthrow, undercutting of stream banks, debris avalanches, and deep-seated mass soil movements. Timber harvest or removal of trees for road construction can result in a deficiency of large wood available to streams.
Timber harvest and disturbance to understory vegetation can have the greatest effect on direct solar radiation by reducing the amount of available streamside shade. Reductions in streamside shading are most likely to adversely affect water temperature and the habitats of aquatic species. Removal of riparian vegetation can also affect the amount of leaf and needle litter, which are important to aquatic food chains and nutrient cycling.
Use of Pesticides
Impacts on Designated Uses
If forest practices are conducted improperly, the result can be increased water temperatures, sediment delivery to streams, damage to stream hydrology, loss of large wood in streams, and delivery of pesticides and fertilizers to surface waters. All of these problems were documented in 303(d) lists and 305(b) water quality assessments in the 1990s.
Impacted Designated Uses from Forest Practices
Recreation
Water Supply
Shellfish Harvesting
Aquatic life
Wildlife habitat
Boating
Commerce and navigation
Aesthetics
Agriculture
Background
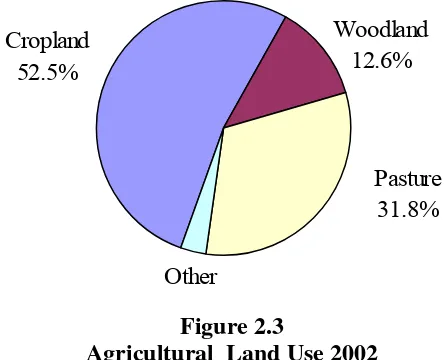
For the purposes of this document, agriculture is defined as the production of crops or livestock for commercial sale and/or personal benefit. Agriculture in Washington is a diverse industry that encompasses a wide range of activities and products; it includes large commercial operations that cultivate and harvest thousands of acres of crops and small farms that raise and sell dairy heifers (Figure 2.3). Agricultural products are distributed through industrial market systems, as well as through local cooperatives, farmers’ markets, or private contacts. Agricultural activities in Washington represent a significant sector of the state’s economy, with contributions that total about 20 percent of the gross state product at the retail level. It is also a highly diverse business, with more than 250 different crops grown in Washington . Some crops grown here, such as spearmint, represent most of the national and, in a few cases, international market.
Plant-based agriculture in Washington includes cut flowers, bulbs, vegetables, fruits, nursery and landscaping stock, berries, orchards, vineyards, pasture grass for forage, corn or other grains, and hay for silage. Commercial livestock operations in Washington include bovine dairies,
x
x
x
x
x
x
x
Other
Pasture 31.8% Woodland
12.6% Cropland
52.5%
Figure 2.3
Agricultural Land Use 2002
2002 Census of Agriculture, USDA National Agricultural Statistics Service, June 2004.
cattle feedlots, and sheep, poultry and swine operations. In addition, livestock operations can also include the breeding and keeping of horses, dairy goats, geese/ducks, rabbits, and exotic animals such as llamas, emus, and ostriches (Figure 2.4). Livestock grown strictly for personal use also comprises a significant portion of the total livestock numbers in the state.
One type of agricultural operation is considered a point source of pollution. These are businesses that meet the definition of a Concentrated Animal Feeding Operation (CAFO). These are
regulated under the National Pollutant Discharge Elimination System (NPDES) program. This program requires CAFO operators to obtain a permit if they have a discharge to state waters. At this time, the permit for Washington is still under development. The important thing to
remember is that whether an agricultural operation is considered a point or a nonpoint source, discharges to state waters are not allowed without a NPDES permit.
Figure 2.4
Number of Farms in 2002
2002 Census of Agriculture, USDA National Agricultural Statistics Service, June 20047
Water Quality Impacts from Agriculture
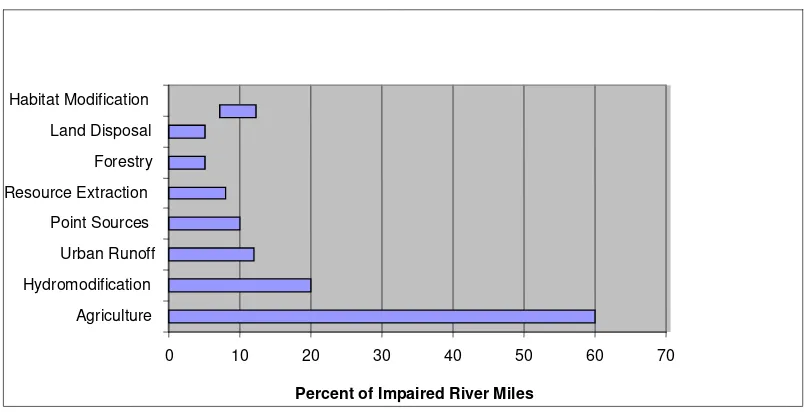
Nationwide, agricultural activities are a leading cause of impaired waters. Most of the
degradation is attributed to loss of riparian corridors. The results are increased fecal coliform
0 2,000 4,000 6,000 8,000 10,000 12,000 14,000
Dairies Beef Cows Orchards Forage Land
contamination, high temperature, and excessive nutrients. The most common agricultural activities leading to impairment are those associated with livestock access to riparian areas. Those activities lead to fecal coliform bacteria from manure, increased sedimentation, and loss of trees in riparian areas that result in increased surface water temperatures. In addition to
degradation of surface waters, agriculture activities can cause groundwater pollution when fertilizers (manure or synthetic) and pesticides (herbicides, insecticides, and fungicides) are improperly applied to fields and other cropland.
Figure 2.5
Leading sources of river and stream impairment National Water Quality Inventory, 1998 Report to Congress. June 2000 EPA841-R-00-001
Irrigated agriculture practices can contribute to surface water quality degradation. Two basins, the Yakima and the Columbia, support the majority of the state’s irrigated agriculture
production. That is, of the 1.8 million total acres of irrigated land in Washington, 575,000 acres are located in the Columbia Basin, while the Yakima Basin supports 520,000 acres. The
remaining 700,000 acres are distributed throughout the state. Soil loss caused by the application of irrigation water has decreased over the past 20 years, due to improved practices, although significant erosion still occurs. Erosion of sediments causes water quality problems by
degrading fish habitat and decreasing water clarity. Irrigation return flows draining agricultural areas can carry pesticides and fertilizers to rivers and streams. Irrigation also increases the potential for leached materials, such as pesticides and fertilizers, to reach ground water.
Grazing and rangeland management activities also create a significant potential for water pollution, particularly in eastern Washington. Cultivating crops and grazing livestock too close to stream banks can cause increased erosion rates, increased temperature, and other water quality problems.
0 10 20 30 40 50 60 70
Agriculture Hydromodification Urban Runoff Point Sources Resource Extraction Forestry Land Disposal Habitat Modification
Ambient monitoring has shown that impairment to water quality exists in Washington’s dry-land agricultural areas, particularly where soils erode easily, such as in the Palouse region. Stream corridors associated with agricultural and forested lands are especially susceptible to degradation of water quality due to pressures from animals foraging and drinking near or within waterways. Other detrimental activities include improper management of manure and wastewater
confinement area runoff, excess surface runoff from overgrazed pastures, trampling of
streamside vegetation, and direct access to streams by animals. Effects on surface and ground water quality from these types of activities can include high levels of fecal contamination, increased nutrient loads, and sedimentation.
Wind blown dust from poor farming practices can impact water quality. Pollution from the air may settle into streams, lakes, or estuaries. Once pollutants become airborne, they may fall to the ground in a process called atmospheric deposition. The deposition of an air pollutant on land or water can take several forms. Wet deposition occurs when air pollutants fall with rain, snow, or fog. Dry deposition is the deposition of pollutants as dry particles or gases. The pollutants can reach bodies of water as direct deposition falling directly into the water, or as indirect deposition, falling onto land and washing into a body of water as runoff. There is also some evidence that atmospheric pollutants can affect groundwater.
Both point and nonpoint sources of water pollution from livestock are controlled through permitting processes, implementation of BMPs, and the implementation of educational and outreach efforts. For example, CAFOs must follow rules and guidelines outlined in the NPDES permit. Nutrients from dairies and other livestock operations are regulated through livestock nutrient management programs that are currently co-administered by the Washington
Department(s) of Agriculture and Ecology. These programs work to protect water quality from livestock nutrient discharges through the combination of clear guidance, education, and technical assistance, as well as through coordination with related agencies, industry, and other
stakeholders.
Impacts on Designated Uses
Designated uses that are threatened or impaired in Washington due to diffuse agricultural sources of pollution include drinking water supply, shellfish harvesting, aquatic life, wildlife habitat, and aesthetics. The original 1989 assessment of nonpoint sources of pollution for Washington State determined that agriculture (and particularly animal keeping) is one of the main sources of water quality degradation to creeks and rivers. That assessment has not changed. The 1998 305(b) assessment also reported that nearly half the river miles assessed were negatively impacted by activities associated with farm animals, such as runoff from pastures and holding areas, and destruction of riparian vegetation.
Impacted Designated Uses from Agriculture
Recreation
Water Supply
Shellfish Harvesting
Aquatic life x
Wildlife habitat
Boating
Commerce and navigation
Aesthetics
Urban/Suburban Growth
BackgroundThe sources of nonpoint pollution in the urban/suburban category include on-site sewage disposal systems, stormwater runoff, fertilizers, and household wastes, and all of these are magnified by increasing urban and suburban development.
Natural vegetative cover once protected much of Washington's land by intercepting rainfall, reducing erosion, and recharging ground water. The trees and shrubs held much of the moisture, and the forest duff layer absorbed runoff, releasing it slowly and steadily to the streams.
However, with the advent of human development patterns, some hydrologic regimes have been forever altered.
One of the major problems currently facing Washington is the high growth rate the state
experienced in the 1990s, and continuing into the 2000s. During the 1990s, an average of about 130,000 people moved into the state each year. That, combined with the birth rate, forced an increase in construction and development and thus a change in land cover. Most of this growth originally centered in urban districts associated with metropolitan Puget Sound. More recently, however, growth has spread throughout the state, with rates ranging from 0.3 percent annual growth in the rural southeastern part of the state, to 5 percent growth in Clark County.
During this period, local governments and citizens have focused much effort on maintaining the quality of life in their communities. For example, in 1991, only 14 of the state’s 39 counties were fully planning under the Growth Management Act. By 1998, 29 counties, or almost twice that number, were fully planning, utilizing comprehensive plans and development regulations. These 29 counties hold more than 95 percent of the state’s population. All ten of the counties not fully planning under the act have growth rates lower than the state average and plan under the Washington State Planning Enabling Act (RCW 36.70). The Growth Management Act requires the use of best available science (BAS) to protect the functions and values of critical areas. Ten counties and their cities are planning for resource lands and critical areas only. Nearly all local governments required to prepare comprehensive plans have completed their first plans under the act and are beginning to see initial results.
On-site sewage systems serve approximately 1.4 million people in the 39 Washington counties. Most of the administration of on-site septic system regulations and programs is conducted by the 32 local health jurisdictions. The state recognizes that proper operation and maintenance of on-site systems is essential to ensure they function properly. WAC 246-272-15501 (2)(b)(ii)
x
describes the operation and maintenance responsibilities of the on-site system owner and of the local health district. The owner is responsible to properly monitor the operation of their system, to have it pumped when necessary, to avoid damage or improper use of the system, and to ensure that the flow of sewage does not exceed the approved design in both quantity and waste strength.
Land clearing for buildings, parking lots, and landscaped areas is now occurring at a rapid rate. Soils that allowed water to infiltrate are being paved over. With increased impervious surfaces, rainfall runs quickly and directly into streams, dramatically increasing volume and peak flows. In addition, development encroachment into riparian corridors and modifications to the surface water drainage network all work together to increase runoff and pollution. Stormwater runoff may contain high concentrations of heavy metals, fecal coliform, silt, petroleum products, nutrients, and pesticides.
Sprawl is unmanaged development marked by automobile-dependent, spread-out suburbs, where the activities of daily life – home, school, shopping and work – are separated by long distances linked only by pavement. It results in the excessive transformation of natural areas to hard surfaces, such as ever-widening roads, parking lots, and roofs. In effect, sprawl development intensifies the effects of urbanization because it results in a greater area of impervious surface per person. More concentrated development patterns, as envisioned in the GMA, may reduce impacts, but only if we preserve portions of every watershed in an undeveloped condition. Concentrating development alone will not protect water quality.
Many stormwater managers, developers, engineers, and local governments in Washington are beginning to use low impact development (LID) practices to manage stormwater on-site. Low impact development (LID) is an innovative stormwater management approach with a basic principle that is modeled after nature—manage rainfall at the source using uniformly distributed decentralized micro-scale controls. LID's goal is to mimic a site's predevelopment hydrology by using design techniques that infiltrate, filter, store, evaporate, and retain runoff close to its source.
The interagency Puget Sound Action Team, Ecology stormwater staff, university scientists, and others are supporting demonstration projects, conducting research, and education. Ecology is currently revising its Stormwater Management Manual for Western Washington to incorporate flow control credits for additional LID practices such as permeable pavement and bioretention.
The Puget Sound Action Team, using 319 funding from Ecology, has published a Puget Sound Technical Manual for Low Impact Development, which may be found at
http://www.psat.wa.gov/Publications/LID_tech_manual05/lid_index.htm. This approach offers promising techniques that will improve water quality and hydrologic responses.
phases for the stormwater permit program. Phase I stormwater NPDES permits have been issued to cover stormwater discharges from certain industries, construction sites involving five or more acres, and municipalities with a population of more than 100,000. There are seven Phase I municipalities in Washington.
On October 29, 1999, the final Phase II stormwater regulations were signed into rule by EPA. The Phase II regulations expand the requirement for stormwater permits to all municipalities located in urbanized areas and to construction sites between one and five acres. The rule also requires an evaluation of cities outside of urbanized areas that have a population of more than 10,000 to determine if a permit is necessary for some or all of these cities. Under the new rule, over 100 additional municipalities in Washington may need municipal stormwater permits (Table 2.1).
Table 2.1
Population Covered Under Stormwater Permits
* all figures based on 2000 census data and actual population data within urbanized areas.
Water Quality Impacts from Urban/Suburban Sources
Numerous studies conducted during the late 1970s and 1980s showed that stormwater runoff from urban and industrial areas is a potentially significant source of pollution. Stormwater quality tends to be extremely variable. The intensity of rainfall fluctuates dramatically, affecting runoff rate, pollutant washoff rate, in-channel flow rate, pollutant transport, sediment deposition and re-suspension, and channel scour, for example. As a result, pollutant concentrations and other stormwater characteristics at a given location will vary significantly during a single storm runoff event and from event to event. In addition, the transitory and unpredictable nature of
Western WA Eastern WA Washington State
Total population 4,587,173 1,306,948 5,894,121
many pollutant sources and release mechanisms (spills, leaks, dumping, construction, irrigation runoff, vehicle washing, etc.) and differences in the time interval between storm events also contribute to inter-storm variability.8
Based on Puget Sound area studies, watersheds that have ten percent effective impervious area, or have one-third of their forest cover removed (without any effective impervious area), have “demonstrable degradation, some aspects of which are surely irreversible.”9 Urbanization brings an increase in impervious land cover and a corresponding loss of natural vegetation. Land clearing, soil compaction, riparian corridor encroachment, and modifications to the surface water drainage network all work together to increase runoff and change watershed hydrology. Riparian zones are fragmented and stripped, no longer able to provide shade, nutrients, and large woody debris to the stream. Streamflow fluctuates widely from summer to winter, and from storm to storm. Streambank erosion brings fine sediment deposition and loss of spawning and incubating habitat.
Runoff may contain high concentrations of heavy metals, fecal bacteria, silt, petroleum products, nutrients, PAHs,, phthalates, mercury, and pesticides. In the short term, these pollutants can stress aquatic organisms, damage shellfish beds, and restrict water recreation. In the long term, accumulation of pollutants in receiving waters can create irreversible problems such as
eutrophication of lakes, groundwater contamination, and contaminated sediments.
In addition to carrying pollutants, runoff can cause streambed scouring and erosion, which contribute to water quality degradation. Impermeable surfaces, such as roofs, parking lots, and paved streets, prevent rainfall from infiltrating the soil, creating sudden rushes of water in receiving streams during a storm.
Although stormwater is generally discharged to surface waters, an alternative is to discharge stormwater to underground wells. Approximately 18,000 dry wells and similar infiltration devices are used to dispose of storm water in Washington. However, such discharges can contaminate public or private water wells.
Another problem with stormwater control is infiltration and inflow (I&I) in sewer systems. As improvements are made to the sewer systems to eliminate stormwater I&I, the stormwater is typically diverted to surface waters, often without any treatment. Stormwater I&I contributes to combined sewer overflows (CSOs), which pose a serious public health threat, particularly in shellfish growing areas.
Impacted Designated Uses from Urban/Suburban pollution
Recreation
Water Supply
Shellfish Harvesting
Aquatic life x
x x
Wildlife habitat
Boating
Commerce and navigation
Aesthetics
Recreation
BackgroundRecreation includes activities in fresh and marine waters; on ocean beaches; along the shores of rivers, streams, and lakes; and on the waterfront of Puget Sound. More than half of all
Washington residents engage in recreational activities and, of those, more than 60 percent participate in freshwater activities.10
Many recreational activities can have an impact on water quality or be impacted by poor water quality, including:
• Scuba/skin diving
• Water skiing
• Motor boating
• Personal watercraft
• Sail boating
• Hand power canoe/kayak/rowboat
• White water rafting
• Floating
• Wind surfing
• Surfboarding
• Swimming or wading
• Beachcombing
Perhaps the biggest threat to water quality from recreational activities is from boating. It has been estimated that 20 percent of Washington’s households own at least one boat. People use boats recreationally in Puget Sound, lakes, and major rivers. Power boaters represent 90 percent of the boating public. Most boats are less than 16 feet long.
Recreational boating contributes to the state economy. Direct and indirect boating sales
generated $895 million and $2.4 billion respectively in 1986 and provided jobs for an estimated 17,300 people statewide (1988 State of the Sound report by the Puget Sound Water Quality Authority).
Within Washington’s coastal areas, there are over 450 marinas that provide approximately 37,400 wet moorage slips. Most marinas are small, providing less than 200 slips. In contrast, a small number of marinas owned by public port authorities account for a disproportionate number of wet moorage slips - 15,000. Of five marinas having over 1,000 slips, four are owned by port
x x
authorities. Over half of the total number of marinas are located in the central Puget Sound counties of King (85), Pierce (29), Kitsap (26), and Snohomish (13). The 29 marinas located in San Juan County reflect the popularity of that part of Washington as a boater destination. Location and size of the fleet appears to be in approximate proportion to population centers.9
Current Washington State figures estimate that approximately 338,400 households own 440,000 recreational boats. Of this number, about 255,593, or 58 percent, are powerboats. About 72 percent of all recreational boats use a gasoline engine of some kind. Canoes and kayaks make up about 13 per cent of the fleet, with roughly 55,268 units.
Most recreational boats, about 299,000 are stored on trailers and hauled to and from launch sites behind a motor vehicle. Statewide, motor boat owners have access to approximately 911 public launch sites (IAC, 1997). This figure generally reflects the large number of boats in the size range of 16 to 26 feet that are usually transported by trailer. The figure also indicates a sizable fleet of recreational boats in both the coastal zone and central and eastern Washington. Many boats do not have onboard sanitation devices, and littering from boats is common.
Figure 2.6
Participation in General Recreation Categories as a Percent of State Population An Assessment of Outdoor Recreation in Washington State, IAC, Oct. 200211
Water Quality Impacts from Recreational Activities
There is a high potential for water quality degradation from raw sewage, contaminated bilge water, petroleum products, trash, paint scraping, and solvents being discharged into state waters by recreational boaters. However, the magnitude of that potential in pounds of pollutants is not known.
Contaminants from marinas and recreational boating include sewage (and associated pathogens) and the toxicants contained in petroleum products and other materials used to maintain and repair boats. Discharges of treated and untreated sewage from boats may especially be a problem in smaller bays with poor water circulation, near shellfish beds and public swimming areas, and at marinas.
53% 44.80% 43% 23%
21% 20.50% 20% 19% 19% 13% 13% 8.50% 6.10% 3% 1.70%
Since passage of the federal Clean Water Act in 1972, any boat with a toilet installed must have a marine sanitation device (MSD) to treat and/or hold sewage. Effective enforcement of this regulation by the U.S. Coast Guard, however, has proven to be a logistical impossibility. Educational programs are the most promising approach to reducing pollution from boating activities.
Contamination from recreational boats may be greatest at marinas and popular destination areas, where the concentration and disposal of wastes, including treated and untreated sewage, trash, petroleum products, and bilge water, may be significant problems. Marinas12 themselves, if improperly designed and sited, may cause water quality problems through habitat destruction and restricted flushing. However, marinas, destination sites, and other boating facilities can provide the services that are essential for safe and effective disposal of boat wastes, particularly sewage and petroleum products. Unfortunately, many marinas do not provide sewage pump-outs or recycling facilities.
Impacted Designated Uses from Recreational Activities
Recreation
Water Supply
Shellfish Harvesting
Aquatic life
Wildlife habitat
Boating
Commerce and navigation
Aesthetics
Habitat Alteration
BackgroundIn the 200-year period prior to the late 1980s, the state lost an estimated 31percent of its 135 million acres of wetlands.13 Increasing population and pressure to use land more “productively” have resulted in diking, draining, and agricultural practices affecting wetlands, as well as the direct loss of wetlands14. There is no current data available for freshwater wetland losses in Washington. However, on the national level, the loss of wetlands has not stopped, according to a report released by the National Research Council15. The U.S. Environmental Protection Agency states that although wetland loss rates are slowing, the United States continues to lose
approximately 70,000 to 90,000 acres of wetlands on nonfederal, rural lands each year.16 x
x
x
x
x
x
x
Wetlands provide essential habitat for feeding, nesting, cover, and breeding for birds, fish, amphibians, and reptiles. The Department of Fish and Wildlife lists over 175 wildlife species that use wetlands for primary feeding habitat and 140 species that use them for primary breeding habitat. At least one-third of Washington's threatened and endangered species require wetlands to survive.
The Puget Sound Plan17 identified other important benefits of wetlands for human communities, including the slowing and storage of floodwater, cleansing water of certain pollutants, recharging ground water, and serving as an outlet for ground water to recharge streams (ground water discharge) and providing recreational areas. In their natural state, wetlands help decrease the need for costly stormwater facilities and flood protection measures such as levees and dikes. Continued habitat loss due to hardening of marine shorelines is still a major concern. New state shoreline guidelines to address this issue are to be produced soon.
Riparian areas are also areas of abundant biota. In addition, the riparian zone protects the adjacent stream or river. The canopy of the riparian area provides shade to cool the stream, nutrients from leaf litter, and habitat for insects and other life forms important in the aquatic food web. The riparian area also prevents or decreases erosion and sedimentation.
Wetlands and riparian areas can play a critical role in reducing nonpoint source pollution by intercepting surface runoff, subsurface flow, and certain groundwater flows. Their role in water quality improvement includes processing, removing, transforming, and storing pollutants such as sediment, nitrogen, phosphorus, and certain heavy metals. Wetlands and riparian areas buffer receiving waters from the effects of pollutants or they prevent the entry of pollutants into receiving waters.
According to EPA, three general types of habitat modification must be addressed by states as they develop their nonpoint programs.
1) Channelization and channel modification. 2) Dams.
3) Streambank and shoreline erosion.
In Washington, habitat alteration has significantly influenced the hydrology of the state. The construction of dams, tide gates, culverts, bridges, piers, and jetties, as well as the armoring of shorelines and the placement of fill, have helped create drinking water supplies, reduce flood impacts, expand road networks, improve navigation, increase drainage, prevent erosion, and reduce sediment loss. Many of these activities have also led directly or indirectly to adverse impacts on aquatic ecosystems.
Water is diverted primarily for two uses: drinking water and irrigation water. Many of
Washington’s older cities rely in whole or in part on surface water for drinking water supplies. In addition, numerous irrigation systems in the state use human-built side channels for water diversion and return flows.
are for hydropower. Half are primarily for recreation and irrigation. About an equal amount are for water quality, flood control, and water supply. Most have a combination of uses. Private dams comprise the ownership of over half of the dams, followed by local government, public utility districts, federal and state ownership.
Flood control and sediment management are also important in Washington. Floods in 1990 and 1996 caused millions of dollars in damage. Many flood control structures are owned and managed by the U.S. Army Corps of Engineers. Probably the largest structure completed in recent years was the sediment retention dam on the Toutle River, following the eruption of Mount St. Helens.
Seventeen dams in Washington will begin the Federal Energy Regulatory Commission (FERC) re-licensing process in the next ten years. Many of these are large private dams on the Columbia River. Most of these dams were built 35-50 years ago. When a dam operator requests a license, Ecology works with the utility, reviews studies, analyses, and plans to make sure the facility will meet the state’s water quality standards. If Ecology determines that water quality standards are attainable, a water quality certification (401 certification) is issued with conditions to ensure the standards will be met. Many of the existing dams will have difficulty meeting the standards but can do so by making operational changes.
Siltation is another important problem in Washington. Puget Sound’s ports manage more than 50 million tons of cargo each year, at over 200 docks and piers. In some areas, such as the ports of Seattle and Tacoma, artificial waterways have been constructed to increase available dock space. In addition, Puget Sound is home to much of the Alaskan fishing fleet. Such traffic makes periodic dredging necessary to maintain shipping channels.
Water Quality Impacts from Loss of Aquatic Ecosystems
Damage or destruction of riparian areas is a major cause of impairment to the streams in the state. Many of these streams once hosted abundant salmon runs and other fish and wildlife. Forest practices in the upper watersheds and foothills, and development of the lowlands and valleys have caused significant sediment loads and changes in channel morphology.
The functions of wetlands and riparian areas include water quality improvement, aquatic habitat, stream shading, flood attenuation, shoreline stabilization, and ground water exchange. Wetlands and riparian areas typically occur as natural buffers between uplands and adjacent water bodies. Loss of these systems allows for a more direct contribution of nonpoint source pollution to receiving waters (USEPA, 1993).
A major concern for Washington is the reduction in fish habitat in altered water bodies. This is especially true for anadromous fish. Stream channelization can cause streambed scouring and hardening, streambank erosion, altered waterways, and altered hydrochemistry. As a result, there are potential changes in pH, metals concentration, dissolved oxygen, instream flow, and nutrient levels.
Mitigation measures, particularly those dealing with channelization and riparian habitat, are partially addressed through wetlands programs and fish and wildlife habitat programs. One goal for Washington is to ensure that there is no net short-term or long-term loss in aquatic and riparian habitat, and to coordinate federal, state, local, and tribal fish and wildlife protection programs.
Impacted Designated Uses from Loss of Aquatic Ecosystems
Recreation Water Supply Shellfish Harvesting Aquatic life
Wildlife habitat Boating
Commerce and navigation Aesthetics
Cumulative Sources of Pollution by Different Land Use Activities
As Table 2.2 below indicates, many sources of pollution contribute similar pollutant types. For example, fecal coliform can be contributed by agricultural practices, stormwater runoff, failing on-site sewage systems, and recreation. This can make identification of the specific source of a pollutant extremely difficult and time-consuming. The cumulative effects of these many sources of pollution can be devastating to the receiving waters and ecological systems that rely on those waters.
x x
x x