423
ROLE OF ANTI-OXIDANTS ON NORMOXIC METHACRYLIC ACID
GELATIN (MAG) POLYMER GEL DOSIMETER AT 6-MV PHOTON BEAM
USING SINGLE SPIN ECHO MRI
(Peranan Anti-Oksida Dalam Normosik Asid Methakrilik Gelatin (MAG) Dosmeter Gel Polimer
Pada 6-MV Sinaran Photon Menggunakan Aturan Nada Denyut Tunggal MRI)
Nik Noor Ashikin Nik Ab Razak1*, Azhar Abd Rahman1, Sivamany Kandaiya1, Iskandar Shahrim1, Nor Zakiah Yahaya1, Noor Faizura Zainal2, Eng Kae Yann3
1School of Physics,
Universiti Sains Malaysia, 11800 Minden, Penang, Malaysia
2
Imaging Department, Institut Perubatan dan Pergigian Termaju (Advanced Medical & Dental Institute), Universiti Sains Malaysia, 13200 Kepala Batas, Penang, Malaysia
The primary goal of radiation therapy is to deliver a sufficient radiation dose to a target volume while minimizing the dose to surrounding healthy tissue. In this study the dose response of methacrylic acid-gelatin (MAG) polymer gel dosimeter using different type of anti-oxidants; ascorbic acid (AscA) and tetrakis-hydroxy-methyl-phosphonium chloride (THPC) is determined by using single spin echo sequence magnetic resonance imaging (MRI). The concentrations of methacrylic acid (MAA) were varied and using MRI, the optimal formulation that gives the maximum R2-dose response of the polymer gel upon irradiation was determined. The polymer gel was irradiated using a 6 MV photon from a linear accelerator (LINAC) for a dose range varying from 0 to 20 Gy. The transverse relaxation rates (R2) of the irradiated gels from MRI were read. A linear relationship between dose and R2 was obtained for a dose range of 0 to 20 Gy for MAG gel composed of ascorbic acid (MAGAS) and linear response from 0 to 10 Gy for MAG gel composed of THPC (MAGAT). The sensitivity of MAGAS showed lower sensitivity compared to MAGAT. The optimum concentrations for the MAGAS and MAGAT polymer gel were 6% MAA and 5% gelatin as it gave the highest sensitivity of 0.0989 s-1Gy-1 and 1.1180 s-1Gy-1 respectively. The results are compared to Multiple Spin Echo Sequence MRI.
Keywords: MAGAS polymer gel, MAGAT polymer gel, dose sensitivity, ascorbic acid, THPC, single spin echo sequence
Abstrak
424
Kata kunci: Polimer gel MAGAS, polimer gel MAGAT, sensitiviti dos, asid askorbik, tetrakis-hydroxy-methyl-phosphonium
chloride (THPC)
Introduction
Radiotherapy gel dosimeter is a chemical dosimeter fabricated from radiation sensitive chemicals in an aqueous gelatin network. Upon irradiation, free radicals from radiolysis process were formed in the gel induce polymerization where amount of polymerization increase and related to absorbed dose [1]. The use of radiation sensitive gel for radiation dosimetry was first suggested in the 1950s by Day where radiation induced color changes in dyes were related to radiation dose [2, 3]. Polymer gel dosimetry is one of the gel dosimetry techniques that can be used to verify the spatial dose distribution in complex radiotherapy. The change in dose distribution can be recorded in 3-D by various techniques such as magnetic resonance imaging (MRI) [1], optical scanning [4, 5], x-ray computed tomography [6] or FT Raman spectroscopy [7].
To date, MRI is frequently used modality for measuring 3D dose information in a polymer gel [7]. MRI is a tomographic imaging technique that is based on nuclear magnetic resonance (NMR) signals to produces images [1]. The absorbed dose is quantified using the spin-spin relaxation rate (R2=1/T2). The T2 relaxation time is a biological parameter that is used in MRI to distinguish between tissue types. From R2 images of polymer gel dosimeters, the dose maps can be reconstructed through the calibration curve obtained from a series of samples irradiated to a range of doses. For an extensive details on MR imaging, see the review by Baldock [7] and Doran [8].
A few types of imaging sequences can be applied to acquire quantitative R2 maps. These imaging sequences may differ in performance in terms of accuracy, precision and speed. Two main imaging sequences have often been used. First is single spin echo sequence method where each acquisition collects only a single echo, but can be repeated with different echo times [9]. The advantages of the single spin echo sequence is that it is readily available on all scanners and it is easy to understand and measure the R2 relaxation rate data with good signal-noise-ratio (SNR). The gel manufacturer (MGS Research Inc., Guilford, CT) recommends the use of a two echo sequence in order to reduce the data required for each echo (TE1 and TE2) which then reduces the radio frequency power [9]. Consequently the gel temperature will be more stable and it is an important factor for MRI imaging. If one has only access to a single spin–echo sequence, a two-point(s) (two different echo times) method is preferred [10]. The other sequence is multiple spin echo (MSE) sequence which applies a train of equally spaced spin-echoes, each corresponding to a different echo time [11, 12].
Despite the advantages of gel dosimetry for 3D dose verifications, the system is not yet establish as a standard clinical tool. Polymer gel dosimetry systems have a major limitation where oxygen during manufacturing procedure known as hypoxic or anoxic gel dosimeters, inhibits the polymerization process in polymer gel as it scavenges free radical initiators (such as OH and H) produced during water radiolysis [1, 13, 14]. In the first generation of polymer gel dosimeters, during the gel fabrication the oxygen was removed by bubbling the gel solution with inert gasses such as nitrogen and argon for several hours [1, 13, 15, 16]. In addition, the gel had to be poured in the containers with low oxygen permeability and solubility.
In modern polymer gel dosimeters, the problem with oxygen is solved by adding an antioxidant in the gel solution that binds to the oxygen and consequently prevents free radical scavenging [17]. As a result the polymer gels can be
fabricated under normal atmospheric conditions and are therefore called ‘normoxic’. In 2001, Fong et al introduced
425 Materials and Methods
Fabrication of gel dosimeter
The gel formulation consisted of methacrylic acid (Acros, Organics), gelatin (250 bloom, Bovine) (Sigma Aldrich), de-ionised water, ascorbic acid (Sigma Aldrich) and THPC (Sigma Aldrich). The MAG polymer gels were manufactured under normal atmospheric conditions. The gelatine was mixed with de-ionised water in a mixing vessel and was continuously stirred at approximately 48˚C until the gel was completely dissolved and a clear
solution was obtained. The solution was cooled to 40˚C then the methacrylic acid monomer was added and
continuously stirred until the monomer was completely dissolved. For manufacturing the normoxic polymer gel, an anti-oxidant was finally added to minimise the oxygen exposed to the solution [18]. The fabrication procedures of gel solution are shown as Figure 1. The MAG gels were then poured into 4 ml tissue equivalent polystyrene cuvettes of inner dimensions 1 cm x 1 cm x 4.5 cm ( width x length x height ) with the top sealed by a parafilm tape. Finally they were wrapped in aluminium foils to avoid any preliminary polymerisation from the ambient light. The
sample vials were stored at 3˚C before irradiation. In this study, both MAGAS and MAGAT polymer gel used the
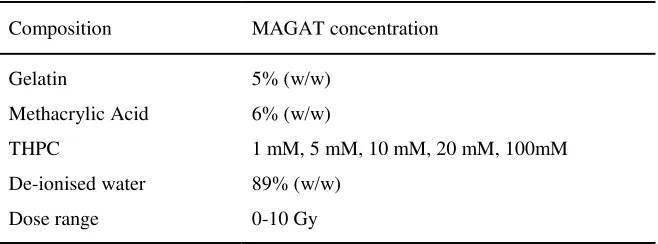
concentration of gelatin 5% (w/w), ascorbic acid 10 mM and at 10 mM THPC. These concentrations were obtained from our previous study where optimisation of gelatin, ascorbic acid and THPC has been done and the optimised values of the compositions are shown in the Table 1. The concentrations of methacrylic acid had varied from 4 %( w/w) to 9 %( w/w) to obtain the optimum dose response with respect to the MRI signal. After the optimum concentrations were obtained, the MAGAT gel had varied the concentration of THPC to investigate the effect of THPC variation towards the dose response as shown in Table 2.
Table 1. MAGAS and MAGAT gel compositions according to their concentration
Composition MAGAS MAGAT
Table 2. MAGAT gel composition with variation of THPC concentrations
426
Figure 1. The fabrication of normoxic MAG dosimeter
Irradiation of gel dosimeter
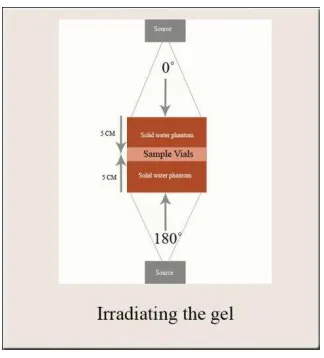
Irradiations were performed using a 6 MV photon beam by a linear accelerator (Primus LINAC, Siemens), with a field size of 10 cm x 10 cm at the isocentre and at 100 cm source axis distance (SAD). The dose rate was 3 Gy min-1. The samples were irradiated from 0 to 20 Gy by parallel opposed beams so that the gels received a uniform dose at 5 cm depth. One sample of each batch is left unirradiated for background measurement. Solid water phantom slabs were placed above and below the Perspex cuvette holder and the samples were placed at the midregion of the phantom as shown in Figure 2. For THPC concentrations study, the gels were irradiated from 0 to 10 Gy.
427 MRI Imaging technique
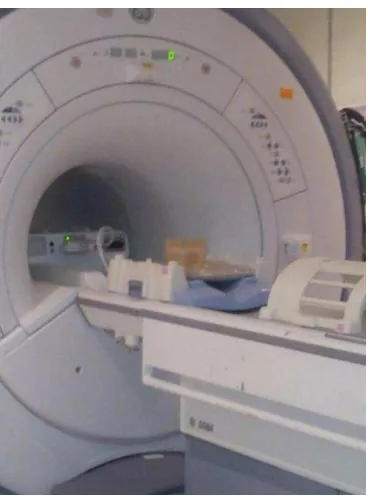
All the sample vials were inserted in a dedicated styrofoam holder and placed in a MRI Signa HDxt 1.5 T whole body scanner using a head coil as shown in Figure 3. The imaging sequence was a single spin-echo sequence with time echoes of TE1=20 ms and TE2= 300 ms and a relaxation time (TR) of 3500 ms. The other scanning parameters
used such as NEX = 3, slice thickness = 5 mm, slice spacing = 0 mm, FOV = 22 mm, flip angle = 90˚ and matrix
size 512 x 256. TE1 and TE2 gave a SNR of 125 % and 128% respectively. Coronal images through the centre of the entire set of calibration vials were acquired and recorded. The T2 dicom images were transferred to a personal computer and analyzed using MATLAB 7.1 (Math Works, Inc.) software. From the time series of T2-weighted images (TE=20 ms, and TE=300 ms), R2-maps were calculated from these images for each sequence pixel by pixel basis using pixel signal intensities and applying the two-point method [11].
(Eq. 1)
The two-point method; where S1, S2 is the measured MR signal intensity at a given echo time, TE and R2 is the
transverse relaxation rate.
R2 maps can be converted to dose maps using a linear dose response equation that has been reported by several independent investigators [15, 19, 20].
(Eq.2)
Linear dose response equation: where α is the slope of the dose–R2 curve, Ro is R2 background and R2 is R2 value
of the irradiated gel.
428
Results and Discussion
MAGAS and MAGAT polymer gel dose-response with varying MAA compositions
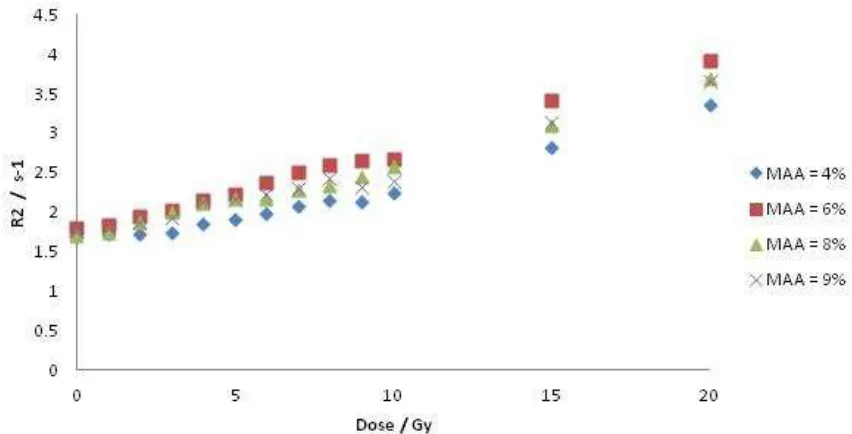
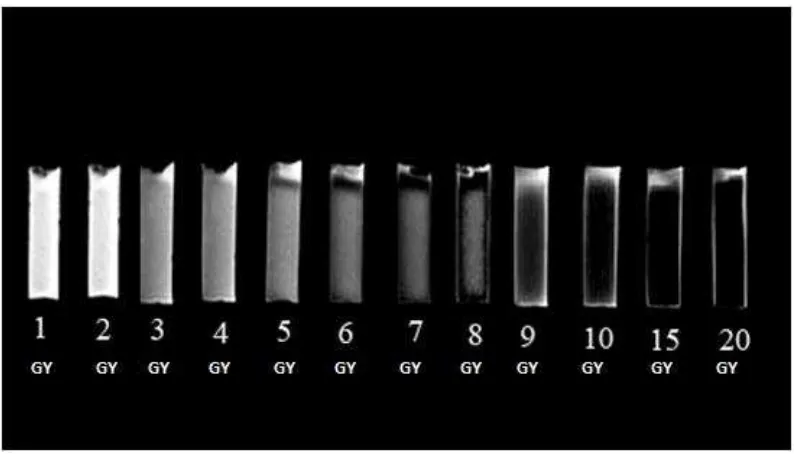
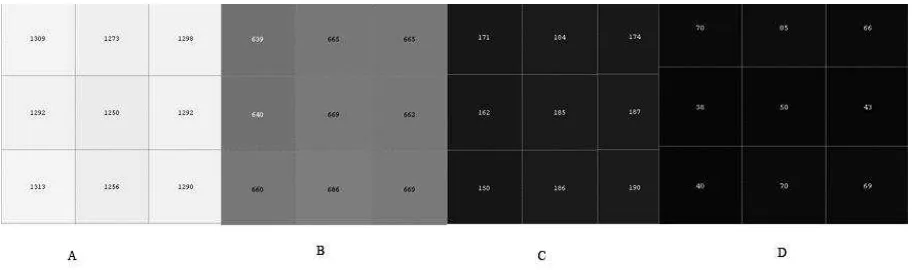
Figure 4 and Figure 5 illustrate the transverse relaxation rate (R2) as a function of the absorbed dose (D) for MAGAS and MAGAT dosimeter at different concentrations of MAA. The absorbed doses selected were from 0 to 20 Gy. For MAGAS gel, the transverse relaxation rates (R2) were linearly proportional to the dose up to 20 Gy (Figure 4). R2 is obtained from the nuclear magnetic resonance (NMR) signal which is dose dependent. In polymer gel dosimeter, R2 value is rely on amount of polymer formed within the gel dosimeter after irradiated. As the dose increased, the formation of polymer increased therefore R2 increased. This linear dose response was maintained even though the MAA concentrations were increased. While for MAGAT gel, R2 were linearly proportional to the dose up to 10 Gy only (Figure 5). This linear dose response was maintained even though the MAA concentrations were increased. However between 10 to 20 Gy dose ranges, the response was change in slope due to the saturation of the gel at high dose range. As obtained from T2 weighted image of our study (Figure 6 and Figure 7), as the dose increased from 0 to 20 Gy, the pixel value decreased. This is due to the rapid attenuation of signal intensity at high energy of photon (high dose) after irradiation, caused an increased in polymer formation in gel dosimeter thus drop the pixel value (T2-weighted image become darker due to high formation of polymer in gel dosimeter). At high dose (15 to 20 Gy), maximum polymerization occurs which causes a small change in the pixel intensity and later results in the signal being saturated.
The linear and the non-linear ranges depend on the type of polymer gel dosimeter. The R2-dose response of the MAGAT polymer gel dosimeter was found to be higher than that of MAGAS gel dosimeter, which is prepared with AscA in place of THPC. The results showed that anti-oxidant plays an important role that will affect the dose response of the gel.
429 Figure 5. Transverse relaxation rate (R2) as a function of absorbed dose (D) for MAGAT gel dosimeter of 5%
gelatin for varying concentrations of MAA irradiated from 0 to 20 Gy
430
Figure7. The pixel value of T2-weighted image according to Fig. 6 at different dose. (A) 1 Gy, (B) 5 Gy, (C) 10 Gy, (D) 15 Gy.
The dose sensitivity is defined as the slope of the dose response curve ([ ]). The linear fit (R2 = αD + R0)
between R2 and the dose region of 0 to 10 Gy, provided the values of dose sensitivity (α) and the offset (R0). For
the MAGAS and MAGAT polymer gel dosimeter used in this study, it was found that the optimal concentration of MAA that produced the highest changes in R2-dose response was 6% (w/w) MAA and 5% (w/w) gelatin as shown in Table 3. From the study using Single spin echo sequence, the MAGAT gel has a sensitivity of 1.1180 s-1Gy-1 with a linear regression of 0.9957. However studies from Multiple spin echo sequence showed MAGAT gel has a sensitivity of 3.42 s-1Gy-1 [21] and 3.2 s-1Gy-1 [22]. On the other hand, from Single spin echo sequence study MAGAS gel exhibits 10 times lower dose sensitivity of 0.0989 s-1Gy-1 with a linear regression of 0.9856 whereas study from Multiple spin echo sequence showed MAGAS gel has a sensitivity of 0.50 s-1Gy-1 [23]. Although the sensitivity of MAGAS gel is low compared to MAGAT gel dosimeter but the presence of an AscA is sufficient to prevent oxygen from inhibiting the polymerization of the polymer gel dosimeter. Hence MAGAT gel is considered as the most standard gel dosimeter with superior sensitivity and dose resolution [22, 24, 25]. From this study, the sensitivity of Single spin echo sequenceis much lower than Multiple spin echo sequencestudy, but its sensitivity is much higher than the other type of gel [22].
The sensitivity of MAGAT gel increment depends on the MAA concentrations. An increase in MAA concentrations from 4% to 6% lead to an increase in R2-dose response. After the maximum polymerization occurred at 6% of MAA, the R2 dose response starts to decrease with the increasing of MAA from 8% to 9%. Higher concentrations of MAA associate with more acrylic monomers available for the polymerization reaction. The rate of polymerization within a certain polymer gel dosimeter is determined by temperature, monomers concentration, gelatin concentration and other elements in gel dosimeter recipe. Thus, different concentrations of MAA will produce different rates of polymerization, hence it may vary the R2-dose response and sensitivity of the polymer gel dosimeter.
Table 3. The dose sensitivity and the linear regression of MAGAS and MAGAT gel at various concentration of MAA at doses 0 – 10 Gy.
MAGAS MAGAT
MAA concentration Sensitivity/s-1 Gy-1 R2 Sensitivity/s-1 Gy-1 R2
4% 0.0594 0.9692 0.3156 0.9917
6% 0.0989 0.9856 1.1180 0.9957
8% 0.0841 0.9805 0.8961 0.9888
431 Effect of varying THPC concentrations on dose response
MAGAT polymer gel dosimeters with THPC concentrations between 5 to 10 mM produced the greatest R2 sensitivity as shown in Figure 8. A threshold concentration of 1mM THPC was found to be required for an adequate R2-dose response to avoid inhibition of polymerization. A small decrease in the dose sensitivity was observed after increasing the concentrations of THPC from 20 mM to 100 mM THPC thus 10mM of THPC gave the best sensitivity. This indicated that THPC may also act as a promoter of the polymerization reaction [11].
Figure 8. The dose sensitivity of MAGAT gel at different concentrations of THPC
Conclusion
We have investigated role of antioxidant in a MAG gel dosimeter system composed of MAA, gelatin and two different anti-oxidants using single spin echo sequence MRI. The formulation that provided the greatest change of R2 is from MAGAT gel composed of 10mM THPC, 6% MAA and 5% gelatin with the sensitivity 1.1180 (s-1 Gy-1). Whilst MAGAS gel shows 10 times lower in dose sensitivity compared to MAGAT gel. The sensitivity of MAGAT and MAGAT gel obtained from single spin echo sequence study is much lower than multiple spin echo sequence study.
Acknowledgement
432
References
1.
Maryanski, M.J., Gore, J.C., Kennan, R.P. & Schulz, R.J. (1993 ). NMR relaxation enhancement in gels polymerized and cross-linked by ionizing radiation: a new approach to 3D dosimetry. MRI Magn. Reson. Imaging, 11: 253–258.2.
Day, M.J., Andrews, H.L., Murphy, R.E. & Lebrun, E.J. (1957). Gel dosimeter for depth dose measurements. Review of Scientific Instruments, 28: 329–332.3.
Day, M.J. and G. Stein. (1950). Chemical effects of ionising radiation in some gels. Nature, 166: 146–147.4.
Doran, S.J., K.K. Koerkamp, M.A. Bero, P. Jenneson, E.J. Morton, and W.B. Gilboy. (2001). A CCD-basedoptical CT scanner for high-resolution 3D imaging of radiation dose distributions: equipment specifications, optical simulations and preliminary results. Phys. Med. Biol., 46: 3191–3213.
5.
Doran, S.J. (2013). How to perform an optical CT scan: an illustrated guide. Journal of Physics: Conference Series, 444 (1): 012004.6.
Jirasek, A. (2010). Alternative imaging modalities for polymer gel dosimetry. Journal of Physics: Conference Series, 250: 012070.7.
Baldock, C., Y. De Deene, S. Doran, G. Ibbott, A. Jirasek, M. Lepage, K.B. McAuley, M. Oldham, and L.J. Schreiner. (2010). Polymer gel dosimetry. Phys. Med. Biol., 55 p. R1–R638.
Doran, S.J. (2010). Imaging and 3-D dosimetry: top tips for MRI and optical CT. Journal of Physics: Conference Series, 250(1): 012086.9.
Low, D.A., J. Markman, J.F Dempsey, S. Mutic, M. Oldham, R. Venkatesan, E.M. Haacke, and J.A. Purdy. (2000.). Noise in polymer gel measurements using MRI. Med. Phys., 27: 1814-1817.10.
De Deene, Y., R. Van de Walle, E. Achten, and C. De Wagter. (1998). Mathematical analysis and experimental investigation of noise in quantitative magnetic resonace imaging applied in polymer gel dosimetry. Sig Proc., 70:. 85-101.11.
De Deene, Y. and C. Baldock. (2002).Optimization of multiple spin-echo sequences for 3D polymer gel dosimetry. Phys. Med.Biol., 47: 3117-3141.12.
Baldock, C., M. Lepage, S. Back, P. Murry, P. Jayasekera, D. porter, and T. Kron. (2001). Dose resolution in radiotherapy polymer gel dosimetry: effect of echo spacing in MRI pulse sequence. Phys. Med. Biol., 46: 449-460.13.
Maryanski, M.J., R.J. Schulz, G.S. Ibbotq, J.C. Gatenby, J. Xiell, D. Hortonq, and J.C. Gore. (1994). Magnetic resonance imaging of radiation dose distributions using a polymer-gel dosimeter. Phys. Med. Biol., 39: 1437-1455.14.
Hepworth, S.J., M.O. Leach, and S. Dorran. (1999). Dynamics of polymerisation in polyacrylamide gel (PAG) dosimeters: (II) modelling oxygen diffusion. Phys. Med. Biol., 440: 3105 -3113.15.
Maryanski, M.J., G.S. Ibbott, P. Eastman, R.J. Schulz, and J.C. Gore. (1996). Radiation therapy dosimetry using resonance imaging of polymer gels. Med. Phys., 23: 699–705.16.
Baldock, C., R.P. Burford, N. Billingham, G.S. Wagner, S. Patval, R.D. Badawi, and S.F. Keevil. (1998). Experimental procedure for the manufacture and calibration of polyacrylamide gel (PAG) for magnetic resonance imaging (MRI) radiation dosimetry. Phys. Med.Biol., 43: 695-702.17.
Fong, P.M., D.C. Keil, M.D. Does, and J.C. Gore. (2001). Polymer gels for magnetic resonance imaging of radiation dose distributions at normal room atmosphere. Phys. Med. Biol., 46: 3105–3113.18.
De Deene, Y., C. Hurley, A. Venning, K. Vergote, M. Mather, B..J Healy, and C. Baldock. (2002). A basic study of some normoxic polymer gel dosimeters. Phys. Med. Biol., 47 p. 3441–3463.19.
Ibbott, G.S., M.J. Maryanski, P. Eastman, S.D. Holcomb, Y.S. Zhang, R.G. Avison, M. Sanders, and J.C. Gore. (1997). 3D visualization and measurement of conformal dose-distributions using MRI of BANG-gel dosimeters. Int.J. Radiat. Oncol. Biol. Phys., 38: 1097–1103.20.
Oldham, M., I.B. Baustert, C. Lord, T.A.R. Smith, M. McJury, M. Leach, A.P. Warrington, and S. Webb. (1998). An investigation into the dosimetry of a 9 field tomotherapy irradiation using BANG-gel dosimetry. Phys. Med. Biol., 43: 1113–1132.433 polymer gel dosimetry with MSE MR imaging. Nuclear Instruments and Methods in Physics Research B, 266: 2199–2202.