TIME SERIES CHARACTERISTIC ANALYSIS OF RAINFALL, LAND USE AND FLOOD
DISCHARGE BASED ON ARIMA BOX-JENKINS MODEL
Abror
Public Works Office of Tegal Regency Email: [email protected]
ABSTRACT
Indonesia located in tropic area consists of wet season and dry season. However, in last few years, in river discharge in dry season is very little, but in contrary, in wet season, frequency of flood increases with sharp peak and increasingly great water elevation. The increased flood discharge may occur due to change in land use or change in rainfall characteristic. Both matters should get clarity. Therefore, a research should be done to analyze rainfall characteristic, land use and flood discharge in some watershed area (DAS) quantitatively from time series data.
The research was conducted in DAS Gintung in Parakankidang, DAS Gung in Danawarih, DAS Rambut in Cipero, DAS Kemiri in Sidapurna and DAS Comal in Nambo, located in Tegal Regency and Pemalang Regency in Central Java Province. This research activity consisted of three main steps: input, DAS system and output. Input is DAS determination and selection and searching secondary data. DAS system is early secondary data processing consisting of rainfall analysis, HSS GAMA I parameter, land type analysis and DAS land use. Output is final processing step that consisting of calculation of Tadashi Tanimoto, USSCS effective rainfall, flood discharge, ARIMA analysis, result analysis and conclusion. Analytical calculation of ARIMA Box-Jenkins time series used software Number Cruncher Statistical Systems and Power Analysis Sample Size (NCSS-PASS) version 2000, which result in time series characteristic in form of time series pattern, mean square errors (MSE), root mean square ( RMS), autocorrelation of residual and trend.
Result of this research indicates that composite CN and flood discharge is proportional that means when composite CN trend increase then flood discharge trend also increase and vice versa. Meanwhile, decrease of rainfall trend is not always followed with decrease in flood discharge trend. The main cause of flood discharge characteristic is DAS management characteristic, not change in rainfall characteristic.
Keywords: rainfall, land use, flood discharge, time series, main cause
1 INTRODUCTION
During recent few years, when rainy season comes, flood occurs in almost whole area of Indonesia. Flood occurs in Java Island, Bali Island, Kalimantan Island, Sulawesi Island, Nusa Tenggara Island, Maluku Island, and Irian Jaya Island. High discrepancies of people and the area of each region cause flood in Java Island tend to have bigger impact than the other islands (Kodoatie and Syarief, 2006).
Flood is usually related to the critical watershed having unworthy land for water management (Ministry of Forestry Regulation, 2005). In 1984, approximately 22 watersheds were critical and it was increased up to 39 watersheds in 1992. The number increased about 62 critical watersheds in 2005 in which spread a whole region of Indonesia, i.e. Java, Sumatera, Kalimantan, Sulawesi, Bali, Nusa Tenggara, Maluku, and Irian Island (Ministry of Public Works, 2006). Several criteria used to define critical watersheds are based on percentage of land cover, slope erosion, and management (Ministry of Forestry Regulation, 2005). However, the main cause of flooding has not been
character changes. It is important to study both flood causes in order to gain clear view in term of the main cause of flooding.
The aims of this research are to know the characteristic of rainfall time series, land use, and watershed flood discharge quantitatively including time series pattern, autocorrelation of residual, mean square error (MSE), root mean square (RMS), and data trend so that the main cause of flooding can be determine. The result is expected to give useful information to local government, particularly some relevant institutions.
2 LITERATURE REVIEW
There are several methods which can be used for time series analysis. One of the methods is ARIMA model
(Autoregressive Integrated Moving Average)
than one month period, either in normal or dry condition (Loebis et al., 2003). Time series approached by ARIMA Box-Jenkins model was in accordance with flow discharge of Zayandehrud River in Istafahan, Iran (Modarres et al., 2006). Recorded data of flow discharge in South of German which was approached by ARIMA model can predict the seasonal, fractional, and seasonal-fractional data (Rust et al., 2004).
3 RESEARCH METHODS
3.1 Location
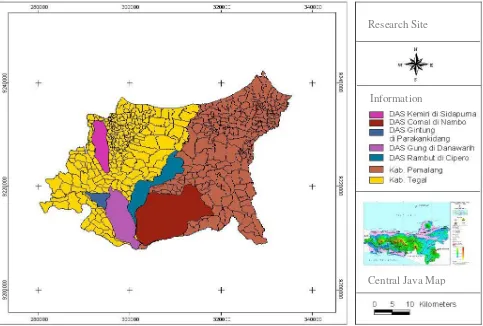
The research is carried out in five watersheds (DAS) included DAS Kemiri at Sidapurna, DAS Gintung at Parakankidang, DAS Gung at Danawarih, DAS Rambut at Cipero, and DAS Comal at Nambo. Those watersheds belong to Pemali Comal River Basin which were spread in Tegal and Pemalang Regency, Central Java Province. The areas of each watershed are 51.56 km2, 18.17 km2, 94.29 km2, 84.18 km2, and 233.89 km2, respectively. The research location is presented in Figure 1.
3.2 The Availability Data
The research used several data as listed below:
a. Daily rainfall data based on rainfall station of each watershed recorded from 1987 until 2007.
b. Land use area of Tegal and Pemalang Regency from 1987 to 2007 based on BPS (Central Agency on Statistics) Tegal, BPS Pemalang, and BPS Central Java Province
c. Digital map of Pemali Comal River Basin in 2003. d. RBI digital map of Tegal and Pemalang Regency
in 2001.
3.3 Research Steps
In general, the research was conducted through several steps as follow:
a. Input. This step includes determining and selecting the referred watershed and its secondary data. b. Watershed system. It is an initial processing of
secondary data included rainfall analysis, Synthetic Unit Hydrograph (SUH) of GAMA I, soil characteristic and land use analysis.
c. Output. It is the final processing comprising rainfall distribution obtained by Tadashi Tanimoto method, SUH of GAMA I, SCS CN, flood hydrograph, time series analysis (rainfall, CN composite, flood discharge), the results of analysis and conclusion.
Research Site
3.4 Analysis Approach
The analysis was applied the following approach:
a. Hydrology analysis. It consists of arithmetic mean rainfall, rainfall distribution using Tadashi Tanimoto method, SUH of GAMA I, effective rainfall from SCS-CN analysis, and flood hydrograph analysis.
b. Time series analysis by using ARIMA Box-Jenkins. Time series characteristic, such as time series pattern, mean square error (MSE), root mean square (RMS), autocorrelation of residual, and data trend can be obtained from the result of data processing which includes mean of maximum rainfall, CN composite of the watershed, flood discharge within 20 years.
c. The used software was Microsoft Office, ArcView, MapInfo, and NCSS-PASS.
4 RESULTS AND DISCUSSION
4.1 Watershed Rainfall
Mean rainfall of the watershed causing flood within one year was assumed to have the maximum value of the mean rainfall as illustrated in Figure 2.
Figure 2. Maximum of mean rainfall during 1987-2006.
4.2 Rainfall Distribution
All of the watersheds do not have both rainfall station (Automatic Rainfall Recorder) and water level station (Automatic Water Level Recorder) so that rainfall distribution was created by synthetic rainfall distribution approach. Tadashi Tanimoto method was chosen since those watersheds were located in Java Island. Furthermore this method has smaller error that ABM distribution (Sukoso, 2004).
On Tadashi Tanimoto distribution, rainfall distribution within 8 hours with rainfall depth for every hour has been determined as shown in Table 1.
Table 1. Distribution rainfall using Tadashi Tanimoto method
4.3 Soil Characteristic and Curve Number (CN)
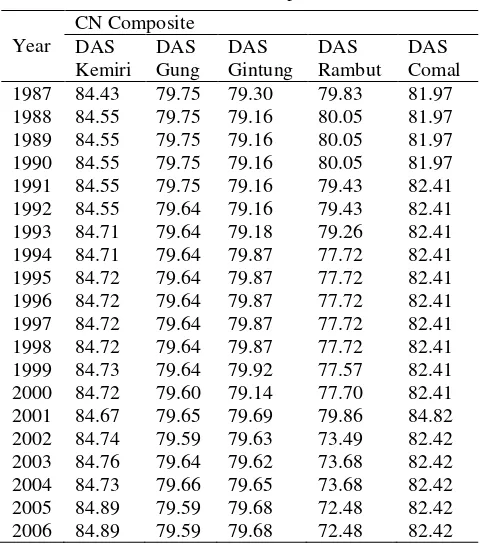
Value of CN composite within given year is calculated by totalize multiplication between land use CN and converted area. Conversion factor was estimated by comparing the watershed area based on RBI 2001 to the watershed area based on Regency in Figures 2001. By calculating CN composite during 1987-2006, time series of CN composite can be obtained. Each watershed has difference time series motion as shown in Table 2.
Table 2. CN composite Year
4.4 Synthetic Unit Hydrograph (SUH)
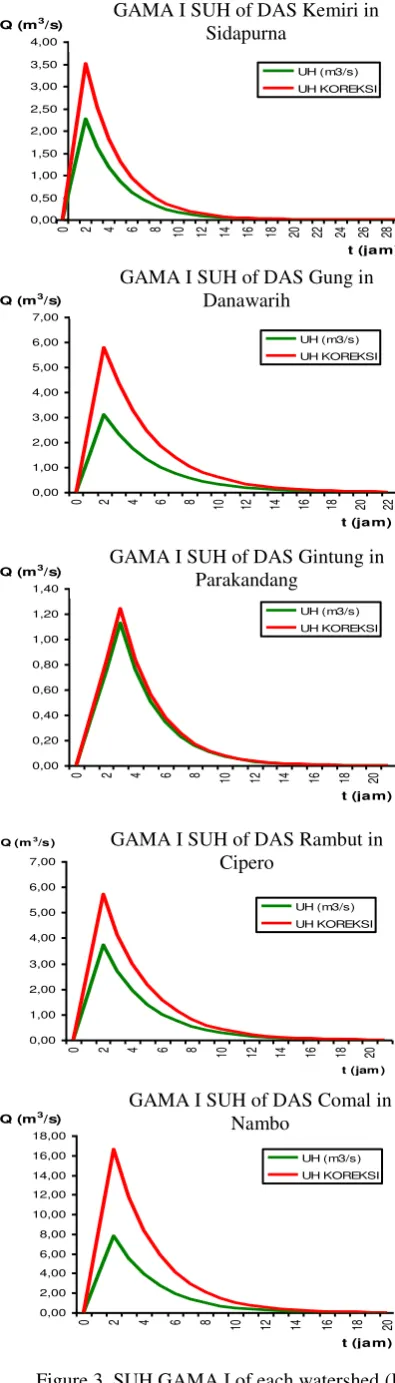
Differences between calculated and corrected SUH of GAMA I can be seen at DAS Kemiri, DAS Gung, DAS Rambut, and DAS Comal, while calculated GAMA I SUH of DAS Gintung was in accordance with the corrected one (see Figure 3). The higher ratio between area (A) and slope (S) parameter, the higher discrepancy between calculated and corrected GAMA I SUH.
1987 1989 1991 1993 1995 1997 1999 2001 2003 2005
4.5 Flood Hydrograph and Flood Discharge
After obtaining maximum rainfall value, rainfall distribution, SUH GAMA I, and CN composite, effective rainfall was analyzed using SCS-CN method. Polynomial method was used for creating flood hydrograph. Referring to the flood hydrograph, flood hydrograph peak for each year can be obtained as presented in Figure 4.
Figure 4. Flood discharge during 1987-2006.
4.6 Time Series of Maximum Mean Rainfall, CN Composite, and Flood Discharge
Time series characteristic can be determined from quantity analysis of time series using ARIMA Box-Jenkins method with NCSS-PASS 2000 version help (NCSS Statistical and Power Analysis Software., 2007). The analysis was carried out through trial and error until the suitable time series model was resulted in which ARIMA model was accepted from the Portmanteau Test with probability level for every time lag was more than 0.05. Detail of the time series model was explained in Table 3, Table 4, and Table 5.
4.7 Correlation between Rainfall and Flood Discharge
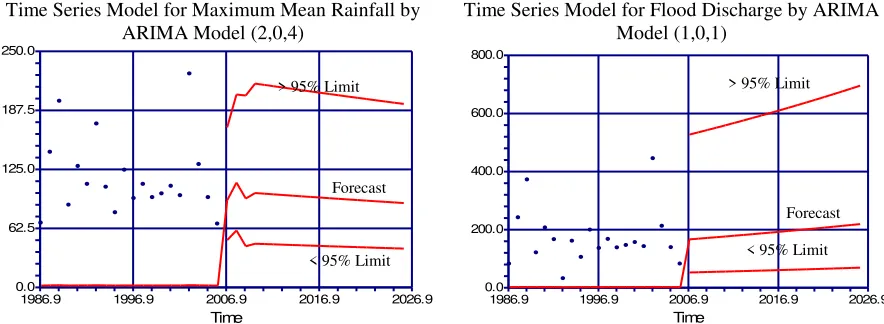
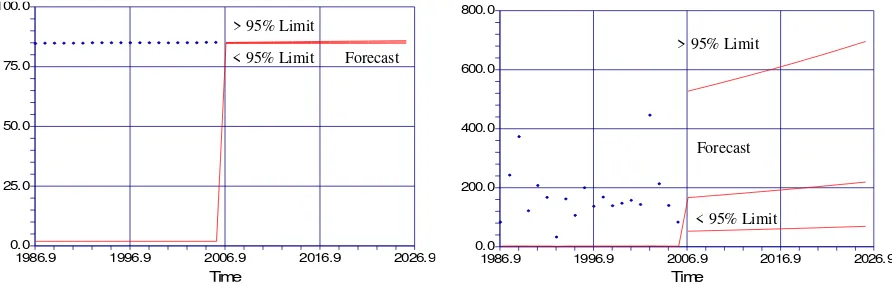
A trend line created from time series of maximum mean rainfall at DAS Kemiri tends to decrease, while it is increased on a trend line created from maximum flood discharge. Thus, rainfall apparently does not affect the increase of flood discharge, in the case of DAS Kemiri (see in Figure 5).
4.8 Correlation between Land Use and Flood Discharge
A trend line created from time series of CN composite and maximum flood discharge at DAS Kemiri tends to increase. It indicates the effect of CN composite towards the increase of flood discharge as shown in Figure 6.
HSS GAM A I DAS KEM IRI DI SIDAPURNA
0,00
HSS GAM A I DAS GUNG DI DANAWARIH
0,00
HSS GAM A I DAS GINTUNG DI PARAKANKIDANG
0,00
1987 1989 1991 1993 1995 1997 1999 2001 2003 2005
Table 3. Time series model for maximum of mean rainfall
Watershed Stationary Pattern Unstationary Pattern Information DAS Kemiri (2,0,4) AR order 2, MA order 4 (0,1,1) AR order 1 Approved
DAS Gung (1,0,1) Random (2,1,0) AR order 2 Approved
DAS Gintung (1,0,2) AR order 1, MA order 2 (0,1,2) MA order 2 Approved DAS Rambut (1,0,2) AR order 1, MA order 2 (0,1,1) MA order 1 Approved DAS Comal (2,0,1) AR order 2, MA order 1 (0,1,1) MA order 1 Approved
Table 4. Time series model for CN composite
Watershed Stationary Pattern Unstationary Pattern Information DAS Kemiri (1,0,0) AR order 1 (0,1,0) Random Approved
DAS Gung (1,0,0) AR order 1 (0,1,0) Random Approved
DAS Gintung (1,0,0) AR order 1 (0,1,0) Random Approved DAS Rambut (1,0,0) AR order 1 (0,1,0) Random Approved DAS Comal (1,0,1) AR order 1, MA order 1 (1,1,0) AR order 1 Approved
Table 5. Time series model for flood discharge
Watershed Stationary Pattern Unstationary Pattern Information DAS Kemiri (1,0,1) AR order 1, MA order 1 (0,1,1) MA order 1 Approved DAS Gung (1,0,1) AR order 1, MA order 1 (0,1,1) MA order 1 Approved DAS Gintung (2,0,2) AR order 2, MA order 2 (0,1,2) MA order 2 Approved DAS Rambut (1,0,2) AR order 1, MA order 2 (0,1,2) MA order 2 Approved DAS Comal (2,0,1) AR order 2, MA order 1 (0,1,1) MA order 1 Approved
Time Series Model for Maximum Mean Rainfall by ARIMA Model (2,0,4)
Time Series Model for Flood Discharge by ARIMA Model (1,0,1)
Figure 5. Comparison between trend of rainfall time series and maximum mean rainfall.
Time Series Model for CN Composite by ARIMA Model (1,0,1)
Time Series Model for Flood Discarge by ARIMA Model (1,0,1)
0.0 62.5 125.0 187.5 250.0
1986.9 1996.9 2006.9 2016.9 2026.9 Time
0.0 200.0 400.0 600.0 800.0
1986.9 1996.9 2006.9 2016.9 2026.9 Time
LO
G
10(
C
2)
-T
R
E
N
D
> 95% Limit > 95% Limit
< 95% Limit < 95% Limit
Forecast
Figure 6. Comparison between trend of CN composite time series and flood discharge at DAS Kemiri
4.9 Flood Main Cause Parameter
Based on the results, characteristic of maximum mean rainfall does not always affect flood discharge characteristic (referring to the transformed discharge, not the measured one) as presented in Figure 5. Land use characteristic affects flood discharge characteristic dominantly (referring to the transformed discharge, not the measured one) as presented in Figure 6. Hence, the main factor causing flood discharge changes (referring to the transformed discharge, not the measured one) is watershed land use, or bad watershed management.
5 CONCLUSIONS
Some conclusions can be summarized below:
a) Difference watershed location makes different time series of maximum rainfall as resulted by ARIMA model.
b) AR, MA, ARMA, or ARIMA trend for time series rainfall, CN composite, and flood discharge (referring to the transformed discharge, not the measured one) is not random.
c) Autocorrelation of residual from ARIMA model resulted positive and negative value for different time lag. It shows non-stationary time series characteristic.
d) Changes in flood characteristic is mainly caused by land use characteristic, or bad watershed management, while rainfall characteristic does not always affect flood characteristic (referring to the transformed discharge, not the measured one).
6 RECOMMENDATIONS
The results of research may give recommendation for further study in order to obtain the better result. The recommendations are summarized below:
a) Local government should have sufficient data
use, and soil characteristic in order to get the result which is close to the real condition.
b) Since CN composite tends to increase, RTRW (Spatial Plan) and RDTRK (Detailed Spatial Plan of District) issued by local government should be in accordance with watershed characteristic and follows the regulations, and also concern to the environmental aspect.
REFERENCES
Junaidi. (2004). ”Evaluasi Kemampuan Prediksi Model Box-Jenkins pada Karakteristik Laba Tahunan”.
Thesis Report, UGM, Yogyakarta.
Kodoatie, R.J., and Sjarief R. (2006). Pengelolaan Bencana Terpadu: Banjir, Longsor, Kekeringan, dan Tsunami [Integrated Disaster Management: Flood, Landslide, Drought, and Tsunami]. Yarsif Watampone, Jakarta.
Loebis, J., and Syariman, P. (2000). Water Resources Management for Three Series Reservoir Operation on Citarum River Basin West Java Indonesia, Research Institute of Water Resources, Bandung [online]. Retrieved January 21, 2009 from http://www.melsa.net.id
Makridakis, S., McGee, V.E., and Wheelwright, S.C. (1983). Forecasting, John Wiley & Sons Inc., U.K.
Ministry of Forestry. (2009). “Peraturan Menteri Kehutanan tentang Tata Cara Penyusunan Rencana Teknik Rehabilitasi Hutan dan Lahan
Daerah Aliran Sungai” [Ministry of Forestry Regulation about Technical Procedures for Forest and Land Rehabilitation Plan over Watershed]. Decree, Ministry of Forestry.
Ministry of Public Works. (2006). Buku Pintar [Smart
0.0 25.0 50.0 75.0 100.0
1986.9 1996.9 2006.9 2016.9 2026.9 Time
Modarres, R., and Eslamian., S. (2006). “Stream flow Time Series Modeling of Zayandehrud River”.
Iranian Journal of Science & Technology, Transaction B, Engineering, Vol. 30, No. B4, Shiraz University, Iran.
NCSS Statistical and Power Analysis Software. (2007).
Forecasting and Time Series Analysis, [online].
Retrieved February 9, 2009 from
http://www.ncss.com.
Rust, H., Kallache, M., and Kropp, J. (2004).
“Comparison of Different Fractional ARIMA Type Models Applied to River Discharge Records from Southern Germany with Respect to
Long Memory”. Geophysical Research
Abstracts, Vol. 6, 03744, European Geosciences Union, Germany.
Sukoso, E. (2004). “Perbandingan Tingkat Ketelitian