STUDY ON THE OPTIMUM FLUSHING VOLUME OF THE SEWER SYSTEM IN
SOUTH TANGERANG CITY
Maudi Larasati Marsudi, T. Tazkiaturrizki, W. Winarni*
Environmental Engineering, Faculty of Landscape Architecture and Environmental Engineering, Universitas Trisakti Jakarta, 11440, Indonesia
*Corresponding author: [email protected]
ABSTRACT
Aims: This planning aims to obtain the optimum flush volume on the design of sewerage in South Tangerang City. Methodology and results: Factors affecting this flushing are the length of pipelines, the service area, and topographic conditions. The sewer drain that needs flushing is Line 1–WWTP since the minimum velocity is not eligible due to its relatively low average topographic slope. The flushing is required particularly for the Section 1–2. Hence, two alternatives were devised by dividing the Population Equivalent (PE) in Section 1–2 into three segments. Those alternatives were differentiated by the PE—20%, 5%, and 75% for Alternative 1; whereas 10%, 15%, and 75% for Alternative 2. Alternative 1 requires flushing on Section 1–1.1 since it has a dmin of 7 cm and vmin of 0.2585 m/s, yielding a flush volume of 3.94 m3 (0.0193 m3/s).Section 1.1– 1.2still needs flushing because this channel has a vmin of 0.4281 m/s and a qualified dmin of 15 cm, generating a flush volume of 7.89 m3 (0.2113 m3/s). Flushing is not necessary for Section1.2–2due to its sufficient d
min of 63 cm and vmin of 0.88 m/s. Alternative 2 requires flushing on Section 1–1.1since it has a dmin of 7 cm and a vmin of 0.2585 m/s, resulting in a flush volume of 2.63 m3 (0.0193 m3/s). Section 1.1–1.2 still requires flushing on account of its vmin of 0.3877 m/s and the yielded flush volume of 18.4 m3 (0.2625 m3/s), though its d
min of 13 cm complies with the standard.Section1.2–2does not need flushing as it already has a dmin of 63 cm and a vmin of 0.88 m/s. The total flush volumes for Alternative 1 and Alternative 2 are11.83 m3and 21.04 m3, respectively. Conclusion, significance, and impact of the study: The total flush volume for Alternative 1 is 11.83 m3, while Alternative 2 is 21.04 m3. Thus, the optimum design having the least flush volume is Alternative 1.
1.
INTRODUCTION
South Tangerang City is one of the regions that serve as the buffer for DKI Jakarta and grow
rapidly. Currently, South Tangerang City has a unit of Wastewater Treatment Plant (WWTP)
located in the Techno Park industrial area, Setu Subdistrict, that specifically serves the needs of
the industries within the area. On the other hand, household wastewater management in South
Tangerang City is quite poor at this time, as grey water derived from the domestic activities are
discharged directly into drainage channels. Therefore, it is highly necessary to devise a proper
sewer system for a better sanitation system.
The sewerage plan of South Tangerang City is designed until 2037 with approximately
projected population of 2,327,596 people. The service coverage in this facility plan is 100%,
comprising 581,899 house connections, while the wastewater flow rate is 3,702.0441 L/sec. The
designed length of the main sewer drain is 37,358 m long with a diameter of 500 mm to 2,100
mm.
The highest elevation throughout South Tangerang City is in Pamulang Sub district of 50–62.5
meters above sea level (MASL); whereas Setu, Serpong, Ciputat, and East Ciputat have an
elevation of 37.5–50 MASL. The lowest elevation is pinpointed in Pondok Aren and North Serpong
sub districts of <25 MASL. The trend of the topographic slope in South Tangerang City leads to
North Serpong Sub district which has the lowest elevation.
The wastewater of South Tangerang City is planned to stream down to one WWTP which has
a flow rate of 3,702.0441 L/sec, located in Paku Alam, North Serpong Sub district. The elevation
of this WWTP is 23 MASL. The master plan of main sewer drains can be seen in Figure 1.
There are five paths to WWTP in this planning of South Tangerang City sewer system, i.e.,
Line 1–WWTP, Line 2–WWTP, Line 3–WWTP, Line 4–WWTP, and Line 5–WWTP, as shown in
Figure 1. Each of these pathways has a different topographic slope. The average topographic
slope of those five lines from their starting points to the plant is 0.00088, 0.00221, 0.00284,
0.00429, and 0.00368, respectively. Among all the five routes, Line 1–WWTP—as seen in Figure
2—has the lowest topographic slope. It results in the ineligibility of both minimum velocity (vmin)
Figure 1 Master plan of the main sewer until 2037
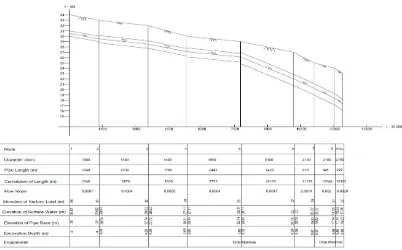
Line 1–WWTP requires flushing on the Section 1–2 due to its low vmin of 0.5004 m/sec (less
than 0.6 m/sec), though its dmin of 19 cm has already met the standard. This ineligible minimum
velocity is induced by the relatively low value of the average topographic slope in Line 1–WWTP
(0.00088). Profiles of the topographic slope and the pipe slant are depicted in the longitudinal
section of Line 1–WWTP (Figure 3).
This article will discuss the calculation of flush volume and flow rate for the sewerage planning
of South Tangerang City. Two alternatives were compared in this study to determine the optimum
one based on the flush volume and flow rate.
Figure 2 Line 1 – WWTP
2.
RESEARCH METHODOLOGY
2.1
Materials
Both alternatives were differentiated based on their service coverage and flow rates. The sewer
that needs flushing is Section 1 - 2. At Point 1, the service area is Block A - which then the
Population Equivalent (PE) was divided into 20%, 5%, and 75% for Alternative 1.The former length
of Section 1–2 of 1,340 m was divided into three sections, i.e., Section 1 - 1.1 (251.25 m), Section 1.1–1.2(83.75 m), and Section 1.2 - 2 (1,005 m). The determination of manhole placements was
based on the South Tangerang City roadmap. Manholes were established near secondary roads
to ensure their convenient connections to the lateral pipes. For Alternative 2, the Population
Equivalent (PE) for Block A was divided into 10%, 15%, and 75% with the former length was
divided into three sections, i.e., Section 1 - 1.1 (167.5 m), Section 1.1 - 1.2 (167.5 m), and Section
1.2–2 (1,005 m).
2.2
Methods
The planning procedure is shown in Figure 4. The method used in this calculation is open-channel
hydraulics for partially full pipe flow. The graph of Design of Main Sewers (Fair et al., 1966) was
used to facilitate this calculation.
2.2.1
Analytical Method
The analytical methods shown in this study are as follows
a. Determining dmin and vmin
Determining dmin/dfull and vmin/vfull was carried out by using Design of Main Sewers graph,
Figure 4 Flowchart of the planning method Do not meet the
requirements
Start
Finish Calculating dmin (> 10 cm) and
vmin (> 0.6 m/sec)
Flushing
Determining dmin/dfull
Calculating df/D
Determining Af/Afull
Calculating Ag, vw, flush volume, and flush flow rate
Meet the requirements
Determining the best alternative with the optimum flush volume and
flow rate Segmenting sewer lines
Determining PE
b. Calculating vw
d. Calculating the flush flow rate (Qf)
𝑄𝑔 = 𝑉𝑊 𝑥 (𝐴𝑓 − 𝐴𝑚𝑖𝑛) (3)
Qg : flush flow rate (m3/s); vw : wave velocity; Af : flush area (m2); A min : minimum area (m2)
3.
RESULTS AND DISCUSSION
The length of pipelines and the service coverage in the preliminary design are still quite large,
inducing a high wastewater flow rate. Consequently, the flush volume is increased. The
topographic conditions of South Tangerang City also contribute to this flush volume increment.
Accordingly, the design modifications of Alternative 1 and Alternative 2 have been devised to
minimize the flush volume and flow rate by reducing the length of sewer lines as well as the
service coverage.
In this planning, flushing is required on line 1, Section 1–2. Hence, two manholes were added
to this route and the service area was segmented into 5%, 20%, and 75% of Population Equivalent
(PE). The determination of these percentages were based on the South Tangerang City roadmap.
These PEs were divided based on the topographic conditions in South Tangerang City. So the
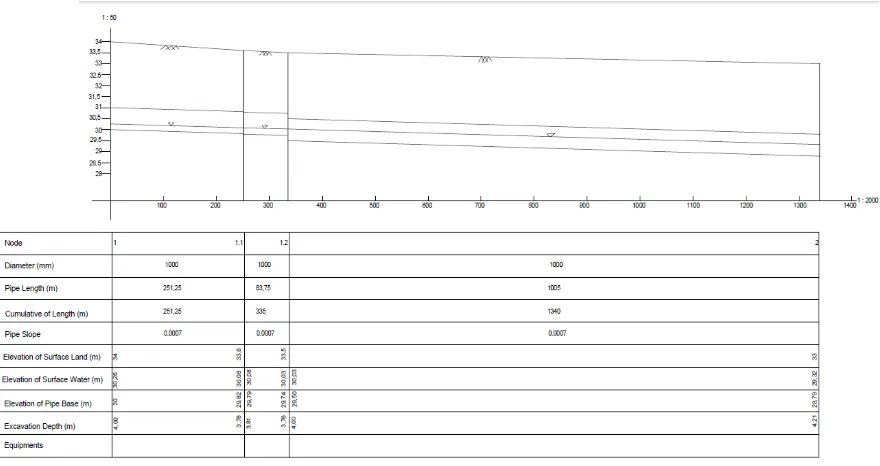
wastewater could flow to the sewer system. Section 1–2 of Alternative 1 and its longitudinal
Figure 5 Section 1–2 of alternative 1
Subsequent to the segmentation of Section 1 - 2, calculations to obtain the minimum flow
rate (Qmin) for each segment were carried out. The minimum flow rate for Section 1 - 1.1 equals
7.62 L/sec, while for Section 1.1 - 1.2 is 9.96 L/sec and for Section 1.2 - 2 is 52.59 L/sec.
The pipe diameter of Section 1–1.1, Section 1.1–1.2, and Section 1.2 - 2 is 1,000 mm with a
slope of 0.0007 each. Flushing is necessary if the minimum depth (dmin) is less than 10 cm and the
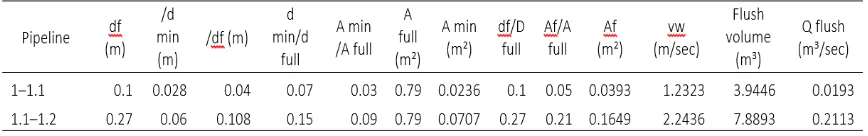
minimum velocity (vmin) is < 0.6 m/sec. Flushing is required for Section 1 - 1.1 due to its ineligible
depth (dmin) of 7 cm (less than 10 cm). Likewise, the minimum velocity (vmin) in this section of only
0.2585 m/sec does not meet the standard of 0.6 m/sec as well. The computation of flush volume
for Section 1 - 1.1 was conducted afterward, generating a value of 3.94 m3 with a flow rate of
0.0193 m3/sec.
Following the flushing on Section 1 - 1.1, the minimum flow rate of the next pathway was
added up to the flush flow rate. However, the minimum velocity in Section 1.1 - 1.2 of
0.4281 m/sec could not comply with the standard, though its minimum depth of 15 cm has been
considered as eligible. Therefore, the flushing is needed for Section 1.1 - 1.2. The obtained flush
volume for this section is 7.89 m3 with a flow rate of 0.2113 m3/sec. The minimum flow rate of
Section 1.2 - 2 was then added up to the flush flow rate.
The results of both the minimum depth and the minimum velocity on Section 1.2 - 2 of
63 cm and 0.88 m/sec, respectively, have met the specified criteria. In summary, the flush volume
required for Line 1 - WWTP of Alternative 1 is 11.83 m3. The detailed calculation can be seen in
Tabel 1 Calculation of flushing determination for alternative 1
Table 2 Calculation of flush volume and flow rate for alternative 1
Similar procedures were performed on Alternative 2. Two manholes were added to this route
and the service area was segmented into 10%, 15%, and 75% of Population Equivalent (PE). Figure
7 shows the scheme of Section 1 - 2, whereas Figure 8 represents its longitudinal section. The
minimum flow rates for Section 1 – 1.1, Section 1.1 – 1.2, Section 1.2 – 2 are 3.32 L/sec, 9.96
L/sec, and 52.59 L/sec, respectively.
The sewer diameter of Section 1 - 1.1, Section 1.1 - 1.2, and Section 1.2 - 2 is 1,000 mm with
a pipe slope of 0.0007 each. The same term of flushing was applied to this alternative - it is
performed if the minimum depth (dmin) is less than 10 cm and the minimum velocity (vmin) is less
than 0.6 m/sec. Section 1 - 1.1 requires flushing since its minimum depth (dmin) of only 7 cm does
not comply with the 10 cm standard. Likewise, its minimum velocity (vmin) of 0.2585 m/sec is not
qualified as well (<0.6 m/sec). Calculations of flush volume and flow rate were then executed
based upon this flushing determination for Section 1 - 1.1, generating values of 2.63 m3 and
Figure 7 Section 1–2 of alternative 2
Table 3 Calculation of flushing determination for alternative 2
Table 4 Calculation of flush volume and flow rate for alternative 2
Following the flushing on Section 1 - 1.1, the minimum flow rate of the next sewer line was
added up to the flush flow rate. Though the minimum depth of Section 1.1 - 1.2 of 13 cm has met
the standard, its minimum velocity of 0.3877 m/sec has not. Thus, the flushing is needed for
Section 1.1 - 1.2. The obtained flush volume for this section is 18.41 m3 with a flow rate of
0.2625 m3/sec. The minimum flow rate of Section 1.2 - 2 was then added up to the flush flow
rate, resulting in the eligible values of minimum depth (63 cm) and minimum velocity
(0.88 m/sec). Hence, the flush volume demand for Line 1 - WWTP of Alternative 2 is 21.04 m3.
The detailed computation is listed in Table 3 and Table 4. The comparison between the
preliminary design and both modifications of Alternative 1 and Alternative 2 can be seen in Table
5 below.
Table 5 Calculation summary for the preliminary design, alternative 1, and alternative 2
Alternative 1 Alternative 2
Population Equivalent (PE) 20%, 5%, 75% 10%, 15%, 75%
Length of pipelines 251.25 m; 83.75 m; 1,005 m 167.5 m; 167.5 m; 1,005 m
4.
CONCLUSION
Among both sewer lines of the sewerage planning of South Tangerang City, Alternative 1 has been
selected as the optimum one due to its lower flush volume requirement for Line 1–WWTP,
compared with Alternative 2. The flush volume required for Alternative 1 is 11.83 m3, whereas
the amount needed for Alternative 2 equals to 21.04 m3, respectively. The best pathway is based
upon the least flush volume requirement since it economizes the demand of the pump capacity
to deliver the flush water from the tank truck to the flush structure. The lower flush water
expense lessens the operational and maintenance costs as well.
5.
REFERENCES
Arsyad, M. 2016. Perencanaan Sistem Perpipaan Air Limbah Kawasan Pemukiman Penduduk.
Jurnal Ilmiah Media Engineering, 6 (1): 406–412.
Calvin, K. 2009. Flushing Periode of Sewer System. Journal of Environmental Engineering. 234 (9): 124–132.
Howard, G. 2009. Design of Manhole Placement. Journal of Civil Engineering, 342: 153–162.
Ilmi, N. 2009. Perencanaan Debit Penggelontoran dalam Sistem Air Limbah. Jurnal Teknik Sipil. 211(2) : 243–250.
Kurniawan, A, and Dewi, N. A. 2015. Planning of Domestic Wastewater Sewerage in Bogor City Using Rainwater for Flushing Flowrate. Jurnal Manusia dan Lingkungan. 22(1): 39–51.
G. M. Fair, J. C. Geyer, D. A. Okun. Water and Wastewater Engineering Volume 1: Water Supply and Wastewater Removal, John Willey and Sons, Inc, New York, 1966, p.14–10.
M M Hardjosuprapto. Penyaluran Air Buangan, Vol. 2, 2000, p.117.
Pisano, W. C. 2003. Automated Sewer and Drainage Flushing System in Cambridge, Massachusetts. Journal of Hydraulic Engineering. 260–266.
Thomas, L. 2010. Planning of Hydraulic Piping System. Journal of Civil Engineering. 37:165–173.
Watson, J. 2010. Calculation of Wastewater Discharge on Urban Sewer. Journal of Civil