THE INFLUENCE OF MARKETING STRATEGY RELATIONSHIP
AND SERVICE QUALITY TO CUSTOMER SATISFACTION
IN TOYOTA AUTO SERVICE STATION
Marietje Carolien Nanulaitta
Student of Graduate Program, Master of Management, D Building, VII Floor Jl. Kiai Tapa No. 1 Grogol, West Jakarta 11440
email: [email protected], Phone: (021) 5674166, Fax.: (021) 5668640
ABSTRACT
The background of this research was Customer Relationship marketing and service quality of Firms have accepted that customer retention is even more profitable than customer attraction and we can observe the interest of firms in adopting relationship marketing principles and designing strategies to develop close and long-lasting relationships with the most profitable customers. The objective of The analysis of marketing activities and programs implemented in order to establish, develop, and maintain relationships with customers and the impact these activities have on the firm performance. The design of this research applies to Toyota Car Repair and the questionnaires were spreaded away to 110 respondents. Data analysis used in this research was Multiple Regression with SPSS program. The result of this research conclude that Relationship Marketing Strategy and Service Quality in Car Repair significantly affect to Customer Satisfaction.
INTRODUCTION
The purpose of previous research is to analyze marketing activities and implementation of
programs, building and maintaining relationships with customers and the impact of these activities
on company performance. Previous studies have found that the effect of Attraction and Loyalty
Program greater effect on market performance and the end result shows that can attract customers
is good service quality. Criteria that are considered in evaluating the quality of service is a response
made by the consumer. The method developed by Parasuraman, Zeithaml, and Berry to measure the
quality of service, was named SERVQUAL (Service Quality).
The increase in service quality will increase the value of customer satisfaction and customer
retention. In addition to good quality services, the key to success for achieving corporate objectives,
particularly services companies, among others, is the empowerment of marketing relationships with
customers, related marketing relationships with market performance (observation of customers,
market position, and loyalty) and market performance with economic performance.
There are many ways that can be done by the company to maintain relationships with customers, one
through Relationship marketing as connective hands with customers. This section should prepare
strategies that are important in efforts to comply with customer satisfaction.
Every manufacturer of motor vehicles, are required to have maintenance and repair facilities
(workshop) as a manifestation of the best services that aim to give convenience to consumers.
Workshops from the manufacturer are called by the name of the garage ATPM (Sole Agent Brand).
These workshops are expected to meet customer needs through: (1) Use of equipment (technology),
a modern and sophisticated, (2) Examination da repairs quickly and accurately, giving an estimated
time duration of repair, (3) Provision of information to consumers, (4) Satisfaction results in
improvements, and (5) Friendly service. Not only producers, among non-manufacturers also catch a
great business opportunity and lucrative in terms of service. Therefore, they open the service service
which became known by the name of public workshops. The amount also exceeds the number of
authorized repair shop owned by car manufacturers. Besides these two types of this workshop, there
is also the type of specialist workshops, such as specialist air conditioning (AC), power steering, door & window, radiator and workshops that deal with modifications or installation of car accessories. Authorized repair shop is a garage dealers that serve only the maintenance (service) for a particular
car brand in accordance with recommendations from the vehicle maker. Authorized repair shop is the
extension of the vehicle manufacturer
The purpose of this study is to investigate the influence of Relationship Marketing Strategy, Service Quality, Relationship Marketing Strategy to Customer Satisfaction
This relates to several previous studies that find indications of influence on the performance of Customer Relationship Marketing Customer Satisfaction particular company.
This research is useful in the development of the theory of Relationship Marketing, especially
THEORETICAL FRAMEWORK AND HYPOTHESIS DEVELOPMENT
Relationship Marketing Strategy. Marketing is facing a new paradigm, which is Relationship
Marketing. Marketing is the science and art of exploring, creating, and delivering value to satisfy the needs of target markets (target market) for the sake of profit. The processes in marketing sorted from the beginning of the process since the creation of marketing to current developments, as follows: (1)
Identify opportunities, (2) Develop new products, (3) Attract customers, (4) Retain customers and build loyalty, and (5) Fulfilling orders. Orientation to the customer as the implementation of marketing management has provided the impetus the market (market driven) received by the company as one
measure of success in realizing the strategy of market-oriented company. Customer orientation can
be optimized by the company as a way to meet customer satisfaction and improve employee behavior
to deal with customers when the company has limitations in terms of human interaction.
Human Interaction is needed in the service industry, because this process determines the continuity
of corporate relationships with customers. Cooperation of all employees is necessary so that there are
more than consumers’ assessment indicated all parties, especially in providing services to consumers.
The essence of relationship marketing is the relationship itself, the Sustainer of the relationship
between companies and actors in the micro environment, market intermediaries, the public, and
of course the customer as an important actor. To realize a good Relationship Marketing needed an
effective way, so that effective ways are made to unite with the perception of giving satisfaction to
the customer. In marketing, effective ways is called a marketing strategy. To develop more effective
marketing strategy, it is necessary to use knowledge about the demography, psychology, culture, and social influence in order to understand the needs, perceptions, and customer behavior.
According to Kotler (2005), marketing strategy to satisfy the requirement is to offer something
of value in exchange for something you want the other party. Relationship Marketing Strategy does
more to keep your relationship / personal communication with customers, where the relationship is
expected to be a long term relationship.
The key to success towards a successful marketing strategy is focusing, positioning, and
differentiation (Kotler, 2005). In relationships with customers, companies need to position the customer in a dignified and comfortable. This is a key strategy that needs to be firm in maintaining long term relationships in addition to other strategies such as: do the modernization of products,
lower prices or improve services.
Service Quality. Customer satisfaction is very dependent on the quality of product and service
quality that gives a relative value as the expected buyer / consumer. Quality is the total characteristics of a product (goods / services) that support the ability to meet demand. Quality is often defined as one that can satisfy the consumers / customers to the needs and desires.
Services can be interpreted as a case or how to serve, provide service or services to others, also is
a convenience provided in connection with the sale and purchase of goods or services. An important
factor of customer satisfaction in the environment ministry is service quality.
The purpose of the service: (1) Provide additional services to customers, (2) It offers a higher
for customers and more fun. Services are generally described in four unique attributes, namely: (1)
Intangibility, (2) Heterogenity, (3) Inseparability, (4) Perishability.
Quality of service is a response made by the consumer. The method used is called SERVQUAL
(Service Quality) by Parasuraman, Zeithaml, and Berry (1998). Servqual methods typically used by
service industries such as Hotels, Restaurants, Banks, and others. Reference SERVQUAL model is based on customer evaluations on five different dimensions of service quality: (1) Reliability, (2) Responsiveness, (3) Security, (4) Empathy, and (5) can be seen / measured.
There are 7 criteria for good service quality menentukaan (Gronross, 2000), namely: Professionalism and skills, attitudes and behavior, availability and flexibility, reliability and trustworthy, repair services, serviscape, reputation and credibility. Svensson (2004) noted that
the quality of services also gives strength to the interpersonal, intra-organizational, and services
encountered in the organization.
Quality of care is an important concept in the marketing of services (Gronroos, 2000), industrial
marketing (Hakansson and Snehota, 1995), and relationship marketing. Common factor in most
studies of service quality is an emphasis on the relationship of the recipient’s perspective on quality
of service and non-interactive services.
Service quality model suggested by Haksever, Sasser and Schlesinger suggests seven propositions
that attract and interact with each other, namely (1) Customer Satisfaction is closely related (linked) with profit and growth, (2) Customer Satisfaction is influenced by customer loyalty, (3) Service value related to Customer Satisfaction, (4) The productivity of employees affect the value of services, (5)
employee loyalty affects employee productivity, (7) Quality of work life is determined by employee
satisfaction.
Customer Satisfaction. Customer satisfaction is defined as the most important criteria for customer loyalty. Customers are very concerned about the quality, service, and value. Customer
satisfaction is an important aspect to the service organization and is strongly associated with quality
services. Improving the quality of services, enabling increased customer satisfaction.
In traditional quality is considered as initial quality of customer satisfaction. The five dimensions of service quality that affect customer satisfaction are: Reliability, Responsiveness, Assurance,
Empathy, and Tangible.
Satisfaction of each customer / consumer groups depends on their relational orientation,
especially with similar attitudes that affect the attitude overall customer satisfaction.
Based on these reasons, consumers are dependent on the orientation of their relationship, a
different relative importance of cumulative satisfaction and their commitment to the company. Testing two models of structural relationships, the first that trust and commitment are the mediating variables between component attitudes and future intention, and secondly that the cumulative satisfaction is
a mediating variable between attitudes to the variable component of trust and commitment as well as futures intentio. More customers have a strong relationship in the first model and is less strongly linked to the second model.
Theoretically, the relation exchange, acts as a motivation factor of commitment on the success
exchanges are weak because it is not based on motivation. This theory is expanded in terms of the
partnership theory that the low level of commitment to the customer in a transaction or relationship
does not adequately function as a mediator variable.
To facilitate the understanding of this research, there is described a conceptual framework that shows the direct influence of Relationship Marketing Strategy and Service Quality on Customer Satisfaction
Figure 1 : Research Paradigm of the Influence of Relationship Marketing
Strategy and Service Quality to Customer Satisfaction.
Social skills and knowledge of employees about the services greatly affects the implementation
of the service especially in customer satisfaction, so the hypothesis is prepared as follows: H1 : Relationship Marketing Strategy positively influence Customer Satisfaction.
H2 : Service Quality influence Customer Satisfaction.
H3 : Relationship Marketing Strategy dan Service Quality influence Customer Satisfaction.
METHODS
Research Design. This research relates to the impact of Relationship Marketing and Service Quality on Customer Satisfaction. This study is a survey that aims to test hypotheses about the influence of Relationship Marketing Strategy and Service Quality on Customer Satisfaction visitors Toyota car garage.
The Variable and Measurement. Relationship Marketing Strategy. Relationship Marketing Strategy consists of six components to be measured using an instrument that is quality of service,
comercial services, bonuses, customer satisfaction, complaints, and personal contacts,
Service Quality consists of 4 components namely expert image, convenience images, promotional image, and perzonalized relationship.
Customer Satisfaction. Customer Satisfaction consists of 3 components, namely: market position, loyalty, and outcomes,
Sample and Data Collection. Data were collected by distributing questionnaires to those who Relationship
Marketing Strategi
Service Quality
Relationship Marketing Strategy
H2 H3
had been a consumer / customer in the official workshop at PT Toyota Galala. Hasjrat Abadi - Ambon. The number of respondents in this study is 110 subscribers Galala Toyota Workshop - Ambon.
Test Reliability and Validity
Test Reliability is expressed as the level of consistency or reliability of the results of the two
measurements against the same thing. Reliability testing using Cronbach Alpha for the scale interval
to the provisions of :
a. If the value of r ≥ 0,50 : then the instrument is reliable. b. If the value of r ≤ 0,50 : then the instrument is less reliable
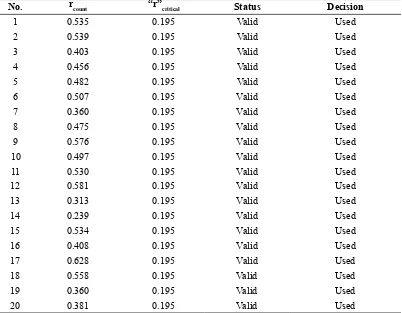
Validity Test. Verification of validity (validity) research instruments in addition to the symptoms can reveal which also objectively examined to make sure to avoid bias in the research concludes. The
validity of the test results can be seen in Table 1, 2 and 3.
Table 1 : The Summary of Validity Test Calculation Result for Variable X1 (Relationship Marketing Strategy) Instrument
No. rcount “r”critical Status Decision
1 0.535 0.195 Valid Used
2 0.539 0.195 Valid Used
3 0.403 0.195 Valid Used
4 0.456 0.195 Valid Used
5 0.482 0.195 Valid Used
6 0.507 0.195 Valid Used
7 0.360 0.195 Valid Used
8 0.475 0.195 Valid Used
9 0.576 0.195 Valid Used
10 0.497 0.195 Valid Used
11 0.530 0.195 Valid Used
12 0.581 0.195 Valid Used
13 0.313 0.195 Valid Used
14 0.239 0.195 Valid Used
15 0.534 0.195 Valid Used
16 0.408 0.195 Valid Used
17 0.628 0.195 Valid Used
18 0.558 0.195 Valid Used
19 0.360 0.195 Valid Used
Table 2 : The Summary of Validity Test Calculation Result Of Variable X2 Service Quality Instrument
No rcount “r”critical Status Decision
1 0.415 0.195 Valid Used
12 0.464 0.195 Valid Used
13 0.237 0.195 Valid Used
14 0.337 0.195 Valid Used
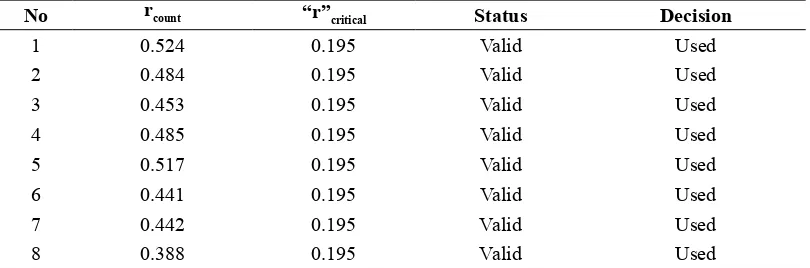
Table 3 : The Summary of Validity Test Calculation Result of Variable X2 (Service Quality) Instrument
No rcount “r”critical Status Decision
1 0.524 0.195 Valid Used variable research summarized in the following table
Table 4 : Tests of Normality
Kolmogorov-Smirnov
df Sig.
Statistic
Relationship Marketing Strategy (X1) 1.247 110 0.089 Service Quality (X2) 0.950 110 0.327 Customer Satisfaction (Y) 0.857 110 0.455
A Lilliefors Significance Correction Based on the calculation, the index value of Kolmogorov-Smirnov (Lilliefors model) in Table 4 for the three variables is > 0.05. Thus, it can be concluded that
the score variable Relationship Marketing Strategy (X1), Service Quality variables (X2), Customer
Satisfaction and variable (Y) is expressed in normal distribution.
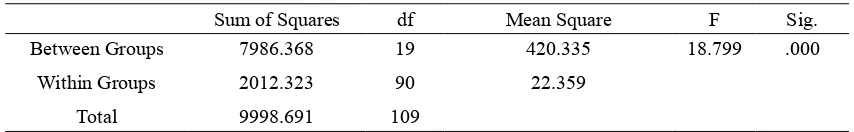
Homogenity Test. The calculation result of sample homogeneity for Relationship Marketing
Table 5 : Test of Homogeneity of Variances Relationship Marketing Strategy (X1)
Levene Statistic df1 df2 Sig.
1.992 15 90 .124
Table 6 : ANOVA for Normality test of Relationship Marketing Strategy (X1)
Sum of Squares df Mean Square F Sig. Between Groups displayed in Tables 5 and 6 above, providing the following information: On the Table Anova Ftable value of 1.68 was obtained. Thus, F-count = 18.799> F-table = 1.68. This showed no significant differences between the samples tested (homogeneous). Meanwhile, the calculation results for sample
homogeneity Service Quality can be seen in the table below:
Table 7 : Test of Homogenity of Variances Service Quality (X2)
Levene Statistic df1 df2 Sig.
2.266 15 90 .119
Table 8 : ANOVA for Normality Test of Service Quality (X2)
Sum of Squares df Mean Square F Sig.
Between Groups
The results displayed of computer calculation program Oneway (one-way analysis of variance) in the table above, give the following information: (1) Test of homogeniety of variance: Because of its significance is greater than 0.05 (0.119> 0.05), the score variable Service Quality (X2) expressed homogeneous or not have different variances. (2) Anova: Anova technique calculation results in the
form of sum of squares (sum of square) to the source of variation between groups (Between groups)
or JKA at 2882.846 and in groups (Within groups) or JKD at 1491.154, and the total sum of squares
(JKT) of 4374.000. While the arithmetic average of the square (mean square) for the sources of
variation between groups (Between groups) amounted to 151.729 and in groups (Within groups) of
16.568.
F-count value = 9.158> Ftable = 1.68. This showed no difference Significant among the samples tested. Lastly, the calculation of homogeneity to the sample Customer Satisfaction can be seen in the
Table 9 : Test of Homogeneity of Variances Customer Satisfaction (Y)
Levene Statistic df1 df2 Sig.
2.348 24 75 0.182
Table 10 : ANOVA for Customer Satisfaction (Y)
Sum of Squares df Mean Square F Sig.
Between Groups
Display the results of computer calculation program Oneway (one-way analysis of variance) in the table above, give information as follows: In Table Anova was obtained F-count value of 8.853 with a significance of 0.000. This showed no significant differences between the samples tested.
Data Analysis Method. Data collected in this study were analyzed using multiple regression with
SPSS program version 12.
Hypothesis Testing. To test the research hypothesis (data analysis) inferential statistical analysis.
Statistics infrensial, namely to test the research hypothesis. Testing Hypothesis 3 above using the
technique of partial correlation analysis and multiple regression.
RESULTS AND DISCUSSION
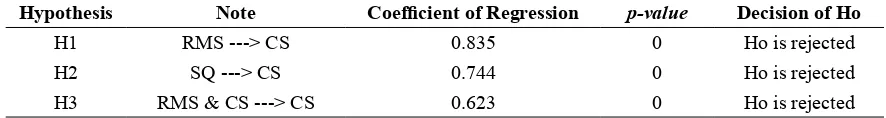
Hypothesis Testing. The following table summarizes the results of regression testing done :
Table 11 : Summary of Hypothesis Testing
Hypothesis Note Coefficient of Regression p-value Decision of Ho
H1 RMS ---> CS 0.835 0 Ho is rejected H2 SQ ---> CS 0.744 0 Ho is rejected H3 RMS & CS ---> CS 0.623 0 Ho is rejected
Hypothesis 1. Hypothesis 1 examines the effect of Relationship Marketing Strategy to Customer Satisfaction. At table 11 shows the results of hypothesis testing Ha1 accepted and rejected H01. These results indicate Relationship Marketing Strategy has a significant impact on Customer Satisfaction, where t = 0.000 significantly smaller than 0.05. These findings indicate that the variable Relationship Marketing Strategy a major impact on Customer Satisfaction. That is Relationship Marketing Strategy
is one of the variables that determine Customer Satisfaction.
Hypothesis 3. Hypothesis 3 tested the effect of Relationship Marketing Strategy jointly with the Service Quality of Customer Satisfaction. At Table 11 shows the results of hypothesis testing Ha1 accepted and Ho1 was rejected. These results show a significant effect between Relationship Marketing Strategy jointly with the Service Quality of Customer Satisfaction, where t = 0.000 significantly smaller than 0.05.
The following is a description furnished computer calculations Display results:
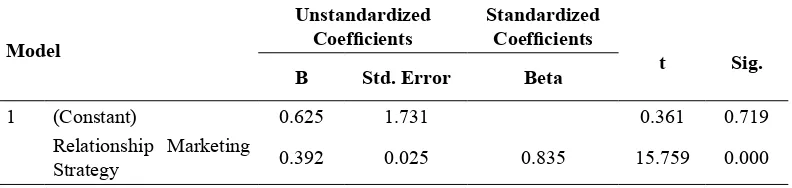
Effect of Relationship Marketing Strategy (X1) on Customer Satisfaction (Y)
Based on computer calculations obtained by the influence of Relationship Marketing Strategy of Customer Satisfaction was analyzed by simple linear regression, as shown in the table below:
Table12 : Coefficients(a) Regresi Y over X1
Model
Unstandardized
Coefficients Standardized Coefficients
t Sig.
B Std. Error Beta
1 (Constant) 0.625 1.731 0.361 0.719 Relationship Marketing
Strategy 0.392 0.025 0.835 15.759 0.000
a Dependent Variable: Customer Satisfaction (Y)
The calculation result F valueas in the ANOVA table
Table 13 : ANOVAbVariabel Y over X1
Model Sum of Squares df Mean
Square F Sig.
1 Regression 1538.210 1 1538.210 248.335 .000a
Residual 668.963 108 6.194 Total 2207.173 109
a Predictors: (Constant), Relationship Marketing Strategy
b Dependent Variable: Customer Satisfaction
From the above table, Table F Value F0, 05 (1,108) = 3.94. Thus, the value F-count > F-table
or 248.335> 3.94. This indicates that the predictor variable (Relationship Marketing Strategy)
can be used to predict the amount of numbers the criterion variable (Customer Satisfaction).
Correlation analysis between variables Relationship Marketing Strategy (X1) with variable Customer
Table 14 : Correlations of Variable Y and X1
Customer Satisfaction
Relationship Marketing Strategy
Pearson Correlation Customer Satisfaction 1.000 0.835
Sig. (2-tailed)
Based on Table 14 above, the correlation coefficient values obtained ry1 = 0.835, the value of this correlation also shows that the closeness of the relationship variable Relationship Marketing
Strategy (X1) and Customer Satisfaction variable (Y) is very strong. T-table value 1.980. Thus, t-count> t-table or 15.759> 1.980, so the test results concluded Ho refused and Ha is received ρ y1> 0. It can be concluded that the first hypothesis, “there is a positive influence of Relationship Marketing Strategy of Customer Satisfaction and test results received significant”.
Table 15 : Determination of X1 to Y
Model R R Square Adjusted R Square Std. Error of the Estimate
1 0.835 0.697 0.694 2.48879
a Predictors: (Constant)
From table 15 above, the R Square value means the variation that occurs in Customer Satisfaction
(Y) can be explained by the Relationship Marketing Strategy (X1) of 69.70%, the rest is 100% -
69.70% = 30.30%, explained by other variables outside of variables used, such as price, product,
promotion, distribution channels etc.
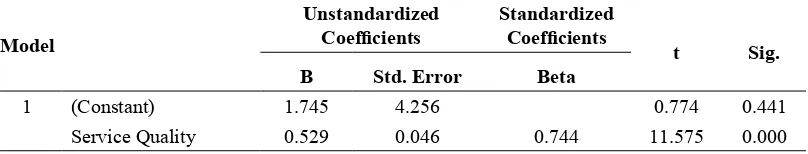
The influence of Service Quality (X2) to Customer Satisfaction (Y)
Table 16 : Coefficients(a) Regression Y over X2
Model
Unstandardized
Coefficients Standardized Coefficients
t Sig.
B Std. Error Beta
1 (Constant) 1.745 4.256 0.774 0.441 Service Quality 0.529 0.046 0.744 11.575 0.000
The calculation result F value as in the following ANOVA table.
Table 17 : ANOVAbVariable Y over X2
Model Sum of Squares df Mean Square F Sig.
1 Regression 1222.072 1 1222.072 133.980 .000a
Based on the above data, obtained Fcount value of 133.980, and F table = 3.94. Thus, the value
F-count> F-table or 133.980> 3.94. Thus, research hypothesis (Ha) accepted and rejected Ho. This
indicates that the predictor variable (Service Quality) can be used to predict the amount of numbers
the criterion variable (Customer Satisfaction).
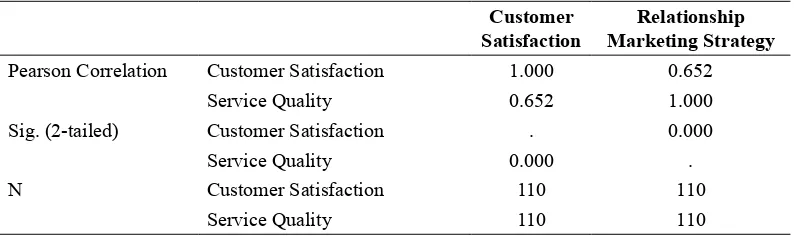
Correlation analysis between variables of Service Quality (X2) with variable Customer
Satisfaction (Y) as shown in the table below:
Table 18 : Correlations of Variable Y and X2
Customer Satisfaction
Relationship Marketing Strategy
Pearson Correlation Customer Satisfaction 1.000 0.652 Service Quality 0.652 1.000 Sig. (2-tailed) Customer Satisfaction . 0.000
Service Quality 0.000 . N Customer Satisfaction 110 110
Service Quality 110 110
From Table 18 above, the correlation coefficient values obtained ry2 = 0.652. This shows that the correlation of two variables: the variable Service Quality (X2) and Customer Satisfaction variable (Y) is strong. Meanwhile, to test the significance of the correlation coefficient above used t-test statistic is obtained, t-count> t-table or 11.575> 1.980. It can be concluded that the first hypothesis, “there is a positive influence of Service Quality on Customer Satisfaction”, accepted and significant test results
Table 19: Determination of X2 to Y
Model R R Square
Adjusted R Square
Std. Error of the Estimate
1 0.744a 0.554 0.550 3.02015
a Predictors: (Constant), Service Quality
R-Squared. From Table 19 above, the value of R Square of 0.554, obtained from the coefficient of determination (KD) = r2 is (0.744) 2 = 0.554 or 55.4%. This means that the variation which occurs
in Customer Satisfaction (Y) is explained by the variable Service Quality (X2) equal to 55.40%,
while the rest of 100% - 55.40% = 44.60%, explained by other variables outside variables used.
Effect of Relationship Marketing Strategy ( X1) and Service Quality (X2) together to Customer
Satisfaction (Y)
Table 20 : Coefficients(a) Y over X1 and X2
Model
Unstandardized
Coefficients Standardized Coefficients t Sig.
B Std. Error Beta
1 (Constant) -2.653 1.814 -1.463 0.146 Relationship
Marketing Strategy
0.293 0.034 .623 8.627 0.000
Service Quality .207 0.051 0.291 4.025 0.000
a Dependent Variable: Customer Satisfaction (Y)
The result of the calculation result in the value of F as in the following ANOVA table:
Table 21 : ANOVAb
Model Sum of Squares df Mean Square F Sig.
1 Regression 1626.172 2 813.086 149.742 0.000a
Residual 581.001 107 5.430 Total 2207.173 109
a Predictors: (Constant), Relationship Marketing Strategy, Service Quality
In Table 21 the value obtained is 17.1104 Fcount, and F-table of 3.09. Thus, the value F-count >
F-table or 149.742> 3.09. This indicates that the predictor variable (Relationship Marketing Strategy
and Service Quality) can be used to predict the amount of numbers the criterion variable (Customer
Satisfaction). In other words, the variable Relationship Marketing Strategy (X1) and variable Service
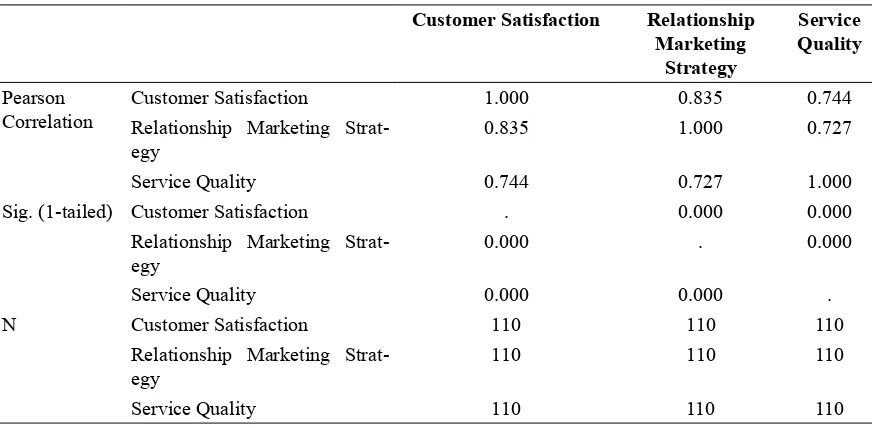
Quality (X2) have jointly on Customer Satisfaction (Y). Correlation analysis between variables
Relationship Marketing Strategy (X1) and Service Quality (X2) with variable Customer Satisfaction
(Y) as shown in the table below:
Table 22 : Correlations of Y with X1 and X2 Sig. (1-tailed) Customer Satisfaction . 0.000 0.000
Relationship Marketing Strat-egy
0.000 . 0.000
Service Quality 0.000 0.000 . N Customer Satisfaction 110 110 110
Relationship Marketing Strat-egy
110 110 110
From Table 22 above, the correlation coefficient values obtained ry.1 = 0.835 and ry.2 = 0.744 or correlation between variables Relationship Marketing Strategy (X1) and Y variables of 0.835 and the
correlation between variables of Service Quality (X2) and Customer Satisfaction variables (Y) equal to 0.744, at significance level 0.000. This means that the variable Relationship Marketing Strategy (X1) and Service Quality (X2) with a significant customer satisfaction, because the value of Sig. (0.000) far below 0.05.
T-count X1 = 8.627> t-table = 1.980 at significant level of 0000, and t-count X2 = 4.025> ttable = 1.980 at significance level of 0.000. It can be concluded that the third hypothesis, “there is positive between Relationship Marketing and Service Quality Strategy jointly to Customer Satisfaction”, accepted and significant test results.
Furthermore, to determine the contribution of the variables X1 and X2 variables to variable Y, the analysis used the coefficient of determination (R Square). From the calculation, the value of R Square is as indicated in the table below
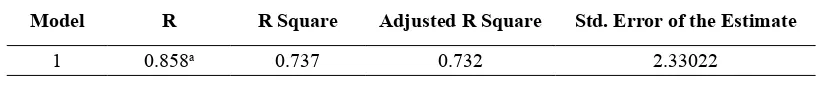
Table 23: Determination of X1 and X2 to Y
Model R R Square Adjusted R Square Std. Error of the Estimate
1 0.858a 0.737 0.732 2.33022
a Predictors: (Constant), Relationship Marketing Strategy dan Service Quality
Adjusted R Square value amounted to 0.732 or 73.20%. This means that the variation of Customer
Satisfaction (Y) explained by the variable Relationship Marketing Strategy (X1) and Service Quality
(X2) equal to 73.20%, the rest is 100% - 73.20% = 26.80%, explained by other variables external
variables used.
CONCLUSION
The findings of this study very clearly shows that the Relationship Marketing Strategy significant impacts on the Customer Satisfaction and Service Quality significantly affect customer satisfaction. Results of testing hypothesis 2 showed that the Service Quality has a significant impact on Customer Satisfaction. From the research results obtained by the fact that the better the Service Quality the
higher the level of customer satisfaction.
Results of testing hypothesis 3 indicates that the Relationship Marketing Strategy and Service
Quality jointly give effect to Customer Satisfaction.
Based on empirical testing hypotheses about the effect of Relationship Marketing Strategy and Service Quality on Customer Satisfaction, some of the findings is the input, especially for the manager and director of workshops to need independent financial strength to survive and to increase consumer confidence in the quality of service and supply offerings, as follows :
2. Quality of service not only depend on the results achieved but also influenced by other components such as: Quality of Process (processing time), and Quality of infrastructure (skills, kebrsihan
workshop).
3. In this study proved that the Relationship Marketing Strategy and Service Quality has a significant impact on Customer Satisfaction.
Limitations of this study are its object as the unit of analysis only Galala PT Toyota repair shop
customers. Eternal Hasjrat Ambon, so that for future studies using customer data and employee.
Similarly, the results can not be generalized to services authorized workshops both Toyota and other
workshops.
Conduct a survey of employee appraisal side of Relationship Marketing Strategy that is designed
and made especially quality improvement employee relationship with the customer in future research
so that it can be analyzed also the level of employee satisfaction in carrying out strategies and better
service quality.
REFERENCES
Berry, Leonard L and A. Parasuraman, 1991. Marketing Services. New York: The Free Press: 139 Gronroos, C. 1991. The Marketing Strategy continuum: toward a marketing concept”, Services
Marketing Management Decision, Vol. 29, pp 7-13.
Gronroos, C. 2000. From Marketing Mix to Relationship marketing: toward a paradigm shift in
marketing Management Decision, Vol. 32 No. 2, pp 4-32.
Kotler, Philip. 2000. Marketing Management : Analysis, Planning, Implementation and Control. 10th
Edition Chicago, Illinois: Prentice Hall, : 48-49.
Svensson, Goran. 2004. Interactive service quality in service Encounters: Empirical illustration