Thomas N. Herzog
Fritz J. Scheuren
William E. Winkler
Thomas N. Herzog Fritz J. Scheuren
Office of Evaluation National Opinion Research Center Federal Housing Administration University of Chicago
U.S. Department of Housing and Urban Development 1402 Ruffner Road
451 7-th Street, SW Alexandria, VA 22302
Washington, DC 20140
William E. Winkler Statistical Research Division U.S. Census Bureau 4700 Silver Hill Road Washington, DC 20233
Library of Congress Control Number: 2007921194
ISBN-13: 978-0-387-69502-0 e-ISBN-13: 978-0-387-69505-1
Printed on acid-free paper.
© 2007 Springer Science+Business Media, LLC
All rights reserved. This work may not be translated or copied in whole or in part without the written permission of the publisher (Springer Science+Business Media, LLC, 233 Spring Street, New York, NY 10013, USA), except for brief excerpts in connection with reviews or scholarly analysis. Use in connection with any form of information storage and retrieval, electronic adaptation, computer software, or by similar or dissimilar methodology now known or hereafter developed is forbidden. The use in this publication of trade names, trademarks, service marks, and similar terms, even if they are not identified as such, is not to be taken as an expression of opinion as to whether or not they are subject to proprietary rights.
There may be no basis for a claim to copyright with respect to a contribution prepared by an officer or employee of the United States Government as part of that person‘s official duties.
Printed in the United States of America.
9 8 7 6 5 4 3 2 1
Preface
Readers will find this book a mixture of practical advice, mathematical rigor, management insight, and philosophy. Our intended audience is the working analyst. Our approach is to work by real life examples. Most illustrations come out of our successful practice. A few are contrived to make a point. Sometimes they come out of failed experience, ours and others.
We have written this book to help the reader gain a deeper understanding, at an applied level, of the issues involved in improving data quality through editing, imputation, and record linkage. We hope that the bulk of the material is easily accessible to most readers although some of it does require a background in statistics equivalent to a 1-year course in mathematical statistics. Readers who are less comfortable with statistical methods might want to omit Section 8.5, Chapter 9, and Section 18.6 on first reading. In addition, Chapter 7 may be primarily of interest to those whose professional focus is on sample surveys. We provide a long list of references at the end of the book so that those wishing to delve more deeply into the subjects discussed here can do so.
Basic editing techniques are discussed in Chapter 5, with more advanced editing and imputation techniques being the topic of Chapter 7. Chapter 14 illustrates some of the basic techniques. Chapter 8 is the essence of our material on record linkage. In Chapter 9, we describe computational techniques for imple-menting the models of Chapter 8. Chapters 9–13 contain techniques that may enhance the record linkage process. In Chapters 15–17, we describe a wide variety of applications of record linkage. Chapter 18 is our chapter on data confidentiality, while Chapter 19 is concerned with record linkage software. Chapter 20 is our summary chapter.
Three recent books on data quality – Redman [1996], English [1999], and Loshin [2001] – are particularly useful in effectively dealing with many management issues associated with the use of data and provide an instructive overview of the costs of some of the errors that occur in representative databases. Using as their starting point the work of quality pioneers such as Deming, Ishakawa, and Juran whose original focus was on manufacturing processes, the recent books cover two important topics not discussed by those seminal authors: (1) errors that affect data quality even when the underlying processes are operating properly and (2) processes that are controlled by others (e.g., other organizational units within one’s company or other companies).
Dasu and Johnson [2003] provide an overview of some statistical summaries and other conditions that must exist for a database to be useable for
vi Preface
specific statistical purposes. They also summarize some methods from the database literature that can be used to preserve the integrity and quality of a database. Two other interesting books on data quality – Huang, Wang and Lee [1999] and Wang, Ziad, and Lee [2001] – supplement our discussion. Readers will find further useful references in The International Monetary Fund’s (IMF) Data Quality Reference Site on the Internet at http://dsbb.imf.org/Applications/web/dqrs/dqrshome/.
We realize that organizations attempting to improve the quality of the data within their key databases do best when the top management of the organization is leading the way and is totally committed to such efforts. This is discussed in many books on management. See, for example, Deming [1986], Juran and Godfrey [1999], or Redman [1996]. Nevertheless, even in organizations not committed to making major advances, analysts can still use the tools described here to make substantial quality improvement.
A working title of this book – Playing with Matches– was meant to warn readers of the danger of data handling techniques such as editing, imputation, and record linkage unless they are tightly controlled, measurable, and as transparent as possible. Over-editing typically occurs unless there is a way to measure the costs and benefits of additional editing; imputation always adds uncertainty; and errors resulting from the record linkage process, however small, need to be taken into account during future uses of the data.
We would like to thank the following people for their support and encour-agement in writing this text: Martha Aliaga, Patrick Ball, Max Brandstetter, Linda Del Bene, William Dollarhide, Mary Goulet, Barry I. Graubard, Nancy J. Kirkendall, Susan Lehmann, Sam Phillips, Stephanie A. Smith, Steven Sullivan, and Gerald I. Webber.
Contents
Preface . . . v
About the Authors . . . xiii
1. Introduction . . . 1
1.1. Audience and Objective ... 1
1.2. Scope... 1
1.3. Structure... 2
PART 1 DATA QUALITY: WHAT IT IS, WHY IT IS IMPORTANT, AND HOW TO ACHIEVE IT 2. What Is Data Quality and Why Should We Care? . . . 7
2.1. When Are Data of High Quality? ... 7
2.2. Why Care About Data Quality?... 10
2.3. How Do You Obtain High-Quality Data? ... 11
2.4. Practical Tips ... 13
2.5. Where Are We Now? ... 13
3. Examples of Entities Using Data to their Advantage/Disadvantage 17 3.1. Data Quality as a Competitive Advantage... 17
3.2. Data Quality Problems and their Consequences... 20
3.3. How Many People Really Live to 100 and Beyond? Views from the United States, Canada, and the United Kingdom ... 25
3.4. Disabled Airplane Pilots – A Successful Application of Record Linkage ... 26
3.5. Completeness and Accuracy of a Billing Database: Why It Is Important to the Bottom Line... 26
3.6. Where Are We Now? ... 27
4. Properties of Data Quality and Metrics for Measuring It . . . 29
4.1. Desirable Properties of Databases/Lists... 29
4.2. Examples of Merging Two or More Lists and the Issues that May Arise ... 31
4.3. Metrics Used when Merging Lists... 33
4.4. Where Are We Now? ... 35
viii Contents
5. Basic Data Quality Tools . . . 37
5.1. Data Elements... 37
5.2. Requirements Document ... 38
5.3. A Dictionary of Tests ... 39
5.4. Deterministic Tests ... 40
5.5. Probabilistic Tests... 44
5.6. Exploratory Data Analysis Techniques... 44
5.7. Minimizing Processing Errors... 46
5.8. Practical Tips ... 46
5.9. Where Are We Now? ... 48
PART 2 SPECIALIZED TOOLS FOR DATABASE IMPROVEMENT 6. Mathematical Preliminaries for Specialized Data Quality Techniques . . . 51
6.1. Conditional Independence ... 51
6.2. Statistical Paradigms... 53
6.3. Capture–Recapture Procedures and Applications ... 54
7. Automatic Editing and Imputation of Sample Survey Data . . . 61
7.1. Introduction... 61
7.2. Early Editing Efforts ... 63
7.3. Fellegi–Holt Model for Editing... 64
7.4. Practical Tips ... 65
7.5. Imputation ... 66
7.6. Constructing a Unified Edit/Imputation Model ... 71
7.7. Implicit Edits – A Key Construct of Editing Software ... 73
7.8. Editing Software ... 75
7.9. Is Automatic Editing Taking Up Too Much Time and Money? ... 78
7.10. Selective Editing... 79
7.11. Tips on Automatic Editing and Imputation ... 79
7.12. Where Are We Now? ... 80
8. Record Linkage – Methodology . . . 81
8.1. Introduction... 81
8.2. Why Did Analysts Begin Linking Records? ... 82
8.3. Deterministic Record Linkage... 82
8.4. Probabilistic Record Linkage – A Frequentist Perspective ... 83
8.5. Probabilistic Record Linkage – A Bayesian Perspective ... 91
Contents ix
9. Estimating the Parameters of the Fellegi–Sunter Record Linkage
Model . . . 93
9.1. Basic Estimation of Parameters Under Simple Agreement/Disagreement Patterns ... 93
9.2. Parameter Estimates Obtained via Frequency-Based Matching ... 94
9.3. Parameter Estimates Obtained Using Data from Current Files ... 96
9.4. Parameter Estimates Obtained via the EM Algorithm ... 97
9.5. Advantages and Disadvantages of Using the EM Algorithm to Estimate m- andu-probabilities ... 101
9.6. General Parameter Estimation Using the EM Algorithm... 103
9.7. Where Are We Now? ... 106
10. Standardization and Parsing . . . 107
10.1. Obtaining and Understanding Computer Files... 109
10.2. Standardization of Terms ... 110
10.3. Parsing of Fields ... 111
10.4. Where Are We Now? ... 114
11. Phonetic Coding Systems for Names . . . 115
11.1. Soundex System of Names... 115
11.2. NYSIIS Phonetic Decoder... 119
11.3. Where Are We Now? ... 121
12. Blocking . . . 123
12.1. Independence of Blocking Strategies... 124
12.2. Blocking Variables ... 125
12.3. Using Blocking Strategies to Identify Duplicate List Entries... 126
12.4. Using Blocking Strategies to Match Records Between Two Sample Surveys... 128
12.5. Estimating the Number of Matches Missed... 130
12.6. Where Are We Now? ... 130
13. String Comparator Metrics for Typographical Error . . . 131
13.1. Jaro String Comparator Metric for Typographical Error ... 131
13.2. Adjusting the Matching Weight for the Jaro String Comparator ... 133
13.3. Winkler String Comparator Metric for Typographical Error .... 133
13.4. Adjusting the Weights for the Winkler Comparator Metric... 134
x Contents
PART 3 RECORD LINKAGE CASE STUDIES
14. Duplicate FHA Single-Family Mortgage Records: A Case Study
of Data Problems, Consequences, and Corrective Steps . . . 139
14.1. Introduction... 139
14.2. FHA Case Numbers on Single-Family Mortgages... 141
14.3. Duplicate Mortgage Records... 141
14.4. Mortgage Records with an Incorrect Termination Status... 145
14.5. Estimating the Number of Duplicate Mortgage Records ... 148
15. Record Linkage Case Studies in the Medical, Biomedical, and Highway Safety Areas . . . 151
15.1. Biomedical and Genetic Research Studies ... 151
15.2. Who goes to a Chiropractor? ... 153
15.3. National Master Patient Index... 154
15.4. Provider Access to Immunization Register Securely (PAiRS) System... 155
15.5. Studies Required by the Intermodal Surface Transportation Efficiency Act of 1991 ... 156
15.6. Crash Outcome Data Evaluation System... 157
16. Constructing List Frames and Administrative Lists . . . 159
16.1. National Address Register of Residences in Canada ... 160
16.2. USDA List Frame of Farms in the United States ... 162
16.3. List Frame Development for the US Census of Agriculture... 165
16.4. Post-enumeration Studies of US Decennial Census ... 166
17. Social Security and Related Topics . . . 169
17.1. Hidden Multiple Issuance of Social Security Numbers ... 169
17.2. How Social Security Stops Benefit Payments after Death... 173
17.3. CPS–IRS–SSA Exact Match File... 175
17.4. Record Linkage and Terrorism ... 177
PART 4 OTHER TOPICS 18. Confidentiality: Maximizing Access to Micro-data while Protecting Privacy . . . 181
18.1. Importance of High Quality of Data in the Original File ... 182
18.2. Documenting Public-use Files... 183
18.3. Checking Re-identifiability ... 183
18.4. Elementary Masking Methods and Statistical Agencies ... 186
18.5. Protecting Confidentiality of Medical Data... 193
18.6. More-advanced Masking Methods – Synthetic Datasets... 195
Contents xi
19. Review of Record Linkage Software . . . 201
19.1. Government... 201
19.2. Commercial... 202
19.3. Checklist for Evaluating Record Linkage Software ... 203
20. Summary Chapter . . . 209
Bibliography . . . 211
About the Authors
Thomas N. Herzog, Ph.D., ASA, is the Chief Actuary at the US Department of Housing and Urban Development. He holds a Ph.D. in mathematics from the University of Maryland and is also an Associate of the Society of Actuaries. He is the author or co-author of books on Credibility Theory, Monte Carlo Methods, and Risk Models. He has devoted a major effort to improving the quality of the databases of the Federal Housing Administration.
Fritz J. Scheuren, Ph.D., is a general manager with the National Opinion Research Center. He has a Ph.D. in statistics from the George Washington University. He is much published with over 300 papers and monographs. He is the 100th President of the American Statistical Association and a Fellow of both the American Statistical Association and the American Association for the Advancement of Science. He has a wide range of experience in all aspects of survey sampling, including data editing and handling missing data. Much of his professional life has been spent employing large operational databases, whose incoming quality was only marginally under the control of the data analysts under his direction. His extensive work in recent years on human rights data collection and analysis, often under very adverse circumstances, has given him a clear sense of how to balance speed and analytic power within a framework of what is feasible.
William E. Winkler, Ph.D., is Principal Researcher at the US Census Bureau. He holds a Ph.D. in probability theory from Ohio State University and is a fellow of the American Statistical Association. He has more than 110 papers in areas such as automated record linkage and data quality. He is the author or co-author of eight generalized software systems, some of which are used for production in the largest survey and administrative-list situations.
1
Introduction
1.1.
Audience and Objective
This book is a primer on editing, imputation and record linkage for analysts who are responsible for the quality of large databases, including those sometimes known as data warehouses. Our goal is to provide practical help to people who need to make informed and cost-effective judgments about how and when to take steps to safeguard or improve the quality of the data for which they are responsible. We are writing for people whose professional day-to-day lives are governed, or should be, by data quality issues. Such readers are in academia, government, and the private sector. They include actuaries, economists, statisti-cians, and computer scientists. They may be end users of the data, but they are more often working in the middle of a data system. We are motivated to write the book by hard experience in our own working lives, where unanticipated data quality problems have cost our employers and us dearly–in both time and money. Such problems can even damage an organization’s reputation.
Since most readers are familiar, at some level, with much of the material we cover, we do not expect, or recommend, that everyone read this book thoroughly from cover to cover. We have tried to be comprehensive, however, so that readers who need a brief refresher course on any particular issue or technique we discuss can get one without going elsewhere.
To be as user-friendly as possible for our audience, we mix mathematical rigor with practical advice, management insight, and even philosophy. A major point to which we return many times is the need to have a good understanding of the primary intended uses for the database, even if you are not an end user yourself.
1.2.
Scope
Our goal is to describe techniques that the analyst can use herself or himself in three main areas of application:
(1) To improve the useful quality of existing or contemplated databases/lists. Here our aim is to describe analytical techniques that facilitate the
2 1. Introduction
improvement of the quality of individual data items within databases/lists. This is the topic of the classic text of Naus [1975] – alas, now out-of-print. This first area of interest also entails describing techniques that facilitate the elimination of duplicate records from databases/lists.
(2) To merge two or more lists. The merging of two or more lists involves record linkage, our second area of study. Here the classic text is Newcombe [1988] – another book out-of-print.1Such lists may be mailing lists of retail
customers of a large chain of stores. Alternatively, the merged list might be used as a sampling frame to select individual entities (e.g., a probability sample of farms in the United States) to be included in a sample survey. In addition to seeking a list that contains every individual or entity in the population of interest, we also want to avoid duplicate entries. We can use record linkage techniques to help us do this.
(3) To merge two or more distinct databases. The merging of two or more databases is done to create a new database that has more data elements than any previously existing (single) database, typically to conduct research studies. A simple example of this is a recent study (see Section 3.4 for further discussion) that merged a database of records on licensed airplane pilots with a database of records on individuals receiving disability benefits from the US Social Security Administration. The classic paper on this type of record linkage study is Newcombe et al. [1959]. Early applications of record linkage frequently focused on health and genetics issues.
1.3.
Structure
Our text consists of four parts.
Part I (Data Quality: What It Is, Why It Is Important, and How to Achieve It) consists of four chapters. In Chapter 2 we pose three fundamental questions about data quality that help in assessing a database’s overall fitness for use. We use a systems perspective that includes all stages, from the generation of the initial datasets and ways to prevent errors from arising, to the data processing steps that take the data from data capture and cleaning, to data interpretation and analysis. In Chapter 3 we present a number of brief examples to illustrate the enormous consequences of successes–and failures–in data and database use. In Chapter 4, we describe metrics that quantify the quality of databases and data lists. In Chapter 5 we revisit a number of data quality control and editing techniques described in Naus [1975] and add more recent material that supplements his work in this area. Chapter 5 also includes a number of examples illustrating the techniques we describe.
1.3. Structure 3
Part II of the text (Mathematical Tools for Editing, Imputation, and Record Linkage) is the book’s heart and essence. Chapter 6 presents some mathematical preliminaries that are necessary for understanding the material that follows. In Chapter 7 we present an in-depth introductory discussion of specialized editing and imputation techniques within a survey-sampling environment. Our discussion of editing in sample surveys summarizes the work of Fellegi and Holt [1976]. Similarly, our treatment of imputation of missing data in sample surveys highlights the material of Rubin [1987] and Little and Rubin [2002]–books that provide an excellent treatment of that topic. Those dealing with non-survey data (e.g., corporate mailing lists or billing systems) frequently decide to use alter-native schemes that devote more resources to ensuring that the items within their databases are correct than the data-correction techniques we concentrate on here. In Chapters 8 and 9, we describe the fundamental approaches to record linkage as presented by Fellegi–Sunter and Belin–Rubin. In Chapters 10–13, we describe other techniques that can be used to enhance these record linkage models. These include standardization and parsing (Chapter 10), phonetic coding systems for names (Chapter 11), blocking (Chapter 12), and string comparator metrics for typographical errors (Chapter 13).
In Part III (Case Studies on Record Linkage) we present a wide variety of examples to illustrate the multiple uses of record linkage techniques. Chapter 14 describes a variety of applications based on HUD’s FHA single-family mortgage records. Other topics considered in Part III include medical, biomedical, highway safety, and social security.
2
What Is Data Quality and Why Should
We Care?
Caring about data quality is key to safeguarding and improving it. As stated, this sounds like a very obvious proposition. But can we, as the expression goes, “recognize it when we see it”? Considerable analysis and much experience make it clear that the answer is “no.” Discovering whether data are of acceptable quality is a measurement task, and not a very easy one. This observation becomes all the more important in this information age, when explicit and meticulous attention to data is of growing importance if information is not to become misinformation. This chapter provides foundational material for the specifics that follow in later chapters about ways to safeguard and improve data quality.1 After identifying
when data are of high quality, we give reasons why we should care about data quality and discuss how one can obtain high-quality data.
Experts on quality (such as Redman [1996], English [1999], and Loshin [2001]) have been able to show companies how to improve their processes by first understanding the basic procedures the companies use and then showing new ways to collect and analyze quantitative data about those procedures in order to improve them. Here, we take as our primary starting point primarily the work of Deming, Juran, and Ishakawa.
2.1.
When Are Data of High Quality?
Data are of high quality if they are “Fit for Use” in their intended operational, decision-making and other roles.2 In many settings, especially for intermediate
products, it is also convenient to define quality as “Conformance to Standards” that have been set, so that fitness for use is achieved. These two criteria link the
1 It is well recognized that quality must have undoubted top priority in every organization. As Juran and Godfrey [1999; pages 4–20, 4–21, and 34–9] makes clear, quality has several dimensions, including meeting customer needs, protecting human safety, and protecting the environment. We restrict our attention to the quality of data, which can affect efforts to achieve quality in all three of these overall quality dimensions.
2 Juran and Godfrey [1999].
8 2. What Is Data Quality and Why Should We Care?
role of the employee doing the work (conformance to standards) to the client receiving the product (fitness for use). When used together, these two can yield efficient systems that achieve the desired accuracy level or other specified quality attributes.
Unfortunately, the data of many organizations do not meet either of these criteria. As the cost of computers and computer storage has plunged over the last 50 or 60 years, the number of databases has skyrocketed. With the wide avail-ability of sophisticated statistical software and many well-trained data analysts, there is a keen desire to analyze such databases in-depth. Unfortunately, after they begin their efforts, many data analysts realize that their data are too messy to analyze without major data cleansing.
Currently, the only widely recognized properties of quality are quite general and cannot typically be used without further elaboration to describe specific properties of databases that might affect analyses and modeling. The seven most commonly cited properties are (1) relevance, (2) accuracy, (3) timeliness, (4) accessibility and clarity of results, (5) comparability, (6) coherence, and (7) completeness.3 For this book, we are primarily concerned with five of these
properties: relevance, accuracy, timeliness, comparability, and completeness.
2.1.1. Relevance
Several facets are important to the relevance of the data analysts’ use of data.
• Do the data meet the basic needs for which they were collected, placed in a database, and used?
• Can the data be used for additional purposes (e.g., a market analysis)? If the data cannot presently be used for such purposes, how much time and expense would be needed to add the additional features?
• Is it possible to use a database for several different purposes? A secondary (or possibly primary) use of a database may be better for determining what subsets of customers are more likely to purchase certain products and what types of advertisements or e-mails may be more successful with different groups of customers.
2.1.2. Accuracy
We cannot afford to protect against all errors in every field of our database. What are likely to be the main variables of interest in our database? How accurate do our data need to be?
2.1. When Are Data of High Quality? 9
For example, how accurate do our data need to be to predict:
• Which customers will buy certain products in a grocery store? Which customers bought products (1) this week, (2) 12 months ago, and (3) 24 months ago? Should certain products be eliminated or added based on sales trends? Which products are the most profitable?
• How will people vote in a Congressional election? We might be interested in demographic variables on individual voters – for example, age, education level, and income level. Is it acceptable here if the value of the income variable is within 20% of its true value? How accurate must the level of education variable be?
• How likely are individuals to die from a certain disease? Here the context might be a clinical trial in which we are testing the efficacy of a new drug. The data fields of interest might include the dosage level, the patient’s age, a measure of the patient’s general health, and the location of the patient’s residence. How accurate does the measurement of the dosage level need to be? What other factors need to be measured (such as other drug use or general health level) because they might mitigate the efficacy of the new drug? Are all data fields being measured with sufficient accuracy to build a model to reliably predict the efficacy of various dosage levels of the new drug?
Are more stringent quality criteria needed for financial data than are needed for administrative or survey data?
2.1.3. Timeliness
How current does the information need to be to predict which subsets of customers are more likely to purchase certain products? How current do public opinion polls need to be to accurately predict election results? If data editing delays the publication/release of survey results to the public, how do the delays affect the use of the data in (1) general-circulation publications and (2) research studies of the resulting micro-data files?
2.1.4. Comparability
Is it appropriate to combine several databases into a data warehouse to facil-itate the data’s use in (1) exploratory analyses, (2) modeling, or (3) statistical estimation? Are data fields (e.g., Social Security Numbers) present within these databases that allow us to easily link individuals across the databases? How accurate are these identifying fields? If each of two distinct linkable databases4
has an income variable, then which income variable is better to use, or is there a way to incorporate both into a model?
10 2. What Is Data Quality and Why Should We Care?
2.1.5. Completeness
Here, by completeness we mean that no records are missing and that no records have missing data elements. In the survey sampling literature, entire missing records are known asunit non-responseand missing items are referred to as item non-response. Both unit non-response and item non-response can indicate lack of quality. In many databases such as financial databases, missing entire records can have disastrous consequences. In survey and administrative databases, missing records can have serious consequences if they are associated with large companies or with a large proportion of employees in one subsection of a company. When such problems arise, the processes that create the database must be examined to determine whether (1) certain individuals need additional training in use of the software, (2) the software is not sufficiently user-friendly and responsive, or (3) certain procedures for updating the database are insuffi-cient or in error.
2.2.
Why Care About Data Quality?
Data quality is important to business and government for a number of obvious reasons. First, a reputation for world-class quality is profitable, a “business maker.” As the examples of Section 3.1 show, high-quality data can be a major business asset, a unique source of competitive advantage.
By the same token, poor-quality data can reduce customer satisfaction. Poor-quality data can lower employee job satisfaction too, leading to excessive turnover and the resulting loss of key process knowledge. Poor-quality data can also breed organizational mistrust and make it hard to mount efforts that lead to needed improvements.
Further, poor-quality data can distort key corporate financial data; in the extreme, this can make it impossible to determine the financial condition of a business. The prominence of data quality issues in corporate governance has become even greater with enactment of the Sarbanes–Oxley legislation that holds senior corporate management responsible for the quality of its company’s data. High-quality data are also important to all levels of government. Certainly the military needs high-quality data for all of its operations, especially its counter-terrorism efforts. At the local level, high-quality data are needed so that individuals’ residences are assessed accurately for real estate tax purposes.
2.3. How Do You Obtain High-Quality Data? 11
2.3.
How Do You Obtain High-Quality Data?
In this section, we discuss three ways to obtain high-quality data.
2.3.1. Prevention: Keep Bad Data Out
of the Database/List
The first, and preferable, way is to ensure that all data entering the database/list are of high quality. One thing that helps in this regard is a system that edits data before they are permitted to enter the database/list. Chapter 5 describes a number of general techniques that may be of use in this regard. Moreover, as Granquist and Kovar [1977] suggest, “The role of editing needs to be re-examined, and more emphasis placed on using editing to learn about the data collection process, in order to concentrate on preventing errors rather than fixing them.”
Of course, there are other ways besides editing to improve the quality of data. Here organizations should encourage their staffs to examine a wide variety of methods for improving the entire process. Although this topic is outside the scope of our work, we mention two methods in passing. One way in a survey-sampling environment is to improve the data collection instrument, for example, the survey questionnaire. Another is to improve the methods of data acquisition, for example, to devise better ways to collect data from those who initially refuse to supply data in a sample survey.
2.3.2. Detection: Proactively Look for Bad Data
Already Entered
The second scheme is for the data analyst to proactively look for data quality problems and then correct the problems. Under this approach, the data analyst needs at least a basic understanding of (1) the subject matter, (2) the structure of the database/list, and (3) methodologies that she might use to analyze the data. Of course, even a proactive approach is tantamount to admitting that we are too busy mopping up the floor to turn off the water.
If we have quantitative or count data, there are a variety of elementary methods, such as univariate frequency counts or two-way tabulations, that we can use. More sophisticated methods involve Exploratory Data Analysis (EDA) techniques. These methods, as described in Tukey [1977], Mosteller and Tukey [1977], Velleman and Hoaglin [1981], and Cleveland [1994], are often useful in examining (1) relationships among two or more variables or (2) aggregates. They can be used to identify anomalous data that may be erroneous.
12 2. What Is Data Quality and Why Should We Care?
Example 2.1: Improving Data Quality through Record Linkage
Suppose two databases had information on the employees of a company. Suppose one of the databases had highly reliable data on the home addresses of the employees but only sketchy data on the salary history on these employees while the second database had essentially complete and accurate data on the salary history of the employees. Records in the two databases could be linked and the salary history from the second database could be used to replace the salary history on the first database, thereby improving the data quality of the first database.
2.3.3. Repair: Let the Bad Data Find You
and Then Fix Things
By far, the worst approach is to wait for data quality problems to surface on their own. Does a chain of grocery stores really want its retail customers doing its data quality work by telling store managers that the scanned price of their can of soup is higher than the price posted on the shelf? Will a potential customer be upset if a price higher than the one advertised appears in the price field during checkout at a website? Will an insured whose chiropractic charges are fully covered be happy if his health insurance company denies a claim because the insurer classified his health provider as a physical therapist instead of a chiropractor? Data quality problems can also produce unrealistic or noticeably strange answers in statistical analysis and estimation. This can cause the analyst to spend lots of time trying to identify the underlying problem.
2.3.4. Allocating Resources – How Much for Prevention,
Detection, and Repair
The question arises as to how best to allocate the limited resources available for a sample survey, an analytical study, or an administrative database/list. The typical mix of resources devoted to these three activities in the United States tends to be on the order of:
Prevent: 10% Detect: 30% Repair: 60%.
Our experience strongly suggests that a more cost-effective strategy is to devote a larger proportion of the available resources to preventing bad data from getting into the system and less to detecting and repairing (i.e., correcting) erroneous data. It is usually less expensive to find and correct errors early in the process than it is in the later stages. So, in our judgment, a much better mix of resources would be:
2.5. Where Are We Now? 13
2.4.
Practical Tips
2.4.1. Process Improvement
One process improvement would be for each company to have a few individuals who have learned additional ways of looking at available procedures and data that might be promising in the quest for process improvement. In all situa-tions, of course, any such procedures should be at least crudely quantified – before adoption – as to their potential effectiveness in reducing costs, improving customer service, and allowing new marketing opportunities.
2.4.2. Training Staff
Many companies and organizations may have created their procedures to meet a few day-to-day processing needs, leaving them unaware of other procedures for improving their data. Sometimes, suitable training in software development and basic clerical tasks associated with customer relations may be helpful in this regard. Under other conditions, the staff members creating the databases may need to be taught basic schemes for ensuring minimally acceptable data quality. In all situations, the company should record the completion of employee training in appropriate databases and, if resources permit, track the effect of the training on job performance. A more drastic approach is to obtain external hires with experience/expertise in (1) designing databases, (2) analyzing the data as they come in, and (3) ensuring that the quality of the data produced in similar types of databases is “fit for use.”
2.5.
Where Are We Now?
We are still at an early stage in our discussion of data quality concepts. So, an example of what is needed to make data “fit for use” might be helpful before continuing.
Example 2.2: Making a database fit for use
Goal: A department store plans to construct a database that has a software interface that allows customer name, address, telephone number and order infor-mation to be collected accurately.
Developing System Requirements: All of the organizational units within the department store need to be involved in this process so that their operational needs can be met. For instance, the marketing department should inform the database designer that it needs both (1) a field indicating the amount of money each customer spent at the store during the previous 12 months and (2) a field indicating the date of each customer’s most recent purchase at the store.
14 2. What Is Data Quality and Why Should We Care?
store. For example, clear instructions need to be provided on how to handle missing data items. Often, this will enable those maintaining the database to use their limited resources most effectively and thereby lead to a higher quality database.
Developing User Requirements – How will the data be used and by whom? All of the organizational units within the department store who expect to use the data should be involved in this process so that their operational needs can be met. For example, each unit should be asked what information they will need. Answers could include the name and home address for catalog mailings and billing, an e-mail address for sale alerts, and telephone number(s) for customer service. How many phone numbers will be stored for each customer? Three? One each for home, office, and mobile? How will data be captured? Are there legacy data to import from a predecessor database? Who will enter new data? Who will need data and in what format? Who will be responsible for the database? Who will be allowed to modify data, and when? The answers to all these questions impact the five aspects of quality that are of concern to us.
Relevance: There may be many uses for this database. The assurance that all units who could benefit from using the data do so is one aspect of the relevance of the data. One thing that helps in this regard is to make it easy for the store’s employees to access the data. In addition, addresses could be standardized (see Chapter 10) to facilitate the generation of mailing labels.
Accuracy: Incorrect telephone numbers, addresses, or misspelled names can make it difficult for the store to contact its customers, making entries in the database of little use. Data editing is an important tool for finding errors, and more importantly for ensuring that only correct data enter the system at the time of data capture. For example, when data in place name, state, and Zip Code fields are entered or changed, such data could be subjected to an edit that ensures that the place name and Zip Code are consistent. More ambitiously, the street address could be parsed (see Chapter 10) and the street name checked for validity against a list of the streets in the city or town. If legacy data are to be imported, then they should be checked for accuracy, timeliness, and duplication before being entered into the database.
Timeliness: Current data are critical in this application. Here again, record linkage might be used together with external mailing lists, to confirm the customers’ addresses and telephone numbers. Inconsistencies could be resolved in order to keep contact information current. Further, procedures such as real-time data capture (with editing at the real-time of capture) at the first point of contact with the customer would allow the database to be updated exactly when the customer is acquired.
Comparability: The database should capture information that allows the department store to associate its data with data in its other databases (e.g., a trans-actions database). Specifically, the store wants to capture the names, addresses, and telephone numbers of its customers in a manner that enables it to link its customers across its various databases.
2.5. Where Are We Now? 15
example, a customer may not wish to provide her telephone number. Can these missing data be obtained, orimputed, from public sources? Can a nine-digit Zip Code be imputed from a five-digit Zip Code and a street address? (Anyone who receives mail at home knows that this is done all the time.) Can a home telephone number be obtained from the Internet based on the name and/or home address? What standard operating procedures can be established to ensure that contact data are obtained from every customer? Finally, record linkagecan be used to eliminate duplicate records that might result in a failure to contact a customer, or a customer being burdened by multiple contacts on the same subject.
3
Examples of Entities Using Data
to their Advantage/Disadvantage
In this chapter we first summarize work at five companies that are making successful use of their data for competitive advantage. We then discuss problems with the quality of some other databases and the resulting disastrous conse-quences. Our next example illustrates fitness-for-use complexities by considering efforts to obtain reliable data on the ages of the oldest residents of several countries. We conclude with (1) a dramatic example of the effectiveness of matching case records between two distinct databases and (2) a brief discussion of the use of a billing system within a medical practice.
3.1.
Data Quality as a Competitive Advantage
In the five examples that follow, we show how relevance, accuracy, timeliness, comparability, and completeness of data can yield competitive advantage.
3.1.1. Harrah’s
1Harrah’s, a hotel chain that features casinos, collects lots of data on its customers – both big-time spenders and small, but steady gamblers – through its Total Rewards Program®. At the end of calendar year 2003, the Total
Rewards Program included 26 million members of whom 6 million had used their membership during the prior 12 months.
The database for this program is based on an integrated, nationwide computer system that permits real-time communication among all of Harrah’s properties. Harrah’s uses these data to learn as much as it can about its customers in order to give its hotel/casino guests customized treatment. This enables Harrah’s to know the gambling, eating, and spending preferences of its customers. Hence, Harrah’s
1 This section is based in part on Jill Griffin’s article “How Customer Information Gives Harrah’s a Winning Hand” that can be found at http://www.refresher.com/ !jlgharrahs.html.
18 3. Examples of Entities Using Data to their Advantage/Disadvantage
can tailor its services to its customers by giving customized complimentary services such as free dinners, hotel rooms, show tickets, and spa services.
While the prevailing wisdom in the hotel business is that the attractiveness of a property drives business, Harrah’s further stimulates demand by knowing its customers. This shows that Harrah’s is listening to its customers and helps Harrah’s to build customer loyalty.
Harrah’s has found that this increased customer loyalty results in more frequent customer visits to its hotels/casinos with a corresponding increase in customer spending. In fact, according to its 2004 Annual ReportHarrah’s “believes that its portion of the customer gaming budget has climbed from 36 percent in 1998 to more than 43 percent” in 2002.
3.1.2. Wal-Mart
According to Wal-Mart’s 2005 Annual Report, Wal-Mart employs over 75,000 people in Logistics and in its Information Systems Division. These employees enable Wal-Mart to successfully implement a “retailing strategy that strives to have what the customer wants, when the customer wants it.”
With the Data Warehouse storage capacity of over 570 terabytes – larger than all of the fixed pages on the internet – we [Wal-Mart] have [put] a remarkable level of real-time visibility planning into our merchandise planning. So much so that when Hurricane Ivan was heading toward the Florida panhandle, we knew that there would be a rise in demand for Kellogg’s® Strawberry Pop-Tart® toaster pastries. Thanks to our associates in the distribution centers and our drivers on the road, merchandise arrived quickly.
3.1.3. Federal Express
2FedEx InSight is a real-time computer system that permits Federal Express’ business customers to go on-line to obtain up-to-date information on all of their Federal Express cargo information. This includes outgoing, incoming, and third-party3 shipments. The business customer can tailor views and drill down into
freight information, including shipping date, weight, contents, expected delivery date, and related shipments. Customers can even request e-mail notifications of in-transit events, such as attempted deliveries and delays at customs and elsewhere.
InSight links shipper and receiver data on shipping bills with entries in a database of registered InSight customers. The linking software, developed by Trillium Software, is able to recognize, interpret, and match customer names and address information. The challenge in matching records was not with the records of outgoing shippers, who could be easily identified by their account number.
2This is based on http://www.netpartners.com.my/PDF/Trillium%20Software%20Case% 20Study%20%20FedEx.pdf.
3.1. Data Quality as a Competitive Advantage 19
The real challenge was to link the intended shipment recipients to customers in the InSight database.
The process, of course, required accurate names and addresses. The addresses on the Federal Express bills tend not to be standardized and to be fraught with errors, omissions, and other anomalies. The bills also contain a lot of extraneous information such as parts numbers, stock keeping units, signature requirements, shipping contents, and delivery instructions. These items make it harder to extract the required name and address from the bill. The system Trillium Software developed successfully met all of these challenges and was able to identify and resolve matches in less than 1 second, processing as many as 500,000 records per hour.
3.1.4. Albertsons, Inc. (and RxHub)
Albertsons is concerned with the safety of the customers buying prescription drugs at its 1900 pharmacies. It is crucial that Albertsons correctly identify all such customers. Albertsons needs an up-to-date patient medication (i.e., prescription drug) history on each of its customers to prevent a new prescription from causing an adverse reaction to a drug he or she is already taking. Here, we are concerned about real-time recognition – understanding at the point of service exactly who is the customer at the pharmacy counter.
For example, Mary Smith may have a prescription at the Albertsons store near her office, but need to refill it at another Albertsons – for example, the one near her residence. The pharmacist at the Albertsons near Mary’s residence needs to know immediately what other medication Mary is taking. After all, there is at least one high-profile lawsuit per year against a pharmacy that results in at least a million dollar award. Given this concern, the return-on-investment (ROI) for the solution comes pretty rapidly.
In addition to health and safety issues, there are also issues involving the coverage of the prescription drug portion of the customer’s health insurance. Albertsons has responded to both the safety and cost problems by deploying Initiate Identity Hub™software to first identify and resolve duplication followed
by implementing real-time access to patient profile data and prescription history throughout all its stores. This allows for a complete, real-time view of pharmacy-related information for its customers on
(1) the medications that are covered, (2) the amount of the deductible, and
(3) the amount of the co-payment at the point of service to enable better drug utilization reviews and enhance patient safety.
20 3. Examples of Entities Using Data to their Advantage/Disadvantage
RxHub takes the sum-total of those vendors and brings them together into a consortium. For example, if I have benefits through both my place of employment and my wife’s place of employment, the physician can see all those in one place and use the best benefits available to me as a patient.
Even if my prescriptions have been filled across different PBMs, my doctor’s office is able to view my complete prescription history as I come in. This is real-time recognition in its ultimate form. Because there is a consortium of PBMs, RxHub cannot access the data from the different members until it is asked for the prescription history of an individual patient. Then, in real time, RxHub identifies and links the records from the appropriate source files and consolidates the information on the patient for the doctor. RxHub is able to complete a search for an individual patient’s prescription history in under 1
4 second.
3.1.5. Choice Hotels International
Choice Hotels International had built a data warehouse consisting entirely of its loyalty program users in order to analyze its best customers. Choice assumed that its loyalty program users were its best customers. Moreover, in the past, Choice could only uniquely identify customers who were in its loyalty program. Then, Choice hired Initiate Systems, Inc. to analyze its data. Initiate Systems discovered that (1) only 10% of Choice’s customers ever used a loyalty number and (2) only 30% of Choice’s best customers (those who had at least two stays during a 3-month period) used a loyalty number. So, Choice’s data warehouse only contained a small portion of its best customers.
Once Initiate Systems was able to implement software that uniquely identified Choice customers who had never used a unique identifier, Initiate Systems was able to give Choice a clearer picture of its true best customers. By using Initiate’s solution, Initiate Identity Hub™ software, Choice now stores data on all of its
customers in its data warehouse, not just the 10% who are members of its loyalty program.
For example, a customer might have 17 stays during a calendar year at 14 different Choice Hotels and never use a loyalty number. Because all the hotels are franchised, they all have their own information systems. So, the information sent to Choice’s data center originates in different source systems and in different formats. Initiate Systems’ software is able to integrate these data within the data warehouse by uniquely identifying Choice’s customers across these disparate source systems.
3.2.
Data Quality Problems and their Consequences
3.2. Data Quality Problems and their Consequences 21
3.2.1. Indians and Teenage Widows
As reported by Coale and Stephan [1962], “[a]n examination of tables from the 1950 U.S. Census of Population and of the basic Persons punch card, shows that a few of the cards were punched one column to the right of the proper position in at least some columns.” As a result, the “numbers reported in certain rare categories – very young widowers and divorces, and male Indians – were greatly exaggerated.”
Specifically, Coale and Stephan [1962] observed that
a shift of the punches intended for column 24 into column 25 would translate relationships to head of household (other than household head itself) into races other than white. Specifically, a white person whose relationship to the head waschildwould be coded as a male Indian, while a Negro child of the household head would be coded as a female Indian. If the white child were male, he would appear as an Indian in his teens; if female, as an Indian in his twenties. Since over 99% of “children” are under 50, and since the shift transfers [the] first digit of age in to the second digit of age, the erroneous Indians would be 10–14 if really male, and 20–24 if really female.
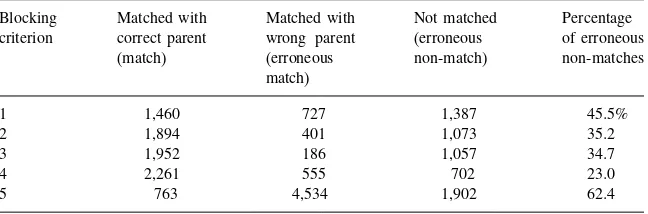
For example, in the Northeastern Census Region (of the United States), an area where the number of Indian residents is low, the number of male Indians reported by age group is shown in Table 3.1.
The number of male Indians shown in Table 3.1 appears to be monotonically declining by age group if we ignore the suspect entries for age groups 10–14 and 20–24. This leads us to suspect that the number of male Indians should be between (1) 668 and 757 for the 10–14 age group and (2) 596 and 668 for the 20–24 age group. This adds support to the conjecture that the number of male Indians in the 10–14 and 20–24 age groups is indeed too high.
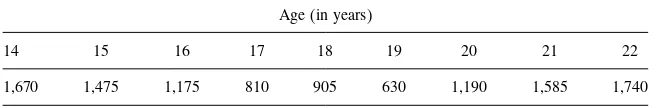
For teenage males, there were too many widowers, as can be seen from the Table 3.2.
Table 3.1.Number of reported male Indians Northeastern US, 1950 census
Age (in years)
Under 5 5–9 10–14 15–19 20–24 25–29 30–34 35–39 40–44
895 757 1,379 668 1,297 596 537 511 455
Source: Table 3, US Bureau of the Census [1953b]
Table 3.2.Number of (male) widowers reported in 1950 census
Age (in years)
14 15 16 17 18 19 20 21 22
1,670 1,475 1,175 810 905 630 1,190 1,585 1,740
22 3. Examples of Entities Using Data to their Advantage/Disadvantage
In particular, it is not until age 22 that the number of reported widowers given in Table 3.2 exceeds those at age 14.
3.2.2. IRS versus the Federal Mathematician
Over 30 years ago, a senior mathematician with a Federal government agency got a telephone call from the IRS.
IRS Agent: “You owe us $10,000 plus accrued interest in taxes for last year. You earned $36,000 for the year, but only had $1 withheld from your paycheck for Federal taxes.”
Mathematician: “How could I work the entire year and only have $1 withheld? I do not have time to waste on this foolishness! Good-bye.”
Question: What happened?
Answer: The Federal government agency in question had only allocated enough storage on its computer system to handle withholding amounts of $9,999.99 or less. The amount withheld was $10,001. The last $1 made the crucial difference!
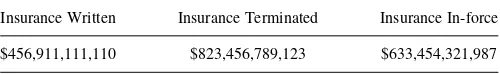
3.2.3. The Missing $1,000,000,000,000
A similar problem to the IRS case occurs in the Table 3.3.
Notice that the entry in the first column is understated by $1,000,000,000,000 because the computer software used to produce this table did not allow any entries over $999,999,999,999.99.
3.2.4. Consultant and the Life Insurance Company
A life insurance company4 hired a consultant to review the data quality of
its automated policyholder records. The consultant filled out the necessary paperwork to purchase a small life insurance policy for himself. He was shocked when the company turned him down, apparently because the company classified him as “unemployed.” The reason: he had omitted an “optional” daytime phone number and had only supplied the number for his cell-phone.
A more typical problem that this consultant reports concerns “reinstatements” from death. This frequently occurs on joint-life policies, such as family plans, where the policy remains in force after the first death claim. Shortly after the death of the primary insured, both the primary coverage status and the status of
Table 3.3.Status of insurance of a large insurance company
Insurance Written Insurance Terminated Insurance In-force
$456,911,111,110 $823,456,789,123 $633,454,321,987
3.2. Data Quality Problems and their Consequences 23
the entire policy are changed to “death.” A month later, the surviving spouse’s coverage status is changed to “primary” and the policy appears to have been “reinstated from death.”
A final insurance example concerns a study of insurance claims on a large health insurance company. The company had an unusually high rate of hemor-rhoid claims in its Northwest region. Further investigation revealed that the claim administration staff in this region did not think this code was used for anything and so used it to identify “difficult” customers. While this study may be apocryphal, our consultant friend reports many other cases that are logically equivalent, although not as amusing.
3.2.5. Fifty-two Pickup
One of the mortgage companies insuring its mortgages with the Federal Housing Administration (FHA) had 52 mortgages recorded on its internal computer system under the same FHA mortgage case number even though each mortgage is assigned its own distinct FHA mortgage case number. This prevented the mortgage company from notifying FHA when the individual mortgages prepaid. Needless to say, it took many hours for the mortgage company staff working together with FHA to correct these items on its computer system.
3.2.6. Where Did the Property Tax Payments Go?
5The Washington Post’s February 6, 2005, edition reported that an unspec-ified computer error caused serious financial problems for a group of bank customers:
Three years ago in Montgomery County [Maryland], a mistake at Washington Mutual Mortgage Corp. resulted in tax payments not being correctly applied to 800 mortgages’ property taxes. Most homeowners learned of the problem only when they received county notices saying that they were behind on their property taxes and that their homes might be sold off. The county later sent out letters of apology and assurances that no one’s home was on the auction block.
3.2.7. The Risk of Massive ID Fraud
One day during May of 2004, Ryan Pirozzi of Edina, Minnesota, opened his mailbox and found more than a dozen bank statements inside. All were made
24 3. Examples of Entities Using Data to their Advantage/Disadvantage
out to his address. All contained sensitive financial information about various accounts. However, none of the accounts were his.
Because of a data entry error made by a clerk at the processing center of Wachovia Corp., a large bank headquartered in the Southeastern United States, over the course of at least 9 months, Pirozzi received the financial state-ments of 73 strangers all of whom had had escrow accounts with this bank. All of these people, like Pirozzi, bought real estate through the Walker Title and Escrow Company headquartered in Fairfax, Virginia. Their names, Social Security numbers, and bank account numbers constitute an identity thief’s dream. Then, during January 2005, Pirozzi began receiving completed 1099 tax forms belonging to many of these people. After inquiries from a reporter for The Washington Post, both Wachovia and the Walker Company began investigating the problem. This revealed that many people who purchased a condominium unit at the Broadway in Falls Church, Virginia were affected. These homebuyers were given a discount for using the developers’ preferred choice, Walker, to close on the purchase of their condominium units. In order to secure a condominium unit in the new building, prospective homebuyers made deposits that were held in an escrow account at Wachovia.
The article inThe Washington Post relates some comments of Beth Givens, director of the Privacy Rights Clearinghouse headquartered in San Diego.
Givens said that this case demonstrates that identity theft doesn’t always stem from people being careless with their financial information; the institutions that people trust with that information can be just as negligent. Although the worst didn’t happen here, information gleaned from misdirected mail can wind up on the black market, sold to the highest bidder.
There have been instances, Givens said, in which mail processing systems misfire and match each address with a name that’s one off from the correct name. In those situations, she said, hundreds or even thousands of pieces of mail can go to the wrong address. But those kinds of mistakes are usually noticed and corrected quickly.
The Washington Postarticle also quoted Chris Hoofnagle, associate director of the Electronic Privacy Information Center, as saying,
It should be rather obvious when a bank sends 20 statements to the same address that there’s a problem. But small errors can be magnified when you’re dealing with very large institutions. This is not your neighborhood bank.
The article also reported that Mr Hoofnagle “said it would not be difficult for Wachovia to put safeguards in place to catch this kind of error before large numbers of statements get mailed to the wrong person.” The article did not provide the specifics about such safeguards.
3.3. How Many People Really Live to 100 and Beyond? 25
3.3.
How Many People Really Live to 100
and Beyond? Views from the United States,
Canada, and the United Kingdom
Satchel Paige was a legendary baseball player. Part of his lore was that nobody ever knew his age. While this was amusing in his context, actuaries may be troubled because they can’t determine the age of the elderly around the world. This makes it difficult to determine mortality rates. A related issue is whether the families of deceased annuitants are still receiving monthly annuity payments and, if so, how many?
On January 17–18, 2002, the Society of Actuaries hosted a symposium on
Living to 100 and Beyond: Survival at Advanced Ages. Approximately 20 papers were presented at this conference. The researchers/presenters discussed the mortality experience of a number of countries in North America, Europe, and Asia. The papers by Kestenbaum and Ferguson [2002], Bourdeau and Desjardins [2002], and Gallop [2002] dealt with the mortality experience in the United States, Canada, and the United Kingdom, respectively. Many of the papers presented at this symposium dealt explicitly with data quality problems as did those presented at a follow-up symposium held during January, 2005. These studies illustrate the difficulty of obtaining an unambiguous, generally agreed-upon solution in the presence of messy age data.
3.3.1. United States
Mortality of Extreme Aged in the United States in the 1990s, based on Improved Medicare Data, by Kestenbaum and Ferguson, describes how to improve the quality of information on old-age mortality in administrative databases by (1) careful selection of records, (2) combining sources (i.e., linking records from two or more databases6), and (3) obtaining supplemental information from other
government agencies. According to Kingkade [2003], the authors’ “meticulous” scheme “does not remove every indelicacy in the schedule of probabilities of dying, but it vastly improves the schedule’s plausibility.”
3.3.2. Canada
In Dealing with Problems in Data Quality for the Measurement of Mortality at Advanced Ages in Canada, Robert Bourdeau and Bertrand Desjardins state (p. 13) that “after careful examination , it can be said that the age at death for centenarians since 1985 in Quebec is accurate for people born in Quebec”. On the other hand, the formal discussant, Kestenbaum [2003], is “suspicious” about “the accuracy of age at death” in the absence of “records at birth or shortly thereafter.”
26 3. Examples of Entities Using Data to their Advantage/Disadvantage
3.3.3. United Kingdom
InMortality at Advanced Ages in the United Kingdom, Gallop describes the infor-mation on old-age mortality of existing administrative databases, especially the one maintained by the United Kingdom’s Department of Work and Pensions. To paraphrase the formal discussant, Kingkade [2003], the quality of this database is highly suspect. The database indicates a number for centenarians that vastly exceeds the number implied by a simple log of the Queen’s messages formally sent to subjects who attain their 100th birthday. The implication (unless one challenges the authority of the British monarch) is that the Department’s database grossly overstates longevity.
3.4.
Disabled Airplane Pilots – A Successful Application
of Record Linkage
The following example shows how record linkage techniques can be used to detect fraud, waste, or abuse of Federal government programs.
A database consisting of records on 40,000 airplane pilots licensed by the US Federal Aviation Administration (FAA) and residing in Northern California was matched to a database consisting of individuals receiving disability payments from the Social Security Administration. Forty pilots whose records turned up on both databases were arrested. A prosecutor in the US Attorney’s Office in Fresno, California, stated, according to an Associated Press [2005] report, “there was probably criminal wrongdoing.” The pilots were “either lying to the FAA or wrongfully receiving benefits.”
“The pilots claimed to be medically fit to fly airplanes. However, they may have been flying with debilitating illnesses that should have kept them grounded, such as schizophrenia, bipolar disorder, drug and alcohol addiction and heart conditions.”
At least 12 of these individuals “had commercial or airline transport licenses.” “The FAA revoked 14 pilots’ licenses.” The “other pilots were found to be lying about having illnesses to collect Social Security [disability] payments.”
The quality of the linkage of the files was highly dependent on the quality of the names and addresses of the licensed pilots within both of the files being linked. The detection of the fraud was also dependent on the completeness and accuracy of the information in a particular Social Security Administration database.
3.5.
Completeness and Accuracy of a Billing Database:
Why It Is Important to the Bottom Line
3.6. Where Are We Now? 27
main billing database that tracks (1) the days certain patients were treated, (2) the patients’ insurance companies, (3) the dates that bills were sent to the patient, (4) the dates certain bills were paid, and (5) the entity that paid the bill (i.e., the health insurance company or the individual patient). Changes in the billing database are made as bills are paid. Each staff member in the practice who has access to the database (via software) has a login identifier that allows tracking of the changes that the individual made in the database. The medical assistants and the doctors are all given training in the software. One doctor acts as the quality monitor.
In reviewing the data in preparation for an ending fiscal year, the doctors realize that their practice is not receiving a certain proportion of the billing income. Because of the design of the database, they are able to determine that one doctor and one medical assistant are making errors in the database. The largest error is the failure to enter certain paid bills in the database. Another error (or at least omission) is failure to follow-up on some of the bills to assure that they are paid in a timely manner. After some retraining, the quality monitor doctor determines that the patient-billing portion of the database is now accurate and current.
After correcting the patient-billing portion, the doctors determine that their net income (gross income minus expenses) is too low. They determine that certain expenses for supplies are not accurate. In particular, they deduce that (1) they neglected to enter a few of their expenses into the database (erroneously increasing their net income), (2) they were erroneously double-billed for some of their supplies, and (3) a 20% quantity discount for certain supplies was erroneously not given to them.
3.6.
Where Are We Now?
These examples are not a random sample of our experiences. We chose them to illustrate what can go right and, alas, what can go wrong. One of the reasons we wrote this book is that we believe good experiences are too infrequent and bad ones are too common.
4
Properties of Data Quality and Metrics
for Measuring It
Metrics for measuring data quality (or lack of it) are valuable tools in giving us some quantitative objective measure of the problems we may be dealing with. In this chapter, we first discuss a few key properties of high-quality databases/lists. This is followed by a number of typical examples in which lists might be merged. Finally, we present some additional metrics for use in assessing the quality of lists produced by merging two or more lists.
Although quantification and the use of appropriate metrics are needed for the quality process, most current quantification approaches are created in an ad hoc fashion that is specific to a given database and its use. If there are several uses, then a number of use-specific quantifications are often created. For example, if a sampling procedure determines that certain proportions of current customer addresses are out of date or some telephone numbers are incorrect, then a straightforward effort may be needed to obtain more current, correct information. A follow-up sample may then be needed to determine if further corrections are needed (i.e., if the database still lacks quality in some respect). If no further corrections are needed, then the database may be assumed to have an acceptable quality for a particular use.
4.1.
Desirable Properties of Databases/Lists
Ideally, we would like to be able to estimate the number of duplicate records as well as the number of erroneous data items within a database/list. We would like every database/list to be complete, have few, if any, duplicate records, and have no errors on the components of its data records. If a corporation’s mailing list of business or retail customers is incomplete, this could lead to lost business opportunities. If the list consists of subscribers to a magazine, the omission of subscribers from the magazine’s mailing list could lead to extra administrative expense as the subscribers call the company to obtain back issues of magazines and get added to the mailing list.
Duplicate records on corporate databases can lead to extra printing and postage costs in the case of a mailing list of retail customers or double billing of