THE CHANGE OF BODY COMPOSITION OF INDIGENOUS RAMS ON DIFFERENT
BODY WEIGHT AND FEEDING LEVEL
A. R. Setyawan, E. Rianto, Sunarso, K. Setyaningsih and G. Mahesti
Faculty of Animal Agriculture, Universitas Diponegoro, Tembalang Campus, Semarang 5027, Central Java - Indonesia
Corresponding E-mail: [email protected] Received April 15, 2009; Accepted May 26, 2009
ABSTRACT
The aim of this research was to investigate the influence of body weight and feeding level on the change of body composition of indigenous ram. This research was expected to establish the efficient feeding level to produce high growth rate and meat quality of ram in tropical environment. Sixteen rams with different body weight (BW) were divided into 2 groups, i.e. light BW (10 + 1.47 kg) and heavy BW (18 + 1.18 kg). The experimental design was Split Plot design with two factors. The main plot was body weight (light and heavy) and the sub plot was level of feeding (FL, 1x maintenance and 1.5 x maintenance). The parameters measured in this experiment were live weight gain and body composition. The results of this study showed that body water, body protein and body fat were significantly higher (P<0.01) in heavy body weight (HBW) than those in light body weight (LBW), and was higher in 1.5xM than those 1xM. Ram of HW and LW had similar change rate of physical composition. Ram given 1.5xM had higher rate of change of body fat and body water than those given feed at maintenance level. It can be concluded that there was no interaction between BW and FL on the change of body water, body protein and body fat. Ram of HBW and LBW had similar rate of change of physical composition. Level of feeding affected body water content, the higher level of feeding resulted in fatter ram, leading to less body water content.
Keywords: Body Weight, Feeding Level, Maintenance, Body Composition
INTRODUCTION
The success of ruminant management is indicated by high body weight gain. To increase the livestock productivity, daily management must be done in a good way. Productivity of ruminant is affected by feed, genetic and environmental factors. Production of meat, the primarily goal of ruminant production was depend on the growth process. The gr owth phenomenon is the essential process in the livestock and meat industry, both from the standpoint of animal growth and in production of most feedstuffs that ruminants convert to meat. Basic understanding of animal growth has potential for solving problems of efficiency in ruminant production.
Tissues grow and develop chronologically in specific “growth waves.” Certain tissues grow and mature before others; growth starts with neural tissue
and proceeds to bone, muscle tissue, and finally adipose tissue. Within each of these tissues, development can be early, medium, or late depend on its location in the body. For example, deposition of fat near the kidney precedes deposition at intermuscular, subcutaneous, and intramuscular sites. Hence, body shape and composition change as an animal matures. Supply of dietary nutrients must be coordinated with this progression to maintain optimum growth rates.
correlation with age and body weight (Ensminger, 1992; Burton and Reid, 1968). In animals containing less than 31% of fat, the amounts of body components increased linearly with the increasing of body weight; above this concentration of fat, the weights of water and protein increased at decreasing rates and the amounts of fat and energy increased at increasing rates, as body weight increased.
Feed is needed by an animal to fulfill the nutrient requirement for maintenance and production. The first function of feed is to maintain the body condition without developing body tissues and organ (Pond et al. , 1995). Aft er t he ma int enance requirement has been fulfilled, feed is used for growth and other production such as muscle
growth and fat deposition. Waters cited by Burton a nd R eid (1 968) st a t ed t ha t ca t t le fed a t maintenance or slightly submaintenance level after they had been reared on high nutrition to an age of 9 to 17 months, continued to grow in height and length of skeleton for at least 1 year, during which time body fat was depleted. This observation indicated that certain tissues (bone) have a higher priority claim for nutrients than other tissues on certain stages of growth. Feeding level influences growth rate, fat deposition and carcass composition in every stage of age; animals with different feeding level have different body composition, although they are in the same body weight and breed (Hammond cited by Lawrie, 1995).
The aim of this research was to investigate the influence of body weight and feeding level on the change of body composition in rams. This research
was expected to establish the efficient feeding level to produce high growth rate of rams in tropical environment.
MATERIALS AND METHODS
Materials
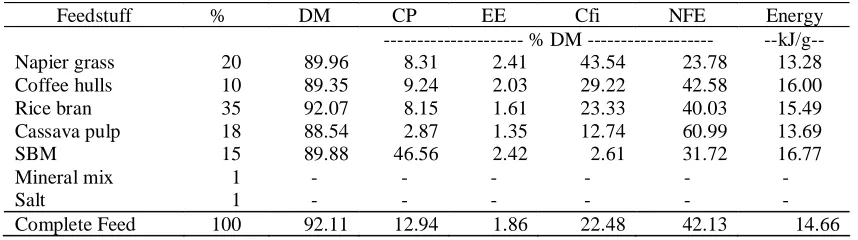
Sixteen thin tailed rams with different body weight (BW) were divided into 2 groups, i.e. light BW (weighed 10 + 1.47 kg; aged 6 to 7 months) and heavy BW (weighed 18 + 1.18 kg; aged 9 to 12 months). The rams were placed in individual pens and fed a complete feed containing ±12.6% crude protein of dry matter and 14.66 kJ/g of energy (Table 1).
Methods
Experimental Design
The experimental design was “Split Plot Design” with two factors. The main plot was 2 groups of BW (light BW and heavy BW) and the sub plot were two levels of feeding, it was allowed to fulfill 1x maintenance (equal t o 2.4% BW) and 1.5 x maintenance (equal to 3.6% BW) requirements.
Experimental Procedures
The study was carried out in 14 weeks with 4 periods, i.e; adaptation period (2 weeks), preliminary period (2 weeks) and feeding treatment period (10 weeks). In order to determine dry matter requirement, every ram were weighed at the biginning of adaptation periode. The feeding level of 1xM was determined by maintaining the animals at zero gain, while the
Table 1. Diet Formulation and its Chemical Composition.
1.5xM was obtained by multiplying 1xM level feeding with 1.5. The diets from this calculation were given to rams based on DM requirement.
Parameters
The parameters measured in this experiment were live weight gain and body composition. The live weight gain (LWG) measured by subtracting final weight by initial weight of the experimental period. Body composition was measured using Urea Space (US) technique as recommended by Astuti and Sastradipradja (1998). The changes of body composition (water, protein, and fat) were measured in the 2nd , 6th and 8th weeks of treatment period.
Urea dilution trials were performed on all 16 rams. Urea space technique procedures were as follow:
A day before the trial, the sheep were weighed to measure their body weight and calculate the metabolic body weight (BW0,75). The dose was 0.65
ml urea solution for every kilogram metabolic body weight. A hundred grams of crystal urea was diluted into 500 ml NaCl to make urea solution.
Before urea dilution being administered into the rams blood, 10 ml blood sample was collected from the jugular vein of each sheep to determine plasma urea concentration. Then, a urea solution was administered using catheter, inserted into a jugular vein. After infusion, the catheter was flushed with 10 ml of NaCl and then removed. The actual quantity of urea injected was determined gravimetrically by weighing syringes before and after injection.
Ten milliliters blood sample was collected from the jugular vein 12 min after the mean of infusion time. The blood sample was than stored in push-up tubes, placed immediately in an ice bath and then centrifuged at 3000 rpm for 10 min. An amount of blood plasma subsample was taken from the sample and frozen at -5 °C for the subsequent determination of plasma urea concentration.
Urea concentration in the blood plasma was measured using Berthelot method with a commercial kit (Bavaria diagnostica, Hamburg, Germany) containing 4 solutions. Before blood plasma being analyzed, preparations of standard solution need to be done, there was R1A made by mixed R2 to R1. Urea standard were made to have 0 mg/dl (100% aquabides), 12.5 mg/dl (aquabides : STD = 3:1), 25 mg/dl (aquabidest : STD = 1:1) and 50 mg/dl (100%
STD). Ten microlitters of blood plasma and urea standard was taken by micropipette into the tube. Then, 1000 ?l R1A and aquabides were add into each tube and incubate in the water-bath at 370C for 5
min. Next step were adding 100 l of R3 into each tube and incubate in the water-bath at 370C for 5
min. Each sample was then measured for urea determination using spectrophotometer.
Urea space was calculated from the dose of urea N injection, urea space was calculated on both a live weight (LW) and empty body weight (EBW) basis using the following equation (Bartle et al., 1983):
Change in BUN was expressed in mg of urea-N/ 100 ml plasma and body weight as either LW or EBW. Change in BUN was calculated by difference between BUN at 0 and 12 minute after urea injection. Empty body weight was defined as body weight minus the content of alimentary tract. The equation for determining empty body water (EBH2O) following Rule et al. (1986), while for protein (EBPro) and fat (EBFat) were calculated as Panaretto and Till (1963). All parameters, except EBPro (in kg) were expressed s percentage of empty body weight, as follow:
EB-H2O (%) = 59.1 + 0,22 x US (%) – 0.44 LW …... (1)
Data were analyzed using analysis of variance by SAS Institute Inc. (1998). Split plot was used to analyze main effects of body weight, feeding levels and their interactions. Least square means were computed and tested for treatment differences. If there were no differences in two-way interactions (P>0.05), then data were then analyzed for the main effects of weight and feed in one-way anova.
RESULTS AND DISCUSSION
Water Intake and Live Weight Gain
The effect of the treatments on the water intake and live weight gain (LWG) are presented in Table 2.
(Dose of urea – N (mg) injected) US (%) =
There was an interaction between body weight and feeding level on LWG (P<0.05).
Heavy sheep with maintenance level of feeding have greater LWG than the light one, and light sheep
on the 1.5xM had less LWG than did the heavy one. The LWG were -0.01 and 0.00 g/d for light sheep on the 1xM and 1.5xM, respectively. The heavy sheep had -0.03 and 0.05 g/d LWG at maintenance and 1.5xM, respectively. Interaction between body weight and feeding levels on LWG were influenced by DMI. Tillman et al. (1991) informed that LWG was influenced by DMI.
The data of LWG of light and heavy body weight indicated that the feed given to the sheep did not fulfill the nutrient requirement for sheep. Present study was in contrast with feeding level requirement according to Kearl (1982), that sheep with 10 kg of BW would have 25 g/d of LWG if fed at 3.6 % of live weight and sheep with 20 kg BW on the 3% of live weight. In present study, sheep with LBW and HBW needed 3.6% of BW to fulfill maintenance requirement. Kearl (1982) mentioned that nutrient requirement of sheep on 10 kg of body weight on the maintenance level was 26 g and 140 g of CP and TDN, respectively; while nutrient requirement of sheep with 20 kg were 44 g CP and 240 g TDN. This experiment (Table 2) showed that CP intake and TDN of that sheep on 10 and 18 kg of body weight were 26.86 g/d; 171.91 g/d and 57.36 g/d; 367.07 g/ d. for maintenance requirement, respectively. This experiment showed that CP and TDN for maintenance requirement of indigenous sheep wer e higher than t hose recommended by Kearl (1982). This experiment also
showed that CP and energy balance for LW and HW was the same, it was 8.6 g for every 1 MJ of energy intake.
There was no interaction between body weight and feeding level on water intake (P>0.05). Water intake was higher in heavy body weight than those in light body weight (P>0.05), and those in the evaporation than those in the light body weight.
Body Composition
Body water
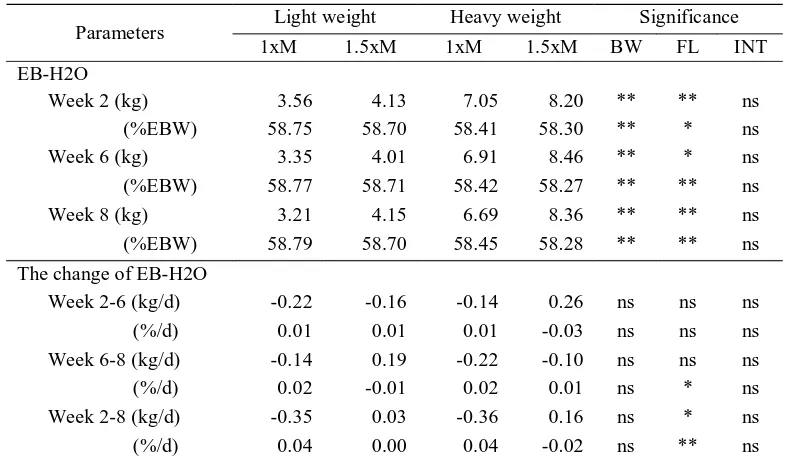
There was no interaction (P>0.05) between body weight and feeding level on both body water weight and percentage. The body water weight in the second week was higher (P<0.01) in the heavy sheep compared to those in the light sheep, and those in the 1xM was lower (P<0.01) than those in the 1.5xM (Table 3). The same cases occurs in the 6th and 8th
week of parameters measured, heavy sheep had higher body water conent compared to those in the light sheep (P<0.05). However, it was in contrast with the percentage of body water content from EBW. Increasing in animal age will followed by increasing the percentage of body fat and decreasing the proportion of body water, and slightly decreasing the body protein.
Table 2. Effects of Body Weight and Feeding Level and Their Interactions on Water Intake, CP Intake, Energy Intake and Live Weight Gain o f Indigenous Ra ms.
Light body weight Heavy body weight Significance
Light sheep have greater (P<0.01) body water percentage than did in the heavy sheep; and those in 1.5xM was lower (P<0.01) than in 1xM. It means
that as animal age increased, body water was decreased, confirmed with some study previously reported (Berg and Butterfield, 1976); Tillman et al., 1991).
There were significant differences (P<0.05) between feeding level in both body water weight and the percentage. It was considered to be caused by water intake being significantly different (P<0.05) between body weight and between feeding level (Table 3). Body water composition was affected by age, nutrition, animal type and decrease with the increasing of body weight (Jesse et al., 1976).
There were no significant differences between body weights and feeding levels in the change of body water weight between 2-6 weeks (P>0.05) (Figure 2), ranging from -0.22 to 0.26 kg/d and -0.03 to 0.02% in percentage, respectively. On the other hand, the percentage of the change of body water on 6-8, and 2-8 weeks were higher (P<0.05) in 1xM than those in 1.5xM. The percentage of the change of body water was greater (P<0.01) in 1.5xM of feeding level of the weight of body water.
Body protein
There was no interaction between body weight and feeding level on body protein content in body
composition. The body protein in 2nd , 6th and 8th
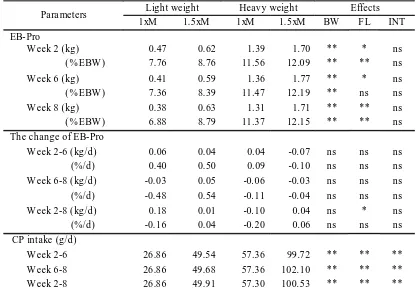
weeks in the heavy sheep were significantly higher (P<0.01) compared to those in the light sheep, both in weight and percentage of body protein (See Table 5). It can be attributed to the fact that CP intake in this experiment were significantly different (P<0.05) between body weight. Protein is exist in the muscle and bone, which arrange the body; so heavy body weight would have high body protein weight than those on the light body weight.
The percentage of body protein were higher (P<0.05) in those in the heavy sheep compared to those in the light sheep in every week of parameters measured, either between body weight or feeding level. The result of this experiment was in agreement with Soeparno (1994) who stated that most of body composition was affected by body weight and to some extent was affected by age of the animal. The percentage of body protein was in contrast with those cited by Judge et al. (1989), that body protein was 16 to 22% of empty body weight.
Table 3. Effects of Body Weight and Feeding Level and Their Interactions on Body Water, Weekly Change of Body Water and Water Intake of Indigenous Rams.
Light weight Heavy weight Significance
Parameters
1xM 1.5xM 1xM 1.5xM BW FL INT
EB-H2O
Week 2 (kg) 3.56 4.13 7.05 8.20 ** ** ns
(%EBW) 58.75 58.70 58.41 58.30 ** * ns
Week 6 (kg) 3.35 4.01 6.91 8.46 ** * ns
(%EBW) 58.77 58.71 58.42 58.27 ** ** ns
Week 8 (kg) 3.21 4.15 6.69 8.36 ** ** ns
(%EBW) 58.79 58.70 58.45 58.28 ** ** ns
The change of EB-H2O
Week 2-6 (kg/d) -0.22 -0.16 -0.14 0.26 ns ns ns
(%/d) 0.01 0.01 0.01 -0.03 ns ns ns
Week 6-8 (kg/d) -0.14 0.19 -0.22 -0.10 ns ns ns
(%/d) 0.02 -0.01 0.02 0.01 ns * ns
Week 2-8 (kg/d) -0.35 0.03 -0.36 0.16 ns * ns
(%/d) 0.04 0.00 0.04 -0.02 ns ** ns
The percentage of body protein in 6th week was
not affected by feeding levels. This result was in agreement with Tillman et al. (1991) and Soeparno (1994) who have repor ted that body protein percentage is not affected by age and feed on the stage of maturity.
From the point of view of body protein change, the differences of body protein in every week parameters measured were not followed by the change of body protein and its percentage in the 2-6, 6-8 and 2-8 weeks measurement (P>0.05), ranged from -0.10 to 0.18 kg/d. This was in agreement with Tillman et al. (1991) that body protein was tended to be constant on the stage of maturity and was not affected by feed. It was proved by CP intake in 2-6, 6-8 and 2-8 week were significantly different (P<0.05) in body weight and feeding level. However, body protein is affected by genetic, because protein exists in the muscle and bone, and those were arranged the body. The research conducted by Garrett et al. (1959) reported that sheep fed on maintenance level had 16.2% body
protein and increased with the increasing of animal size (and gain).
Body fat
Observations on the body fat obtained that the change of body fat and energy intake as shown in Table 5.
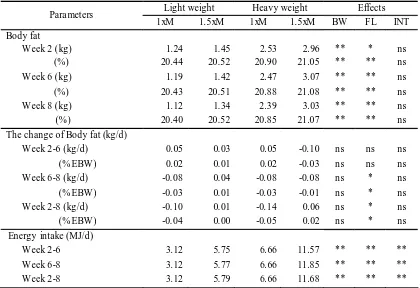
There was no interaction (P>0.05) between body weight and feeding level on body fat in every week of measurement. The percentage of body fat was higher (P<0.01) in the heavy sheep than those in light sheep. The body fat was higher (P<0.01) in 1.5xM of feeding levels than that in 1xM. The average of body fat in this experiment was higher than the research reported by Garrett et al. (1959) that sheep body fat at maintenance level of feeding was 18.7% of body weight, and increased with body weight.
The changes of body fat were significantly different (P<0.01) in every week of measurement, except from 2nd to 6th weeks of data collection
period (P <0. 05). Energy intake were higher
Table 4. Effects of Body W eight and Feeding Level and Their Interactions on Body Protein, The Change Of Body P rotein and CP Intake of Ind igenous Ra ms .
Light weight Heavy weight Effects
Para meters
1xM 1.5xM 1xM 1.5xM BW F L INT
EB-Pro
W eek 2 (kg) 0.47 0.62 1.39 1.70 ** * ns
(% EBW ) 7.76 8.76 11.56 12.09 ** ** ns
W eek 6 (kg) 0.41 0.59 1.36 1.77 ** * ns
(% EBW ) 7.36 8.39 11.47 12.19 ** ns ns
W eek 8 (kg) 0.38 0.63 1.31 1.71 ** ** ns
(% EBW ) 6.88 8.79 11.37 12.15 ** ** ns
The change of EB-Pro
W eek 2-6 (kg/d) 0.06 0.04 0.04 -0.07 ns ns ns
(%/d) 0.40 0.50 0.09 -0.10 ns ns ns
W eek 6-8 (kg/d) -0.03 0.05 -0.06 -0.03 ns ns ns
(%/d) -0.48 0.54 -0.11 -0.04 ns ns ns
W eek 2-8 (kg/d) 0.18 0.01 -0.10 0.04 ns * ns
(%/d) -0.16 0.04 -0.20 0.06 ns ns ns
CP intake (g/d)
W eek 2-6 26.86 49.54 57.36 99.72 ** ** **
W eek 6-8 26.86 49.68 57.36 102.10 ** ** **
W eek 2-8 26.86 49.91 57.30 100.53 ** ** **
(P<0.01) in heavy sheep compared to those in light sheep, and was higher in 1.5xM (P<0.01) of feeding levels. High energy intake resulted in reduction of body protein and increase of body fat (Crouse et al. cited by Soeparno, 1994). These results showed that sheep, with heavy weight and light weight given 1.5xM feeding level, needed 6 weeks to increase body fat, from week 2 to week 8 of feeding treatment period.
CONCLUSION
Based on the results in this study, it can be concluded that there was no interaction between BW and FL on the change of body water, body protein and body fat. Rams given 1.5xM feeding level had higher rate of change of body fat and body water than those given feed at maintenance level. Both light and heavy rams lose body weight when they were fed 2.4% body weight. It is recommended that rams should be offered diet 3.6% of body weight, with CP
Table 5. Effects of Body Weight and Feeding Level and Their Interactions on Body Fat, Weekly Change of Body Fat and Energy Intake of Indigenous Ra m.
Light weight Heavy weight Effects
Para meters
1xM 1.5xM 1xM 1.5xM BW FL INT
Body fat
Week 2 (kg) 1.24 1.45 2.53 2.96 ** * ns
(%) 20.44 20.52 20.90 21.05 ** ** ns
Week 6 (kg) 1.19 1.42 2.47 3.07 ** ** ns
(%) 20.43 20.51 20.88 21.08 ** ** ns
Week 8 (kg) 1.12 1.34 2.39 3.03 ** ** ns
(%) 20.40 20.52 20.85 21.07 ** ** ns
The change of Body fat (kg/d)
Week 2-6 (kg/d) 0.05 0.03 0.05 -0.10 ns ns ns
(% EBW) 0.02 0.01 0.02 -0.03 ns ns ns
Week 6-8 (kg/d) -0.08 0.04 -0.08 -0.08 ns * ns
(% EBW) -0.03 0.01 -0.03 -0.01 ns * ns
Week 2-8 (kg/d) -0.10 0.01 -0.14 0.06 ns * ns
(% EBW) -0.04 0.00 -0.05 0.02 ns * ns
Energy intake (MJ/d)
Week 2-6 3.12 5.75 6.66 11.57 ** ** **
Week 6-8 3.12 5.77 6.66 11.85 ** ** **
Week 2-8 3.12 5.79 6.66 11.68 ** ** **
BW = main effect of body weight; FL = effect level of feeding; INT = interaction between body weight and level of feeding; M = maintenance; **= significant at P<0.01; * = significant at P<0.05; ns = non significant at P>0.05).
and energy balance being 8.6 g for every 1 MJ of gross energy intake to meet the maintenance requirement.
REFERENCES
Anggorodi, R. 1994. Ilmu Makanan Ternak Umum.5th
Ed, PT Gramedia, Jakarta.
Astuti, D.A. and D. Sastradipradja. 1998. Evaluation of body composition using urea dilution and slaughter technique of growing priangan sheep. Media Veteriner. 6(3):5-9
Bartle, S. J., J. R. Males and R. L. Preston. 1983. Evaluation of urea dilution as an estimator of body composition in mature cows. J. Anim. Sci. 60: 410-418
Berg, R. T. and R. M. Butterfield. 1976. New Concepts of Cattle Growth. 1st Ed, Sydney
University Press, Sydney.
composition of sheep. J. Nutrition. 97: 517-524 Edey, T.N. 1983. Tropical Sheep and Goat Production
Freeman and Co., San Fransisco.
Ensminger, M.C. 1992. Beef Cattle Science. Animal Agriculture Series. 7th Ed, Interstate Printer and
Publisher Inc, Danville.
Garrett, W. N., J. H. Mayer, and G. P. Lofgreen. 1959. The comparative energy requirements of sheep and cattle for maintenance and gain. J. Anim. Sci. 18: 528-547
Jesse, G.W., G.B. Thomson, J.L. Clark, H.B. Hendrick and K.G. Weimer. 1976. Effects of ration energy and slaughter weight on composition of empty body and carcass gain of beef. J. Anim. Sci. 53 : 418 Judge, M.D., E.D. Aberle, J.C. Forrest, H.B. Hedrick
and R.A. Merkel. 1989. Principles of Meat Science. Kendall/Hunt Publishing Company, Dubuque, Iowa.
Kearl, L. C. 1982. Nutrition Requirements of Ruminants in Developing Countries. International Feedstuff Utah Agriculture Experiment Station. 1st Ed, Utah State University, Logan.
Lawrie, R.A. 1995. Meat Science. Low Temperature Research Sta tion, Nottingham University. Cambridge.
Pana retto, B.A. a nd A.R. Till. 1963. Body Composition In vivo (II). Aust. J. Agric. Res. 14: 926-943.
Pond, W.G., D.C. Church and K.R. Pond. 1995. Basic Animal Nutrition and Feeding. 4th, John Wiley and
Sons, Inc., New York.
Rule, D. C., R. N. Arnold, E. J. Hentges and D. C. Beitz. 1986. Evaluation of urea dilution as a technique for estimating body composition of beef steers in vivo” validation of published equations and comparison with chemical composition. J. Anim. Sci. 64:1935-1948
Soeparno. 1994. Ilmu dan Teknologi Daging. 1st Ed,
Gadjah Mada University Press, Yogyakarta. Tillman, A. D., H. Hartadi, S. Reksohadiprojo, S.
Prawirokusumo and S. Lebdosoekojo. 1991. Ilmu Makanan Ternak Dasar. 5th Ed, Gadjah Mada