Directory UMM :Data Elmu:jurnal:J-a:Journal of Experimental Marine Biology and Ecology:Vol243.Issue1.Jan2000:
Teks penuh
Gambar
Dokumen terkait
In the present study, the higher the storage temperature and the longer the duration of storage, the lower the initial increase in fresh weight and the greater the decrease in
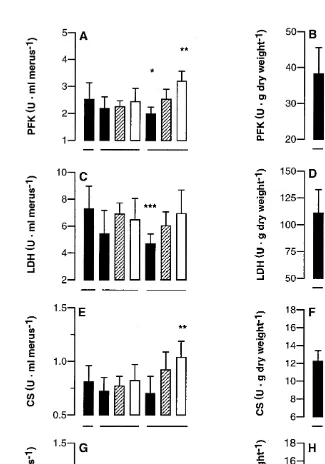
Significant negative simple correlations were noted between muscle growth rate and the enzyme activity expressed per g of protein (PFK, LDH, CS, CCO), per m g of DNA (CCO), and per g
Externae developed on three reared crabs — one Swedish and two Australian C. maenas — approximately 12 months after the experiments. Morphological examination of these and the
Relationship between lifespan and lifetime fecundity (a), and between lifespan and reproductive period (b) in periodically starved groups (circle and triangle, 23 h-starved and
Dry weight, ash, total carbon and nitrogen content of mysids (muscle tissue, eggs, and embryos of different developmental stages) have been analyzed.. We found significant variations
Estimates of size at 1 year and mean growth rate for Evechinus chloroticus in Tory Channel and Doubtful Sound using predictions from the Brody-Bertalanffy, Richards, Jolicoeur
Dried leaf fragments of the Mediterranean seagrass Posidonia oceanica were used as tracer particles to test if seagrass leaf canopies reduce particle resuspension1. Half Petri
Consequently, larval life history parameters in the plankton are generally affected by the same factors, namely temperature, food quality and quantity (Sprung, 1984), abundance
