SPECIAL ISSUE
THE HUMAN ACTOR IN ECOLOGICAL-ECONOMIC MODELS
Environment and institutions: a complex dynamical systems
approach
Ge´rard Weisbuch *
Laboratoire de Physique Statistique1 de l’Ecole Normale Supe´rieure,24rue Lhomond,F75231Paris Cedex5,France
Abstract
Environmental issues are characterised by uncertainty and problems of cooperation. Societal responses to such challenges are institutions: beliefs, norms, relationships, property rights, agencies, etc. We discuss here a bottom-up approach to the emergence of institutions such as beliefs and norms in pollution issues and agri-environmental policy implementation. The models are based on networks of automata, Bayesian updating and coupled map lattices. They exhibit clear organisational properties and regime transitions according to their parameters. The behaviours predicted by these models often differ from the predictions of standard economy based on unbounded rationality. © 2000 Elsevier Science B.V. All rights reserved.
Keywords:Environmental issues; Institutions; Bayesian
www.elsevier.com/locate/ecolecon
1. Introduction
Environmental issues are characterised by un-certainty and problems of cooperation.
Uncertainty has always been a constant of our
climatic and biological environment, but it re-cently increased due to the novelty of certain technical processes (e.g. nuclear power, use of new chemicals in agriculture and industry, new seeds). Uncertainty also increased because of
the new magnitude and the global aspect of the human impact on environment (e.g. resource depletion, water pollution, global change). Fi-nally, even when the physical and chemical properties of the processes are well understood, their biological impact is much harder to assess.
The use of environmental resources, or
pollu-tion of the environment, might be beneficial to the individual or the firm, user or polluter, and detrimental to the community (see e.g. Hardin (1968), the tragedy of commons).
Societal responses to such challenges are insti-tutions such as: beliefs, norms, preferential links,
* Tel.: +33-1-44323475; fax:+33-1-44323433.
E-mail address:[email protected] (G. Weisbuch). 1Laboratoire associe´ au CNRS (UMR 8550), a` l’ENS et aux Universite´s Paris 6 et Paris 7.
property rights, agencies, etc. (as discussed, for instance, in North (1990) in the general case). A number of religious beliefs and taboos of so-called ‘primitive societies’, such as animism, are institu-tions that most probably relate to the preserva-tion of the environment of these societies. Historical records about property rights in rela-tion to the use of environmental resources are well documented. Agencies to regulate fisheries or air pollution appeared in modern times.
Most of us are convinced that simple market mechanisms as described in the neo-classical eco-nomics of general equilibria are not sufficient to ensure sustainable development, and that new in-stitutions, or at least a renewal of institutions (the word being used in the above-defined meaning) are necessary. Hence the proposals to change property rights, invent new taxation or emission rights, to have new international agreements and agencies. In fact most of the discussion about the role of institutions is presently based on a top-down approach: some entity, most often a state, or a collection of states, decides on some environ-ment policy and how to impleenviron-ment it. There are probably situations where we can learn a lot from the top-down accounting approach. But such a view neglects issues about uncertainties, inhomo-geneities in the appreciation of environmental val-ues, distributive decision making (the fact that decisions are taken by inhomogeneous commit-tees) and obedience of constituents (people
con-cerned by a decision might not abide by the decision).
In those cases when uncertainties and inhomo-geneities of views and interests are important, or when obedience to the central government is not certain, the bottom-up approach makes more sense than top-down. In a bottom-up approach, one starts from individual agents with partial knowledge about their environment. Their choice of decision for action depends upon their motiva-tions and their internal representamotiva-tions of the world. Motivations can concern economic well-being, free time, aesthetic or moral values. They might include discount factors concerning future versus present. An internal representation of the world (in a modeling context) is typically a set of parameters adjusted by learning which allow agents to do prediction about the usefulness of their actions: e.g. linear predictors, weights in a neural net model, estimated parameters of a func-tion. Both sets of parameters, those shaping moti-vations and those shaping internal repre-sentations, are adjustable by learning. The learn-ing process allows for adaptation and explains the diversity of opinions: agents sample world condi-tions, but don’t share the same experience.
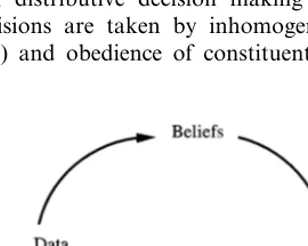
This framework is typical of decision making: how do agents with imperfect knowledge acquire new information and take individual or collective decisions on which product to buy, which tech-nique to use, whether to abide by regulations or subscribe to a new environmental contract (see further the example of AEMs (agri-environmental measure) discussed in Section 2). Dynamics be-come more intricate when one takes into account the fact that agents’ actions impinge on the state of the world, and that the resulting changes of the environment modifies agents’ parameters. The dy-namics of agent interactions unfolds and shapes institutions: beliefs, routines, eventually coopera-tion and the state of the world. Fig. 1 exemplifies a typical loop structure with cyclical interactions between agents and their environment. This figure could apply to any societal issue, such as the organisation of a market in economics, for in-stance: in that case we would replace the word ‘environment’ with ‘market’ in Fig. 1. What is
specific to a number of ecological economics problems is that the time scales of the dynamics of cognitive and environmental variables are com-parable; a standard approximation of economics, namely, the simplifying hypothesis of constant beliefs and preferences does not apply to the issues we are dealing with. The hypothesis of constant beliefs and preferences ‘cut the loops’ and makes modeling much easier.
In our case, the diversity of the agents and the complexity of their interactions, both mutual and with their environment, naturally call for a com-plex dynamical systems approach (Weisbuch, 1990). This consists of using numerical simula-tions as test-beds of simplified socio/ environmen-tal systems and concepts taken from nonlinear dynamics and statistical mechanics to understand the dynamical behaviours observed in the simula-tions. Rather than staying at this level of general-ity, which gives little insight to those who are not yet familiar with these modeling concepts, we propose to illustrate them with two examples taken from the modeling of environmental issues.
Adoption of environmental measures by a
pop-ulation of farmers (Weisbuch and Boudjema, 1999).
Pollution by fixed emitters (Weisbuch et al.,
1996).
These examples are based on a bounded ratio-nality approach, in the sense that agents have imperfect knowledge about their environment. The institutions that we describe are beliefs and norms of behaviours. Our main focus is descrip-tive, but the results presented could also be used for policy implementation. Extended versions of the models that we discuss here have been already published with many more simulations and for-mal computations, and we will not give all the details here. Our readers can refer to these publi-cations or their extended versions on our web site http://www.lps.ens.fr/weisbuch.
Apart from stressing the strong connection be-tween bounded rationality and environmental is-sues, the purpose of the present paper is to illustrate the wide range of possibilities within the complex systems approach and some of its limits.
2. Innovation diffusion
The discussion in this section will specifically refer to a model of the dynamics of adoption of agri-environmental measures by farmers in Eu-rope, but as said above, there is a large variety of related models discussing similar questions, such as: how do social agents take decisions on which product to buy (Fo¨llmer, 1974; Kirman, 1993; Orle´an, 1995; Latane´ and Nowak, 1997; Galam, 1997), which technique to use (Ha¨gerstrand, 1965) or whether to abide by regulations. We here con-centrate on the issue of innovation, i.e. we take initial conditions such that a large majority of agents are using the old technique and only a small minority starts using the new one.
The European Union is presently proposing financial help to farmers who agree to modify their agricultural practices towards environmen-tally friendly practices such as input (fertilisers and pesticides) reduction, biological farming, set-asides, etc. (refer to the Agenda 2000 web site). In practice, at some local level, farmers have to decide whether to accept a contract (to be further called an AEM) implying some financial help in exchange for the adoption of well-defined agricul-tural practices in their farm. Such a reorientation of the Common Agricultural Policy from subsi-dies for production towards subsisubsi-dies for environ-mentally friendly practices involves a lot of changes, equivalent in amplitude to those induced by the technical revolution (mechanisation and use of chemical fertilisers) for farming in the beginning of this century or the green revolution (use of chemical and new cultivars) in the less developed countries. We might expect uncertain-ties to be very important for farmers (Lazzari, 1998), and that the present process will develop in time: hence the idea to use a dynamical approach similar to the one used in the study of technolog-ical change.
In fact, most modeling of innovation diffusion is presently based on the ideas that:
a new innovation is always beneficial;
the rate of adoption of the innovation is
The standard metaphor is then epidemiology, and innovation diffusion is treated as the propa-gation of an epidemics through a susceptible pop-ulation: individual ‘infection’ events are thus proportional to a frequency of encounters be-tween infected and non-infected individuals. In the case of random encounters across the whole population, these hypotheses lead to a logistic equation and the well-known S curve for adop-tion dynamics. We will here depart from the standard metaphor.
A first feature, different from the hypothesis of
random encounter across the whole popula-tion, is to suppose the existence of a social network: exchanges of information pertinent to the choice only occurs among individuals di-rectly connected through a social network (we call them neighbours) (Degenne and Forse´, 1994; White website).
A second feature is the inhomogeneity of
agents. We take into account the fact that the innovation might not be equally profitable for all agents and that they care differently about the different aspects of the innovation:
• Some agents might be in a position such that the innovation is clearly beneficial according to their own criteria and they should adopt it as soon as they hear about it;
• for others the extreme opposite is true: what-ever other agents are doing, they should not adopt;
• the less determined agents rely on the choice made by their connected neighbours. We will be interested in the situation where very few agents are initial adopters and when social factors dominate the dynamics of adoption. Farmers’ choices are based on their evaluation of the advantages of taking environmental premiums in exchange for environment friendly practices, plus imitation terms, taking into account the in-formation that they get from neighbours who have already made their own choice. More specifi-cally, for each choice, adopt or not adopt, farmers compute a utility function taking into account economic factors, considerations about time schedule, pleasure, state of the environment, psy-chological factors such as fame or good relations with neighbourhood, etc. Let us consider two models for imitation through neighborhood.
2.1. The percolation model
In a very simple model (Solomon et al., 2000) of innovation diffusion a farmer adopts whenever:
at least one neighbour has adopted;
The utility of adopting for this farmer is larger
than the utility of non-adopting.
The notion of a neighbourhood here refers to social neighbours as defined by a social network: a direct link should exist between farmers to be neighbours. One interpretation of the first condi-tion is that awareness about the innovacondi-tion is triggered by at least one adopting neighbour. The second condition a priori divides the set of poten-tial adopters into those who will never adopt, and those that are susceptible to adopt provided that one of their neighbors adopts. If a small number of individuals initially adopts, the fraction of ac-tual adopters increases in time following the prop-agation of influence along the social network reduced to potential adopters. If this reduced net-work is random, the phenomenon of percolation (Stauffer and Aharony, 1994) dominates the dy-namics: if the fraction of potential adopters is larger than the percolation threshold (e.g. 0.59 on a square lattice with nearest neighbors, 0.40 on a square lattice with next nearest neighbours, 1/kon a random net with connectivityk), the fraction of adopters approaches one as time increases. In the opposite case, this fraction remains close to zero. The transition between the two dynamical be-haviours is a very abrupt function of the fraction of potential adopters. It has been well studied in percolation theory. Close to the transition, the fraction of actual adopters has large fluctuations as a function of the actual distribution of adopters in the networks: the same total fraction of potential adopters might result in adoption fractions varying between zero and one. The above analysis applies to any network, regular or random, with or without loops. What might change between nets of different kinds is the percolation threshold.
2.2. Networks of threshold automata
some farmers may adopt only when several neigh-bours have already adopted. A possible interpre-tation is ‘voting’: farmers i add up their neighbours opinions to take decisions. Perceived utilitiesUo
i for each option o, adopt or don’t, are
then computed as the sum of:
a random term uio fixed a priori at the
begin-ning of the simulation which represents the a priori utility of the option to farmer i;
plus an imitation term depending upon the
choice made by their neighbours.
Ui o
=ui 0
+%
j
Jj (1)
where the sum is extended to all neighboursjwho chose option o ; Jj is the weight of neighbour’s j
opinion. Farmers’ decision is: adopt if the per-ceived utility of the AEM is larger than its non-adoption. Technically speaking, both models are networks of threshold automata (Vichniac, 1986; Weisbuch, 1990; Galam, 1997).
2.2.1. Simulations
Starting at a weak density of initial adopters, simulations show the evolution of the fraction of adopters in time. Their output are spatio-tempo-ral patterns, which sometimes remain localised to a small set of early adopters, or eventually grow to fill a large part of the network (visualization of the spatio-temporal patterns is easy for a 2D grid, but similar results are also checked on random nets by measuring adoption rate in time). The typical question that we want to answer is:
What is the final fraction of adopters in the farmers’ population for a given distribution of a priori utilities and a given connection network with influence weights?
2.2.2. Main results
The general answer to the above question is that for a wide range of distributions and connec-tion structures, global informaconnec-tion is not sufficient to predict adoption. Most often local information is necessary. Under a large set of social network topologies and hypotheses on the distribution of farmers’ characteristics, premium uptake depends upon local characteristics of farmers and their network. For the same average characteristics
up-take rates can be either 0 or 100%. This herding behavior is typical of imitation processes, and we observed it even in the case of agents with a large distribution of characteristics, provided that the width of the distribution is smaller than the social interaction terms. Choice is often uniform, but hardly predictable, unless one has local informa-tion on the repartiinforma-tion of agent characteristics. This outcome is well understood: adoption pat-terns are able to grow and fill most of the social network only when some initial adopters are grouped as well-characterized seed configurations; when this is not the case, e.g. when they are isolated, no further adoption proceeds. (See Weis-buch and Boudjema (1999) for a thorough analysis).
The equivalent phenomenon is well known in the physics of phase transitions: a nucleation pro-cess is nepro-cessary for a phase transition to occur.
These results are very different from those ex-pected when one only takes into account a priori utilities, which would be a model of full rational-ity. In such a case one easily predicts the adoption of all farmers with a positive difference in priori utilities. To summarise:
full rationality yields exact prediction of the
fraction of adopters; this fraction can take any value between 0 and 1 according to the distri-bution of a priori utilities of farmers.
By contrast, bounded rationality yields
difficulty of prediction and herd behaviour, i.e. adoption fraction often take values very close to either 0 or 1.
3. Pollution
con-ditions economic agents would agree to pay the extra cost of devices, such as catalytic converters, that prevent polluting the environment, Thus, once more we discuss adoption under social influ-ence, but also take into account the influence of the state of the environment on the decision pro-cess. In that respect the model implements the complete loop of interactions described in Fig. 1, which was not the case of the previous section where the state of the environment did not explic-itly modify the agents’ views.
A simple example that we use throughout the discussion is that of two brands of otherwise equivalent equipment, except for the fact that one brand is polluting and the other one is not. When pollution costs are not taken into account, the a priori utility of the nonpolluting equipment is lower than that of the polluting equipment be-cause of the cost of the depolluting device. If the agents were fully rational (i.e. if they were fully informed) and cooperative (no cheaters), they would agree to pay for the converter a price up to the cost of pollution generated by each polluting equipment. We proposed a model based on bounded rationality which shows that agents only agree to pay a fraction of the cost of pollution. In this model, derived from Arthur and Lane (1993), agents compute the utilities of both brands ac-cording to their a priori expectations and the opinion of their neighbors about the brand they have chosen, their risk aversion, and the cost of local pollution. The model supposes no govern-ment intervention, except perhaps a tax on pollut-ing equipment, and that the agents have no global view of the real cost of pollution associated with each brand. They simply experience the decrease in utility of the brands due to present local pollu-tion. Due to the locality of information exchange and the diffusion of pollution, agent opinions depend on time and space. The model takes into account several coupled dynamics: those of pollu-tion, of agent internal representations (corre-sponding to beliefs in Fig. 1) and of their choices. We are ultimately interested in the time evolution of the market shares of polluting and non-pollut-ing equipment, and how it depends on the parameters governing the economic variables and especially the dynamics of the internal representa-tion of the agents.
3.1. The model
3.1.1. Computation of the utilities
The agents choose equipment according to their ‘internal representation’ of the characteristics of the products. These internal representations are probability distributions of the utility of each product that are computed according to the fol-lowing procedure.
Agents access some public information about
the performance of each brand i, represented by a normal prior probability distribution, with mean ui and standard deviation si.
They take advice from n other purchasers (in
the reported simulations these are the eight closest neighbours on a square grid), among which ni bought brand i. Only those ni
pur-chasers who bought brand i contribute to the information about brand i by sending a mea-sure of its utility:
Xi=m0(i)−P+o
wherem0(i) is the average utility of brandiin the absence of pollution. Since the sampled pur-chasers already possess the brand, their opinion about the brand includes the negative effects of pollution. We suppose here that they don’t know a priori how much extra pollution is associated with the polluting equipment: the decrease in the experienced utility is then proportional to local pollution, irrespective of which brand they have purchased themselves. Utility is then decreased by the presence of pollution P expressed in the con-venient cost units, o, representing measurement error, is a normally distributed random variable with mean 0 and standard deviation sob.
The agents process this information to obtain a posterior distribution of performances. This pro-cessing is done by taking the convolution prod-ucts of Gaussian integrals corresponding to the prior and to the information obtained from other purchasers. The average expected posterior utility
where index j refers to the pooled agent. The mean utilities are averaged with a weighting factor that is inversely proportional to the variance of the distribution:
The Bayesian learning processed is thus reduced to the simple iteration of the two above equations. Economic agents are adverse to risk. The greater the uncertainty in the value of a product, the less they are likely to buy it. To take into account risk aversion of the agents, we use a classical mean variance utility function: one more term, proportional to the variance of the posterior distribution, is added to mpost,i to compute the
effective utility function Uiused by the agents to choose their equipment:
wherel is the risk aversion parameter and s2 post,i
is updated by narrowing the variance according to the number of sampled purchasers. The complete expression for Uiis then:
Ui=
Upon computing Ui for each product,
pur-chasers choose the brand with the highest ex-pected utility.
3.1.2. Pollution dynamics
The dynamics of the agent representations and choices interacts with the diffusion dynamics of emitted pollution. Agents occupy the cells of a two-dimensional grid that represent space. Pollut-ing equipment generate pollution at a constant rate s. This pollution diffuses in space according to Fick’s law, and part of it simply disappears locally (through decomposition, for instance). Pollution, P(r,t) inrat timet, obeys the following partial differential equation:
dP(r,t)
dt =DDP(r,t)−dP(r,t)+s
where D is the diffusion constant, DP the lapla-cian ofP,d the decay term.s, the source term, is
only present when the occupant of the cell bought polluting equipment. The s term strongly couples the dynamics of pollution to that of the agents’ choices. The range of possible pollution levels corresponds to fixed configuration of choices. Pol-lution is zero when all agents always bought non-polluting equipment and maximum and equal tos/d when they all have always bought polluting equipment. s/d, the maximum pollution, reflects the cost of pollution, and is the natural scale on which to compare differences in the prior utilities of the agents. However, since the agents only use local information, the gradient of pollution times the range of polling is the relevant parameter to compare differences in prior utilities as we checked in computer simulations.
Technically the model is then based on coupled map lattices: the coupling terms are due to infor-mation exchange between neighbouring sites and to pollution. A more detailed exposition of the model is available in Weisbuch et al. (1996). One interesting feature of the model is that one can vary the influence of past information memorized by the agent with respect to information ex-changed with neighbours.
3.2. Simulations
In a typical simulation, one starts from non-ho-mogeneous distribution of agent choices and typi-cally follows the time distribution of market shares and the spatial pattern of agent choices. The most influential parameter with respect to which attractor is reached is the ratio of difference in prior utilities of brands to pollution cost (s/d).
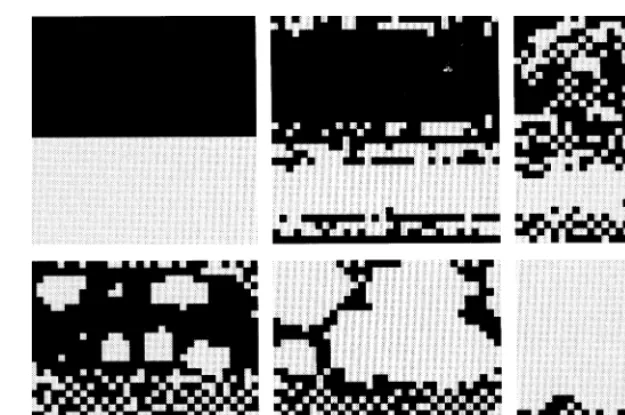
When this ratio is low, the system evolves
towards total domination of the nonpolluting equipment with a market share of one (Fig. 2);
When it is high, the system evolves towards a
partial domination of the polluting equipment with a market share varying from 75% to one with a specific spatial pattern (Fig. 3).
Fig. 2. Evolution towards market domination by non-polluting equipment in the case of an intermediate difference in prior utilities: the six patterns represent the spatial distribution of choices (black squares are polluters, light grey squares non-polluters) at times
t=0,t=6,t=10 from left to right for the upper patterns and at timest=13,t=15,t=36 from left to right for the lower patterns. Note the apparition and growth of islets of non-polluters from the polluted region at times 13 and 15. The system evolves towards complete domination of the market by non-polluters att=100 (not represented in this figure).
Fig. 3. Slow evolution towards a coexistence distribution among polluting and non-polluting equipment in the case of a large difference in prior utilities. The three patterns represent the spatial distribution of equipment choices at timest=0,t=32 and
t=1100, from left to right.
3.3. Main results
The model shows that agents with imperfect knowledge are able to switch to more expensive non-polluting equipment by comparing informa-tion about polluinforma-tion costs obtained from neighbor-ing agents. When information samplneighbor-ing is local, the maximum accepted extra cost for the non-pol-luting equipment scales as the gradient of the pollution cost times the range of polling; it is then less than the cost of pollution. A surprising result
4. Conclusions
4.1. Emergence of institutions and regime transi -tions
The simple models that we proposed exemplify the use of complex system dynamics in describ-ing the dynamical emergence of institutions such as beliefs and routines. The behaviours that we interpreted as institutions are well-characterised, and they often involve the domination of one choice, adopt or not, don’t pollute (but not the opposite in the example that we discussed). In certain cases, e.g. for the AEM adoption, initial conditions determine the outcome of the dynami-cal process.
These complex systems exhibit a characteristic behaviour called resilience. When a parameter of the system is varied one observes a stepwise sponse: little change as long as the system re-mains in the same dynamical regime, but big changes when the parameter moves across a transition. This response is characteristic of sys-tems made of non-linear elements interacting via entangled loops, which is the case of our models and of most environmental systems. In other words, socio-environmental transitions, for in-stance, changing from the domination of one behaviour to some different pattern of be-haviour, are most often abrupt:
they involve large changes in market shares or
adopters’ fraction;
and they occur for an infinitesimal change in
parameters.
As we stressed, the behaviours that are selected through the dynamical processes are quite differ-ent from the predictions of unbounded rationality approach. In the approach described here, agents have no strategic thinking. Still they react to the choices of those they are connected with and bear the consequences of their decisions in the case of the pollution model. We are not using here any concept or hypothesis from game theory. For instance, an important assumption of standard game theory, constant pay-off matrix, is not nec-essary in our approach. The constant pay-off matrix would not allow taking into account the lower arrows of the loop in Fig. 1, namely, the
fact that actions of the agents gradually change the environment and that these changes modify agents’ views.
4.2. Where do we stand with respect to
comparison with empirical data and with respect to normati6e approaches?
It should be clear at this stage that we do not pretend to reach the same kind of precision as in accounting or in ecological modeling based on system analysis (refer, for instance, to the UFIS/
ECOBAS ftp-fileserver for ecological models). The reason is obvious: to get any precision in prediction one needs to specify relevant parame-ters. This knowledge might be available for mod-els dealing with physico-chemical and possibly biological variables, but cognitive and social parameters are much more difficult to assess. In the case of the adoption model e.g., this would mean knowledge of the a priori utilities (a knowledge most often unknown to farmers them-selves, which is precisely why they have to resort to imitation) and the social influence network. These data are very difficult to assess.
On the other hand, the dynamical properties that we report, i.e. well-characterised dynamical regimes separated by sharp transitions, are ro-bust with respect to the model specifications: they remain the same for a wide range of parameters and for important changes in the model, e.g. for regular lattices as for random networks. This is an indication of the range of validity of the models: since some properties, that we call generic, are observed for a large ensemble of models with different complexity and realism, we might expect these properties to remain true for real systems that are much more complicated than the toy models that we de-scribed here.
agri-environmental contracts in Northern Italy, one observed a very different uptake of AEM during the first round: basically most farmers in Lombardia adopted while those in Piemonte, a similar and neighboring province, did not. This contrasted behaviour in similar regions fits with herding behaviour and the sensitivity to the repar-tition of early adopters that we mentioned in Section 2.
Furthermore, the insight that we gain about which factors are important in the adoption of new techniques can be used by agencies trying to promote these techniques. We have shown, for instance, that when uncertainty about the new technique, and thus social factors are important, more concentrated effort should be made to pro-mote the new technology during the early stages than if individuals were fully rational (a more detailed discussion of other possible strategies can be found in Weisbuch and Boudjema, 1999).
On the opposite, observing the same generic properties for one model and some real system does not prove the model or validate its detailed assumptions. In the case of Lombardia and Piemonte above mentioned, other explanations were proposed, such as the fact that propaganda for the AEM was conducted differently in the two provinces. This alternative explanation is not even contradictory with ours: a minor change in the repartition of early adopters due to the nature of propaganda could have been enough to ensure success in Lombardia.
The real challenge is to test a series of models and to classify them according to the generic properties that they share with real systems. This challenge is not the standard challenge in science, at least according to the Popper’s falsifiability test, but it is more relevant to environmental challenges faced by societies:
What policies would bring robust results in
view of the inherent uncertainties about envi-ronmental issues?
How to implement these policies across
popu-lations that are inherently inhomogeneous in terms of interests and cultural values, not to mention their limited obedience.
4.3. Prospecti6e concerning other types of
institutions
We have here illustrated the notion of dynami-cal emergence of institutions in relation to envi-ronment for the case of beliefs — what is best? — and social norms of behaviour-polluting or not, adopting or not (although sociologists might dispute using the term ‘norm’ since our agents are not consciously following the norm). We might also consider that the subsets of agents with the same beliefs and behaviours constitute emergent social structures since the behaviours are re-enforced through social interactions.
Property rights could also be described as emer-gent institutions according to evolution of power gained by certain groups, interest for the future and cooperation inside the group and properties of the environment such as sensitivity to human exploitation. The same approach could also lead to understanding the emergence of environmental agencies as intermediaries between users and the environment.
To take a more general perspective, we have tried to show how complex system dynamics of-fers a handle on how to deal with the intricate dynamics of cognition, social factors and environ-ment. The bad news for the modeler is the com-plexity of the task and the limitation of the kind of predictions that can be made, as we stressed above. On the other hand, since agents change their views and preferences according to the state of the environment, some hope for future im-provement in the real world might be envisioned. Our civilisation is not doomed to a chaos of pollution and resource exhaustion: this is good news for us as citizens.
Acknowledgements
this study was been carried out with partial finan-cial support from the Commission of the Eu-ropean Communities, Agriculture and Fisheries (FAIR) Specific RTD programme, CT96-2092, ‘Improving Agri-Environmental Policies: A Simu-lation Approach to the Role of the Cognitive Properties of Farmers and Institutions’. It does not necessarily reflect its views and in no way anticipates the Commission’s future policy in this area.
References
Agenda 2000, http://europa.eu.int/cornm/dg06/envir/
programs/index-en.htm.
Arthur, B.W., Lane, D.A., 1993. Information contagion. Struct. Changes Econ. Dynamics 4, 81 – 104.
Degenne, A., Forse´, M., 1994. Les Re´seaux Sociaux. Armand Colin, Paris.
Fo¨llmer, H., 1974. Random economies with many interacting agents. J. Math. Econ. 1/1, 51 – 62.
Galam, S., 1997. Rational group decision making: a random field Ising model atT=O. Physica A 238, 66 – 80. Ha¨gerstrand, T., 1965. A Monte Carlo approach to diffusion.
Eur. J. Sociol. 63, 43 – 67.
Hardin, G., 1968. The tragedy of the commons. Science 162, 1243 – 1247.
Kirman, A.P., 1993. Ants, rationality and recruitment. Quart. J. Econ. 108, 137 – 156.
Latane´, B. Nowak, A., 1997. Self-organizing social systems: necessary and sufficient conditions for the emergence of clustering, consolidation and continuing diversity. In:
Bar-nett, G. A., Boster, F.J. (Eds.), Progress in Communica-tion Sciences.
Lazzari, M., 1998. Private discussions based on the following bibliography: Poinelli M., 1993. Valutazione della conve-nienza economica delle misure agroambientali introdotte con la riforma PAC. Genio Rurale, n.7/8, 19 – 22, Bologna, Italy and Giardini L., Canterle A., Borin-M., Berti A., 1997. Confronto tra sistemi colturali a scala aziendale nota I: valutazioni agronomiche ed economiche. Rivista di Agronomia, 31 (3), 521 – 530, Bologna, Italy.
North, D., 1990. Institutions, Institutional Change and Eco-nomic Performance. Cambridge University Press, Cambridge.
Orle´an, A., 1995. Bayesian interactions and collective dynam-ics of opinions: herd behavior and mimetic contagion. J. Econ. Behav. Organ. 28, 257 – 274.
Solomon S., Weisbuch G., de Arcangelis L., Jan N., Stauffer D., 2000. Social percolation models, Physica A 277, 239 – 247.
Stauffer D., Aharony A., 1994. Introduction to Percolation Theory, Taylor and Francis, London. UFIS/ECOBAS ftp-fileserver for ecological models: http://www.gsfde/UFIS/
ufis/index.ht.
Vichniac, G., 1986. Cellular automata models of disorder and organization. In: Bienenstock, E., Fogelman-Soulie´, F., Weisbuch, G. (Eds.), Disordered Systems and Biological Organization. Springer Verlag, Berlin.
Weisbuch, G., 1990. Complex Systems Dynamics. Addison Wesley, Redwood City, CA.
Weisbuch, G., Gutowitz, H., Duchateau-Nguyen, G., 1996. Information Contagion and the economics of pollution. J. Econ. Behav. Organ. 29, 389 – 407.
Weisbuch, G., Boudjema, G., 1999. Dynamical aspects in the adoption of agri-environmental measures. Adv. Complex Systems 2, 11 – 36.
White D.R. http://eclectic.ss.uci.edu/-drwhite/guide.html