OPTIMAL IMAGE STITCHING FOR CONCRETE BRIDGE BOTTOM SURFACES
AIDED BY 3D STRUCTURE LINES
Yahui Liu, Jian Yao∗, Kang Liu, Xiaohu Lu, Menghan Xia
School of Remote Sensing and Information Engineering, Wuhan University, Wuhan, Hubei, P.R. China [email protected] http://cvrs.whu.edu.cn/
Commission III, WG III/3
KEY WORDS:Image Stitching, 3D Structure Line, Concrete Bridge Inspection
ABSTRACT:
Crack detection for bridge bottom surfaces via remote sensing techniques is undergoing a revolution in the last few years. For such applications, a large amount of images, acquired with high-resolution industrial cameras close to the bottom surfaces with some mobile platform, are required to be stitched into a wide-view single composite image. The conventional idea of stitching a panorama with the affine model or the homographic model always suffers a series of serious problems due to poor texture and out-of-focus blurring introduced by depth of field. In this paper, we present a novel method to seamlessly stitch these images aided by 3D structure lines of bridge bottom surfaces, which are extracted from 3D camera data. First, we propose to initially align each image in geometry based on its rough position and orientation acquired with both a laser range finder (LRF) and a high-precision incremental encoder, and these images are divided into several groups with the rough position and orientation data. Secondly, the 3D structure lines of bridge bottom surfaces are extracted from the 3D cloud points acquired with 3D cameras, which impose additional strong constraints on geometrical alignment of structure lines in adjacent images to perform a position and orientation optimization in each group to increase the local consistency. Thirdly, a homographic refinement between groups is applied to increase the global consistency. Finally, we apply a multi-band blending algorithm to generate a large-view single composite image as seamlessly as possible, which greatly eliminates both the luminance differences and the color deviations between images and further conceals image parallax. Experimental results on a set of representative images acquired from real bridge bottom surfaces illustrate the superiority of our proposed approaches.
1. INTRODUCTION
1.1 Intended Applications
Concrete is the most widely used man-made material for con-structed systems. Cracks are the main disease appearing on the structured concrete surfaces. In particular, for inspecting such this disease, the concrete crack detection is always required to accurately obtain the crack characteristics, including localization and quantification information. To completely and efficiently detect concrete cracks, it is needed to generate a wide-view panorama with good image quality from a large set of high-resolution images acquired from concrete surfaces. In the en-gineering practice, the bridge bottom surfaces are suspended in midair with repetitive structures, poor texture, dim light, per-spective distortion, and out-of-focus blurring introduced by depth of field, which make the image data collection and processing extremely challenging. In the past decades, some attempts have been carried out to automate the crack detection procedure (Oh et al., 2009, Wang et al., 2010, Nejad and Zakeri, 2011, Prasanna et al., 2014, Zhang et al., 2014), but, as far as we know, only few studies of image stitching for concrete bottom surfaces were done.
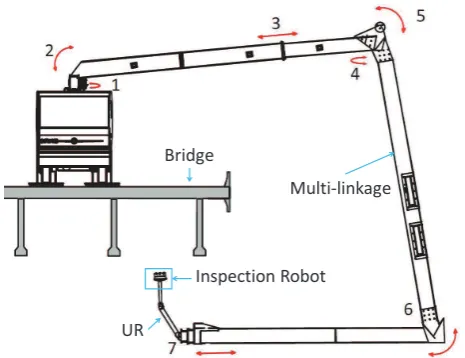
We have developed a bridge inspection system which is com-posed by a specially designed truck with a huge and flexible mechanical arm and a machine vision robot system with various sensors as shown in Figure 1. The intended use case can be summarized as follows. The operator first pulls over to the side of the bridge to be observed and the multi-linkage arm system dispatches the inspection robot beneath the bridge. Next, the laser range finder (LRF) starts to scan the local bridge section via the
∗Corresponding author
Bridge
Multi-linkage
Inspection Robot
UR
Figure 1: Overview of the total mechanism for our developed bridge inspection system. The arcs with double arrows mean rotation operation and the lines with double arrows mean elongation and shortening of each joint of the multi-linkage arm.
1.2 Challenges
The most important challenges for solving the above mentioned problems using images from the inspection robot can be summa-rized as follows:
Poor texture: It always presents poor texture on the smooth concrete surfaces. In addition to the stains, spots and cracks, there are only a very few prominent features on the surfaces making the feature matching difficult for image stitching.
Perspective distortion and out-of-focus blurring: While ac-quiring images in a short distance about 1-2mwhich is similar with the undulations of the bottom surfaces so that the assumption of a lens-focusing planar surface of the observed objects is no longer true. The undulations can cause severe perspective distortion and out-of-focus blurring in high-resolution images captured by a 85mm lens, which make corresponding points matching very difficulty. In some extreme cases, the matching between overlapping images needs the aid of depth information acquired from the 3D cameras.
Non-orthograph: The industrial camera sensors of the inspec-tion robot are not perpendicularly mounted to the surfaces in order to effectively increase the coverage area. Thus, a perfect ortho-view of the images cannot be provided, which increases the difficulty to stitch all the images of the bridge bottom surfaces to a wide-view single composite ortho-view image.
Rough position and orientation:Due to the restrictions of both loading capacity and working conditions, the common position and orientation technologies, such as GPS and IMU, are not competent. The LRF and HPIE sensors are combined to provide rough position and orientation information. What’s more, due to the dynamic instability of the inspection robot platform itself, the errors in orientation will be further amplified, which increases the complexity and difficulty of image stitching.
1.3 Related Works
A lot of image stitching approaches have been developed in recent years for different applications. A fast image stitching and editing approach for panorama painting are proposed in (Xiong and Pulli, 2010). The 3D object reconstruction from multiple-station panorama imagery was developed in (Luhmann and Teck-lenburg, 2004, Santagati et al., 2013). An as-projective-as-possible warping method and a novel moving direct linear trans-formation (Moving DLT) technique are developed to seamlessly stitch image regions that are inconsistent with the projective model (Zaragoza et al., 2014). The above methods can be applied to several images well but not effective for a large amount of images. The image stitching method (Jia and Tang, 2008) uses structure deformation which depends on the 2D features detected in the images. However, when there are only few or no 2D features, the optimization procedures are likely to fail. Georeferencing transformation to optimize stitching for images acquired by Unmanned Aerial Vehicles (UAVs) had been implemented in (Liu et al., 2011, Yahyanejad et al., 2010). In such methods, the tests were conducted in urban areas so that the corresponding images would not encounter texture and light problems. The method (Michaelsen, 2011) deals with the applications such as underwater monitoring a platform with a camera moving close to a large roughly planar scene, but the results of the method show great affine deformation.
In this paper, we have proposed a novel approach for image stitching derived from the concrete bottom surfaces. The new approach is based on the assumption that the rough position and
orientation for each image have been obtained by the inspec-tion robot. Normally, the overlap between neighboring images is enough large, in general, in more 50%. But some other issues, such as displacement and rotation between neighboring images, as well as the scale factor, need to be solved with at least four corresponding points. In our method, all images are initially aligned and divided into several groups with the rough position and orientation data. Then, the 3D structure lines existed in bridge bottom surfaces are extracted from the 3D cloud points acquired with 3D cameras, which are combined with the corresponding points between images to perform a position and orientation optimization in each group to increase the local consistency. Next, a homographic refinement between groups is further applied to increase the global consistency and generate a global panorama. Finally, we apply a multi-band blending algorithm to generate a large-view single composite image as seamlessly as possible with the open source softwareEnblend∗, which greatly eliminates both the luminance differences and the color deviations between images and further conceals image parallax.
2. OUR METHOD
2.1 Geometrical Alignment Optimization
The major goal of image stitching is to generate a perfect panora-ma of the wide-view observed area from multiple ipanora-mages. In our application, the images are collected from the bridge bottom surfaces along a general scanning direction with the motion of the trunk, which is repeated in the back-and-forth motion in different camera acquisition areas with different places and orientations of the inspection robot until all of the bottom surfaces are covered. As for hundreds of images{Ii}of one scanning in sequence, a wide-view panorama can be perfectly constructed with our specially designed method.
We first review the estimation of projective transformations:
sx=K[R t]X, (1)
where s is an arbitrary scale factor, and x = [x, y,1]⊤ and
X= [X, Y, Z,1]⊤denote a 2D point in the 2-D image plane and its corresponding 3D point on the object surface, respectively.K
is a3×3intrinsic matrix,(R,t), called the extrinsic parameters, is comprised of the 3 ×3 rotation matrix R and the 3×1 translation vectort, which relate the world coordinate system (i.e., the bridge 3D model) to the camera one. The intrinsic matrixKcan be easily calibrated by the Zhang’s flexible camera calibration method (Zhang, 2000). The extrinsic parameters, i.e.,(R,t), are derived from the rough position and orientation obtained by combining LRF and HPIE.
2.1.1 Alignment With the intrinsic and extrinsic parameters, a 2D image point x can be back-projected to the 3D bridge bottom surface model at its corresponding 3D point X based on the principle that the camera optical center C, x and X
are collinear in 3D space as shown in Figure 2. As the above mentioned, the 3D model of the local bridge bottom is obtained by the LRF sensor. All of the camera positions and the 3D bridge surface model are unified into a same world coordinate system, and then the intersection between the 3D back-projection line and the bridge bottom surface can be obtained along the vector derived from(x,C), which can be represented as follows:
X=f(x,B,K, ϑϑϑ), x∈I, (2)
۱
Bridge Bottom Surface
܆
ܠ Image
Figure 2: A back-projection illustration with the collinear principle of the camera optical centerC, a 2D image pointxand its corresponding 3D pointX: the 3D structure and the profile map (Bottom-Right) of the bottom surface of a bridge whose structure named “small box girder”.
܆
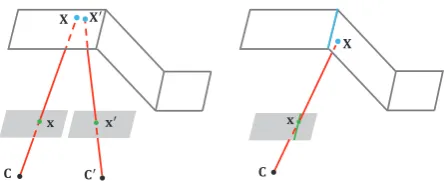
Figure 3: Examples of back-projection processes of the image corresponding feature points (Left) and the structure line (Right). The first optimization goal is to minimize the differences between the corresponding pointsXandX′for the former and the second one is to minimize the distances between the blue 3D structure line and the points likexlocated in the green 2D structure line in the image for the later.
wheref(·)denotes the back-projection function with a 2D image pointxin an imageI, the bridge bottom surface modelB, and the intrinsic matrixKand the rough extrinsic parameters represented
ϑϑϑ = {tx, ty, tz, θx, θy, θz}consisting of three translations and three rotation angles. Due to that B and K are the same for all the images, the functionf(x,B,K, ϑϑϑ)will be expressed by
f(x, ϑϑϑ)for simplicity in this paper. Ifϑϑϑis accurate, the perfect panorama can be easily conducted by the back-projection method described in Eq. (2). We propose a perception criterion function to estimate the accuracy of extrinsic parameters ofnimages, i.e., ΘΘΘ ={ϑϑϑi}n wherex↔x′denotes a pair of corresponding points from two overlapping images as shown in Figure 3, which will be described in Section 2.1.2.
2.1.2 Point Matching It has been widely known that the matching accuracy of corresponding points normally affects the quality of image stitching due to severe image parallax. Here the found 2D corresponding points between two adjacent im-ages with overlapping regions will be utilized to estimate the homographic model between these two images. According to the homographic model, not only the position and orientation of the images can be optimized, but also the alignments can be improved. For our specific application, we design an efficient ap-proach to find enough corresponding points for image matching, which is described as follows.
For efficiency and robustness, the original images are scaled to a more reasonable size for SIFT (Rublee et al., 2011) extracting and matching corresponding points between images with overlapping regions. By the aid of rough positions and orientations of acquired images based on LRF and HPIE sensors, the adjacent relationships between images are easily found. A proper zooming scale is important to ensure accuracy and speed up the feature ex-tracting and matching process. In our application, the originally acquired images with the size of5120×3840pixels will be down-sampled with a scale factor 1/16. Then, we apply a correlation coefficient criteria to match the extracted feature points between images. Given the feature pointspand p′ from two adjacent imagesIandI′, respectively, the matching evaluation criteria is formulated as:
p′ are most likely to be corresponding image points. A fixed thresholdτis set forρto avoid to trap into a non-optimal “local maximum”, for example,τ= 0.8used in this paper.
After a set of matched corresponding image points, the homog-raphy matrixHcan be easily recovered by RANSAC (Fischler and Bolles, 1981). Next, a corner detection method (Shi and Tomasi, 1994) is applied to obtain sufficient quantity of feature points from images. After that, the homography matrixHis used to guide finding the corresponding feature points from adjacent aligned images based on an accurate searching constraint. To improve the robustness of the position and orientation optimiza-tion, we need to find a large set of reliable corresponding feature points. Although the Shi’s method (Shi and Tomasi, 1994) can easily detect enough corners, it may result in a very non-even distribution for our application due to poor texture, which makes the optimization unstable. As we know there are usually some bevel structures of the bridge bottom, and the profile seams to be straight along the intersection line between the bevel level structures. This prior knowledge can be effectively utilized to enhance the optimization by considering to match the structure lines in 2D images to those of the 3D bridge model. In this case, the optimization function is modified as follows:
ˆ point on one of the extracted structure lines Li from Ii, and l(p, ϑϑϑi)denotes the corresponding point of the sampledp, which is obtained by perpendicularly projectingpto the 3D structure lines in the 3D model B as shown in Figure 3. The optimal solution:
can be achieved by minimizing the error function in Eq. (5) using the Levenberg-Marquardt (L-M) algorithm (Mor´e, 1978).
2.2 Structure Line Extraction
Figure 4: An example of dim structure line in a 2D image (Left), but obvious enough in the corresponding 3D cloud points (Right) collected by the 3D camera.
Line Laser
Image Plane Optical Center ܱ௪ ܻ௪
ܼ௪ ܺ௪
Object
Light Plane
ᇱ
ݔᇱ
ݔᇱ
ݔ
ݕ ݖ
ଵ ݔଵ
ݕଵ ݖଵ
ݔଵᇱ ଵᇱ
ݕଵᇱ
3D Camera
CCD Camera Image Plane
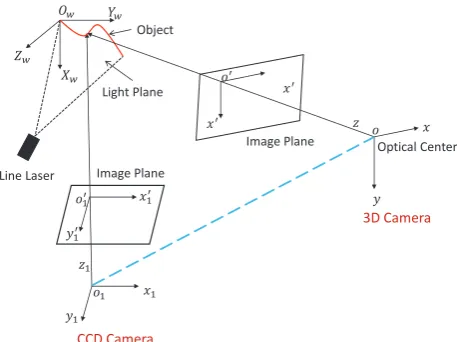
Figure 5: The relationships between the coordinate systems of the CCD image and 3D data, which include two image coordinate systems (o′−x′y′ando′1−x′1y′1), two image space coordinate
systems (o− xyzando1 − x1y1z1), and one object space
coordinate system (Ow−XwYwZw).
introduced by the bevel structures. In general, it seams that there is a bigger intensity gradient in these regions in some images, but not all. In other words, it is not significant and robust enough to extract these lines by intensity characteristics and alway suffers from uncertainty. What’s more, the geometrical alignment may be worse with such these inaccurate structure lines. Figure 4 shows an example of the dim structure line and the corresponding 3D cloud points where the structure line is obviously observed in 3D data but difficulty found in the 2D image.
2.2.1 Calibrations: In our system, the 3D cameras and the industrial CCD cameras are mounted on a stable inspection robot platform and they constitute a rigid-body structure. The 3D point clouds and 2D images captured by these two kinds of sensors are collected synchronously. As shown in Figure 5, the near infra-red (NIR) line laser casts the light on the object surface, and then the 3D cameras and the industrial cameras collect data synchronously. It relates to five coordinated systems in this data acquisition process: two image coordinate systems (o′
−x′y′ ando′1−x′1y′1), two image space coordinate systems (o−xyz
and o1 − x1y1z1), and one object space coordinate system
(Ow −XwYwZw). We calibrate the 3D camera via a square chessboard which can recover the camera intrinsic matrix and the relative relation (consisting of a rotation matrix and a translation vector) with respective to the object space coordinate system. In this way, the data can be effectively fused if the relative relation between two cameras has been calibrated. This relative relation, consisting of a3×3rotation matrixR1and a3×1translation
vectort1, betweeno−xyzandOw−XwYwZwis formulated
as:
Xo=R1XOw+t1, (7) where Xo and XOw denote 3D coordinates in the coordinate system o−xyzandOw −XwYwZw, respectively. After the calibration between the 3D camera and the CCD camera, the relative relation, consisting of a3×3rotation matrixR2 and
a3×1translation vectort2, betweeno−xyzando1−x1y1z1
is formulated as:
Xo1=R2Xo+t2, (8)
whereXo1denotes 3D coordinates in the coordinate systemo1−
x1y1z1. So, the relative relation betweenOw−XwYwZwand
o1−x1y1z1is formulated as:
Xo1 =R2(R1XOw+t1) +t2. (9) Then, the coordinates in the image space coordinate systemo1−
x1y1z1 can be projected to the image plane coordinate system
o′
1−x′1y′1with the criterion as:
[u, v,1]⊤=KXo1/X(3)o1, (10)
where[u, v]⊤denotes image coordinates in the coordinate system (o′
1−x′1y1′) in pixels,Kis the intrinsic matrix of the CCD camera,
andX(3)o1 is the third value of the vectorXo1.
The position and orientation information provided by the LRF sensor is also calibrated via a special method (Kurnianggoro et al., 2014). With the calibrated LRF, the local bridge section is scanned and the corresponding 3D model is derived from the scanning data. Then, the 3D model and the localization data are applied to the image geometrical alignment described in Section 2.1 as the initial values.
2.2.2 3D Structure Line Extraction: According to the cali-bration, the 3D data can be projected to the CCD camera images. So, to obtain the structure lines in 2D images, the remaining task is to extract 3D structure lines from 3D cloud points collected by the 3D cameras as shown in Figure 4.
The 3D camera collects a profile data along the light NIR line laser casted on the object surface, which is stored as a set of 3D cloud points with a fixed number. A projection map of a profile can be generated by:
[
ui vi
] =
[
su 0
0 sv
] [
Xi−Xmin
Zi−Zmin
]
, (11)
where[ui, vi]⊤is the projected image coordinate of the 3D point [Xi, Yi, Zi]⊤in the map,(su, sv)is two scale factors inXand
Zdirection, and[Xmin, Zmin]⊤is a minimum coordinate vector
of a profile.
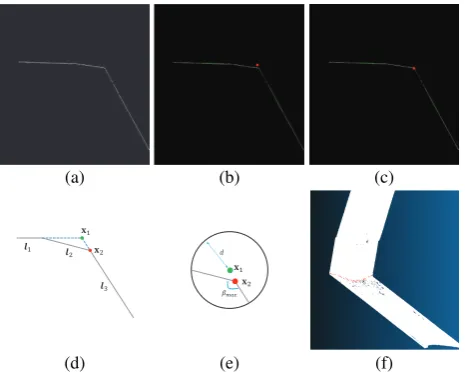
After the projection, it’s clear that the profile is a regular obtuse angle formed by two rays as shown in Figure 6(a). It’s easy to detect the two rays by Hough Transformation (Duda and Hart, 1972) and intersect these two rays at a point as a vertex on the 3D structure line. To deal with the problem of two or multiple lines detected along the two side of the ray, they should be merged to one according to the collinear principle. A 2D line can be written as a linear equation as:
au+bv+c= 0, (a≥0), (12)
(a) (b) (c)
ଵ ଶ
ଷ
ܠଵ
ܠଶ
ܠଵ
ܠଶ ߚ௫
݀
ଵ ଶ
ଷ
ܠଵ
ܠଶ
ܠଵ
ܠଶ ߚ௫
݀
ଵ ଶ
ଷ
ܠଵ
ܠଶ
ܠଵ
ܠଶ ߚ௫
݀
(d) (e) (f)
Figure 6: The illustration of extracting the vertexes on the 3D structure line: (a) the projection map of a 3D profile; (b) the intersection point marked in a red circle formed by the two green lines detected by Hough Transformation; (c) the found true vertex in the projection map; (d) the micro-structure of the bevel section which results in the intersection beingx1 instead
of x2 sometimes; (e) the demonstration to find true vertex by
searching the neighboring regions with a radiusdat the point with a maximumβangle treated as the true vertex; (f) the finally extracted structure line points displayed in red on the 3D cloud points.
difference of two detected linesl1andl2is calculated as:
do(l1,l2) = |
a1a2+b1b2|
√ (a2
1+b21) (a22+b22)
. (13)
Whendo(l1,l2)is close to 1.0, the two linesl1andl2are most
likely to be collinear. If these two lines are merged, the new linear equation will be:
a1+a2 2 u+
b1+b2 2 v+
c1+c2
2 = 0. (14)
With the detected lines merged, the remaining lines are usually the two required rays forming an intersection point as the vertex on the 3D structure line. For continuous 3D profiles, all these vertexes are collected to represent the 3D structure line.
In our test, the intersection formed by two rays is not usually located on the vertex on the 3D structure line as shown in Figure 6(b), due to the micro-structure presented in Figure 6(d). A neighborhood searching strategy can be effective to deal with this problem. As shown in Figures 6(d) and (e), the pointx2 is
the true vertex andx1is the intersection point. Given a searching
radiusd, each point locating within the range forms an angle with its neighbors. The point with a maximum angleβmax is most
likely to be the true vertex.
Figure 6(f) shows the structure line extraction results. The ac-quired structure lines usually are not straight due to the unsteady interference during the moves of the inspection robot. The line fitting method will be conducted by RANSAC (Fischler and Bolles, 1981) to get the complete straight line. According to the calibration results presented in Section 2.2.1, the fitted 3D structure lines can be projected to the CCD image in sequence. In fact, the CCD camera collects images at a low frequency of 6Hz, and the 3D camera acquires data at a high frequency of 339Hz. The above relative relation sets up only in the condition that the two cameras exposure at the same time. Then, we can assume that
•
•
݅ ͳ
݅
Figure 7: The fusion strategy of dealing with 3D data and 2D image data captured at the different frequencies. The blue rectangles denotes the CCD images, and the green and red vertical lines indicate the 3D profiles. Theiandi+ 1represent the image indexes. The green lines mean that the CCD camera and 3D camera exposure at the same time.
Figure 8: An example of the extracted structure lines based on image intensity (Green Line) and 3D point clouds (Red Line).
the following data until to the next CCD camera exposure can be treated as adding a translation vector to the data of the moment. According to the projection theory, all the 3D structure lines can be projected to the CCD images correspondingly, as shown in Figure 7.
Figure 8 illustrates an example of the extracted structure lines based on image intensity and 3D point clouds for the image displayed in Figure 4, from which it’s obvious that the later method is more robust.
2.3 Global Alignment and Blending
Figure 9: A detailed view of a small region in a mosaicked image by a simple superposition with luminance and color differences.
Figure 9 shows a small region of a mosaicked image by a sim-ple superposition after the group optimization, but with visible luminance and color differences between images. The open source software “Enblend” is a tool for compositing images in such a way that the seams between the images can be efficiently concealed by applying a multi-band blending on all the aligned images based on good stitching lines found between images. In “Enblend”, a mask implies the position of the corresponding image in the overall panorama is required, and it is stored as an image channel. So, the internal memory of the computer and computation will be wasted a lot if an overall mask is provided for each image. We propose an image grouping strategy to overcome this problem. For a panorama stitched from n input images, we can firstly divide these images into several groups with the sequence information and each contains⌊√n⌋images. In each group, a mask with the size of this region is generated for every image. Then, the “Enblend” is applied to generate seamless panoramas in each group. The final overall seamless panorama can be acquired by repeating the above procedures.
3. EXPERIMENTAL RESULTS
In this section, our proposed method was evaluated on real bridge bottom surface images. The chosen bridge is with the structure named “small box girder” as shown in Figure 2. A sequence of 244×2images were acquired by two JAI SP-20000C-CXP2 cameras, and each image with a size of5140×3840in pixels and a fixed frequency of 6Hz, while the inspection robot moved along a general scanning direction. The 3D cloud points of the corresponding area were acquired by two AT C2-2040(HS)-GigE cameras with a fixed frequency of 339Hz. The 3D model of this bridge section was obtained by a LRF called SICK LMS151.
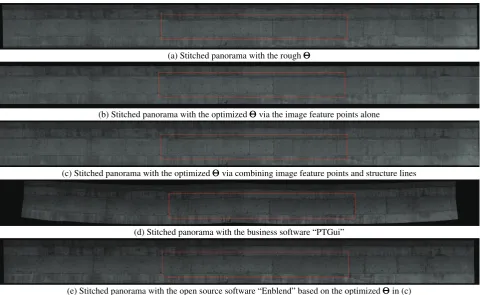
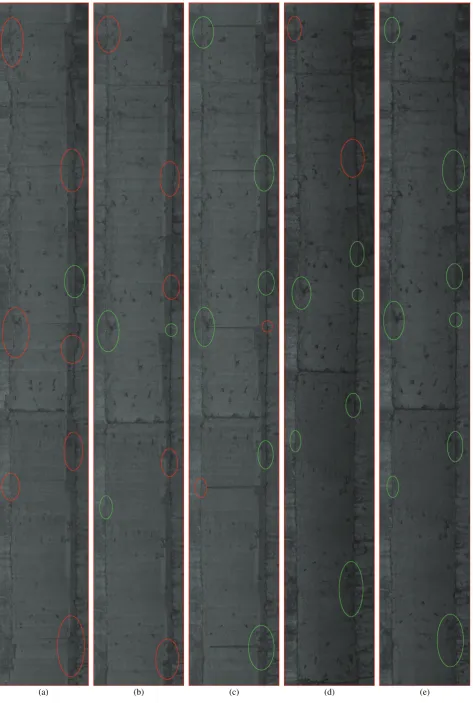
Figure 10 shows the overall feature-points-based and structure-lines-aided stitched panoramas, which were generated by the business software “PTGui”†and the open source software “En-blend” with the global alignment obtained by our method, re-spectively. To visually compare the stitching results, we chose some regions in all panoramas for more obviously comparing the quality of image stitching by human visual inspection as shown in Figure 11. According to the results shown in Figures 11(b) and (c), we can see that both the image feature points and the structure lines are effective in the stitching processes. What’s more, the structure-lines-based not only can improve the position and orientation data via our optimization method, but also can be a consistency constraint to optimize the stitching results. It may
†PTGui is available at: http://www.ptgui.com/
lead to some mistakes when the structure lines are inaccurate in some regions, such as the two correctly stitched regions (labeled by green ellipses in Figure 11(b)) but incorrectly optimized with the inaccurate structure lines (labeled by red ellipses in Figure 11(c)).
The panorama conducted by “PTGui” has the largest distortion as shown in Figure 10(d), which indicates that the results of “PTGui” are tend to trap in local optimum with poor performance in the overall image. In our method, the structure lines in images can accomplish local and global constraints to avoid this problem. The final stitched panorama obtained via “Enblend”-based seam lines optimization and image blending seems almost perfect with very few stitching mistakes, as shown in Figure 10(e) and Figure 11(e).
4. CONCLUSIONS AND FUTURE WORKS
In this paper, we have proposed a novel approach to create a wide-view panorama as seamless as possible of the concrete bridge bottom surface from hundreds of high-resolution images for bridge inspection, especially detecting cracks. The proposed approach is based on the assumption that the rough position and orientation information for each image have been obtained by the inspection robot by fusing the LRF and HPIE sensor data. In our method, each image is initially aligned and divided into several groups with the rough position and orientation data. Then, 3D structure lines are obtained from the 3D cloud points acquired with 3D cameras and projected onto the 2D images to generate 2D structure lines, which are combined with the cor-responding feature points between images to perform a position and orientation optimization in each group to increase the local alignment consistency. Next, a homographic refinement between groups is applied to increase the global alignment consistency. Finally, a fast seamless blending method with the open source software “Enblend” is used to eliminate both image luminance difference and color deviations. The experimental results on a set of more than 400 images captured from a real bridge bottom surface demonstrate that the proposed method can deal with the image stitching problem well and achieve satisfied results for the inspection application of concrete bridge bottom surface. The major benefit of optimization via 3D structure lines is the local and global alignment consistency for image stitching. It can not only overcome the limitations of texture and affine deformation, but also improve the optimized alignment results based on image features alone. By comparison with the business software “PTGui”, our method can obtain better stitching results.
(a) Stitched panorama with the roughΘΘΘ
(b) Stitched panorama with the optimizedΘΘΘvia the image feature points alone
(c) Stitched panorama with the optimizedΘΘΘvia combining image feature points and structure lines
(d) Stitched panorama with the business software “PTGui”
(e) Stitched panorama with the open source software “Enblend” based on the optimizedΘΘΘin (c)
Figure 10: The stitched panoramas under different conditions. The detailed views of the regions labeled by the red rectangles in these panoramas are correspondingly presented Figure 11.
ACKNOWLEDGMENT
This work was supported by the Hubei Province Science and Technology Support Program, China (Project No. 2015BAA027), the National Natural Science Foundation of China (Project No. 41571436), the Jiangsu Province Science and Technology Sup-port Program, China (Project No. BE2014866), and the South Wisdom Valley Innovative Research Team Program.
REFERENCES
Duda, R. O. and Hart, P. E., 1972. Use of the hough transformation to detect lines and curves in pictures. Communications of the ACM15(1), pp. 11–15.
Fischler, M. A. and Bolles, R. C., 1981. Random sample consensus: a paradigm for model fitting with applications to image analysis and automated cartography.Communications of the ACM24(6), pp. 381–395. Jakovljevic, Z., Puzovic, R. and Pajic, M., 2015. Recognition of planar segments in point cloud based on wavelet transform.IEEE Transactions on Industrial Informatics11(2), pp. 342–352.
Jia, J. and Tang, C.-K., 2008. Image stitching using structure deformation.
IEEE Transactions on Pattern Analysis and Machine Intelligence30(4), pp. 617–631.
Kurnianggoro, L., Hoang, V.-D. and Jo, K.-H., 2014. Calibration of a 2D laser scanner system and rotating platform using a point-plane constraint.
Computer Science and Information Systems12(1), pp. 307–322. Liu, Q., Liu, W., Lei, Z., Wang, J. and Liu, Y., 2011. A new approach to fast mosaic UAV images.Proceedings of the International Archives of the Photogrammetry, Remote Sensing and Spatial Information Sciences. Luhmann, T. and Tecklenburg, W., 2004. 3-D object reconstruction from multiple-station panorama imagery.ISPRS Archives34, pp. 5.
Michaelsen, E., 2011. Stitching large maps from videos taken by a camera moving close over a plane using homography decomposition. In:ISPRS Conference (CD), PIA.
Mor´e, J. J., 1978. The Levenberg-Marquardt algorithm: implementation and theory. In:Numerical analysis, Springer.
Nejad, F. M. and Zakeri, H., 2011. An optimum feature extraction method based on wavelet–radon transform and dynamic neural network for pavement distress classification. Expert Systems with Applications
38(8), pp. 9442–9460.
Oh, J.-K., Jang, G., Oh, S., Lee, J. H., Yi, B.-J., Moon, Y. S., Lee, J. S. and Choi, Y., 2009. Bridge inspection robot system with machine vision.
Automation in Construction18(7), pp. 929–941.
Prasanna, P., Dana, K. J., Gucunski, N., Basily, B. B., La, H. M., Lim, R. S. and Parvardeh, H., 2014. Automated crack detection on concrete bridges. IEEE Transactions on Automation Science and Engineering, pp. 1–9.
Rublee, E., Rabaud, V., Konolige, K. and Bradski, G., 2011. ORB: an efficient alternative to SIFT or SURF. In:IEEE International Conference on Computer Vision (ICCV), pp. 2564–2571.
Santagati, C., Inzerillo, L. and Di Paola, F., 2013. Image-based modeling techniques for architectural heritage 3D digitalization: Limits and potentialities.International Archives of the Photogrammetry, Remote Sensing and Spatial Information Sciences5(w2), pp. 555–560. Shi, J. and Tomasi, C., 1994. Good features to track. In:IEEE Computer Society Conference on Computer Vision and Pattern Recognition (CVPR), IEEE, pp. 593–600.
Wang, K. C., Hou, Z. and Williams, S., 2010. Precision test of cracking surveys with the automated distress analyzer. Journal of Transportation Engineering137(8), pp. 571–579.
Xiong, Y. and Pulli, K., 2010. Fast image stitching and editing for panorama painting on mobile phones. In: IEEE Computer Society Conference on Computer Vision and Pattern Recognition Workshops (CVPRW), IEEE, pp. 47–52.
Yahyanejad, S., Wischounig-Strucl, D., Quaritsch, M. and Rin, B., 2010. Incremental mosaicking of images from autonomous, small-scale uavs. In:IEEE International Conference on Advanced Video and Signal Based Surveillance (AVSS), IEEE, pp. 329–336.
Zaragoza, J., Chin, T.-J., Tran, Q.-H., Brown, M. S. and Suter, D., 2014. As-projective-as-possible image stitching with moving DLT.IEEE Transactions on Pattern Analysis and Machine Intelligence (PAMI)36(7), pp. 1285–1298.
Zhang, W., Zhang, Z., Qi, D. and Liu, Y., 2014. Automatic crack detection and classification method for subway tunnel safety monitoring.
Sensors14(10), pp. 19307–19328.
Zhang, Z., 2000. A flexible new technique for camera calibration.
IEEE Transactions on Pattern Analysis and Machine Intelligence (PAMI)
(a) (b) (c) (d) (e)