3D RECONSTRUCTION AND MODELING OF SUBTERRANEAN LANDSCAPES
IN COLLABORATIVE MINING ARCHEOLOGY PROJECTS:
TECHNIQUES, APPLICATIONS AND EXPERIENCES
A. Arles a, c, *, P. Clerc b, G. Sarah c, F. Téreygeol d, G. Bonnamour a, J. Heckes e, A. Klein e
a
Arkemine sarl - [email protected] b
INRAP-GES Strasbourg, France c
IRAMAT, Centre Ernest-Babelon, CNRS, Orléans University, France d
IRAMAT, Laboratoire Métallurgies et Cultures, CNRS, Belfort University, France e
Deutsches Bergbau-Museum, Bochum, Germany
KEY WORDS: Photogrammetry, Mining, Underground, 3D Reconstruction, Tool Marks, Radiance Scaling, Archaeology
ABSTRACT:
Mining and underground archaeology are two domains of expertise where three-dimensional data take an important part in the associated researches. Up to now, archaeologists study mines and underground networks from line-plot surveys, cross-section of galleries, and from tool marks surveys. All this kind of information can be clearly recorded back from the field from three-dimensional models with a more cautious and extensive approach. Besides, the volumes of the underground structures that are very important data to explain the mining activities are difficult to evaluate from “traditional” hand-made recordings. They can now be calculated more accurately from a 3D model. Finally, reconstructed scenes are a powerful tool as thinking aid to look back again to a structure in the office or in future times. And the recorded models, rendered photo-realistically, can also be used for cultural heritage documentation presenting inaccessible and sometimes dangerous places to the public.
Nowadays, thanks to modern computer technologies and highly developed software tools paired with sophisticated digital camera equipment, complex photogrammetric processes are available for moderate costs for research teams.
Recognizing these advantages the authors develop and utilize image-based workflows in order to document ancient mining monuments and underground sites as a basis for further historical and archaeological researches, performed in collaborative partnership during recent projects on medieval silver mines and preventive excavations of undergrounds in France.
* Corresponding author.
1. INTRODUCTION
Researches on historic mining connect the authors in recent years (CNRS, Deutsches Bergbau-Museum in Bochum and preventive archaeology companies). This paper presents some experiences and practices in recording subterranean mining monuments and underground sites carried out in the past two years.
The access to three-dimensional information is particularly important to understand the organization of underground structures, because they are developed in all directions (Ancel, 1997; Téreygeol, 2007).
Up to now the methodology used to study a mine or an underground network is based on the recording of successive axis with decameter, compass and clinometer. This technique is used to produce maps that can be combined with surveys of galleries cross sections to obtain a rough 3D model of an underground structure (Ancel, 2006; Cauuet, 2004). In this case the model is produced at the end of the study process and can not be fully used in the understanding of an underground. Thanks to modern photogrammetric software and even more to high-end computer power available for moderate costs 3D data generated out of 2D unordered image series create new opportunities and applications to record subterranean structures (Furukawa and Ponce, 2010; Pierrot-Deseilligny and Clery, 2011; Pierrot-Deseilligny and Paparoditis, 2012; Snavely et al., 2006).
3D data, easily obtained from ‘normal’ images, create new opportunities on historical mining research: volumes, spaces and areas are easily available today. These valuable data are necessary to study potential profits of a mine and the amount of associated mining activities as well as they allow defining preconditions to study the management of a mine during the whole period of activities.
Certainly, mining and underground archaeology are fields of research that can achieve great efficiencies, if modern 3D technologies are available to support the daily work directly. From a three-dimensional model of a part of a mine or an underground building, produced at the very beginning of the study process, it is possible now to extract all the data like those previously manually collected and mapped from archaeological surveys. Recording sections of a gallery, profiles of a working place or underground installation, but also the tool marks on the underground walls can be more easily and exhaustively performed from a 3D model. In this case, algorithms to filter and to separate parts of the 3D models can also be used to emphasise the information to be observed (Cignoni et al., 2005; Palma et al., 2010; Vergne et al., 2010). All this kind of information is very important to understand how ancient craftsmen organized their underground work and settlements but also the excavation techniques they have used. All these data provide evidences to define the skills of the miners and underground workers.
Last but not least, photo-realistic 3D models can also be used as a tool for cultural heritage visualization as they provide the
opportunity to present to the public historical places usually difficult and quite dangerous to access.
Finally, risk and problems should not be suppressed. The environmental conditions in the underground, in historical mining areas in particular, are not comfortable and special security equipment and procedures are required. Generally, an ancient mine in Europe is always too narrow, too dirty, too wet, too dark and often too cold as well the equipment is claimed strongly and is subject to high wear. Then the photogrammetric technique has also been chosen because it requires gear that can be brought in such particular environment.
2. EQUIPMENT AND SOFTWARE
During our test two DSLR system cameras have been used, a Nikon D3 with lens Nikkor AFD 18 mm and Nikon SB900 flash and a Canon 5D with Canon lens EF 17-35mm f/2.8L and Canon 430exII flash. The flash units are either attached to the hot shoe on top of the camera body or they are mounted on a slider very close and parallel to the lens. This setting provides almost completely homogeneous illumination with minimal shadows from the lens point of view.
Both cameras have full-frame sensors with relatively large pixel sizes allowing to record images with less noise in low light surroundings. The high resolution of the sensors combined with the use of wide angle lens reduce the number of images needed to cover an object, a quite significant advantage to document small and narrow mining galleries…
The shooting parameters (speed, aperture, iso, flash power) depend on the places studied (small or big). In fact, they are setup to maximize the depth of field (small aperture) and the sharpness (aperture not too small) without producing too much noise on photos (iso not too high). The power of the flash is automatically controlled in TTL mode. We also have decided to shoot raw pictures with an over exposition of 2ev. On a first hand, we have good exposition on areas that would be underexposed without the +2ev exposition and on another hand the areas that are too much overexposed after our shooting are corrected during the conversion of raw files into tiff ones. Finally, it increases the amount of information recorded. Generally, transferable information for the best camera, lens and flash settings cannot be supplied seriously. These settings should be determined individually, object-related and by user’s experience. Finally, the photographic settings for automated point cloud generation are more or less a compromise. To supply a maximum depth of field the lenses should be stopped down as far as possible, because the influences by diffraction blurring are much more less than those by defocussing, or under- and overexposing images may have advantages to avoid noise better than changing the iso-speed.
Some practical experience and training is necessary to record underground cavities completely photographically, to provide image series for successful photogrammetric evaluations. Because of the limited space in abandoned historic mines, the largest part of the work has to be performed in very unfavorable body postures. Main parts of the image series has to be recorded free hand without viewfinder control. To control the images on the camera’s monitor in practice is feasible for single shots only.
Both camera systems are carrying out their duties reliably, regular maintenance included. It is advisable to protect the lenses against dust and splashing water in particular, because both can penetrate into the housing following this ‘detour’. There is the desire to use smaller, dust- and waterproof cameras, of course. Normally used to record sports- and other action scenes, often secured to the athlete’s body, these cameras
provide sufficient videos and pictures for visual presentations. But the point clouds computed from these images are very noisy. If the cameras cannot be equipped with a flash light, voluminous lamps qualify the advantage of these handy camera systems.
As experiments show generally, cameras equipped with smaller sensors than the APS-C format, are not well-suited as tools for the 3D reconstruction workflow, because the quality of the calculated point clouds was not sufficient, from today’s point of view.
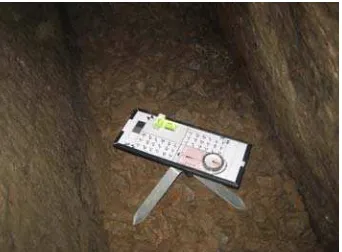
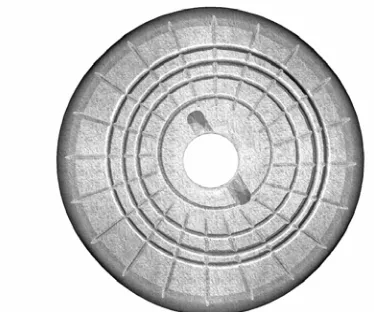
Surveying a net of traverse lines, measured with the help of a ‘Kassel’ type suspension device with compass, clinometer and measuring chain is traditional routine to map the galleries. Along this framework additional local coordinate systems are needed to orient the image series. After some experiments a ground control plate as shown in Figure 1 was design to be used as a reference scale.
Figure 1. Ground control plate to orient local image series
Placed horizontally and aligned to north the plate is positioned into the scene (Figure 2). Known distances between control marks on the plate, its horizontal alignment and North indicating by compass are used for scaling and orientation.
Figure 2. Ground control tablet, levelled and aligned to north, situated into the recorded scene.
If the image series are recorded regularly with sufficient overlap and all object areas are visible in a minimum of 5 images, the resulting image bundle is able to calibrate itself. The resulting 3D model can be scaled and oriented by measuring the marks visible on the ground control plate. Encouraged by the good orientation results with the ‘analogue’ reference plate, an ‘electronic’ box (Figure 3) is currently equipped with a north-facing and heading reference sensor. Now the box can be positioned freely in the object space. Time-controlled registered orientation angles of the box and scale marks on the surface of the box are supporting the orientation process of the point clouds sufficiently, as early laboratory tests suggests.
Figure 3. Ground control box prototype with north facing and heading reference sensor on a test field
To complete the different steps of our photogrammetric process, we used several software. For the photogrammetric treatment we have chosen to use Agisoft Photoscan or EOS System Photomodeler. The 3D models produced are inspected (cross section extraction, tool marks survey, volume computation, model comparison) with both commercial and opensource software: Geomagic Rapidform XOR, Technodigit 3D Reshaper, Meshlab, Cloud Compare. The 3D open source Blender software is finally used for the valorisation tests.
3. FIELD TESTS
We have chosen to develop our methodology on different excavation sites to face various underground places and cases of study:
- Sainte-Marie-aux-Mines (Haut-Rhin) : narrow galleries and tool marks.
- Melle (Deux-Sèvres): fire-setting mining technique. - Castel-Minier (Ariège): various mining techniques
and ground mill stone.
- Marigny-Brizay (Vienne): tool marks.
3.1 Documentation of working places of miners and galleries
We have set up several tests to evaluate the ability of our process and photogrammetric software to produce accurate data. Some important parameters to check are the possibility to work without light in divergent limited spaces especially manhole and galleries (Figure 4) but to also survey long galleries and even an entire mine.
Figure 4. Manhole in a medieval underground
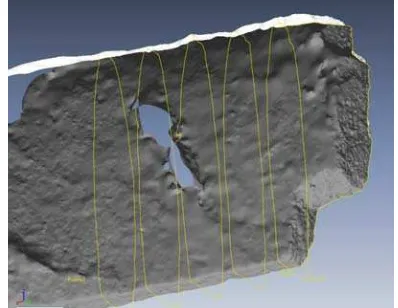
Figure 5 shows some 40 m of a medieval gallery (Patris Mine, Sainte-Marie-aux-Mines). 892 images were taken to reconstruct
this part of a mine. To keep the models manageable and flexible, it is recommended to divide a whole mine in several parts with overlapping regions. In this case, the central room dug in the dyke in the centre of the mine has been used as common area between the three galleries. So, a model associated with each gallery has been produced then the global model has been reconstructed by looking for analogous points available in the centre room of each gallery model. In order to make the process of picking analogous points easier, we have placed coloured targets in the common area that can be found easily (Figure 4). Once scaled and oriented, the model is used to compute the volume of the mine. The 40 cubic meters estimated could be next compared to the volume of the rock heap still observable at the entrance of the mine to discuss about the underground parts that may not be accessible for now.
Figure 5. Point cloud generated out of 892 images to reconstruct galleries of about 40 m length.
Considering the ideal photographs used for photogrammetric purpose should be taken as parallel as possible with the surveyed surface; the recording process of a gallery is a bit tricky. In fact, the principle is to move the camera along the gallery with a sort of helical movement. The camera is always held against a surface looking the opposite side.
3D reconstructions of miners working places are further good examples to demonstrate the advantages of documentation by structure-from motion techniques. Figure 6 shows the extraction of cross sections and profile of a narrow working place at the end of a mine gallery (Gabe Gottes, Sainte-Marie-aux-Mines).
Figure 6. Mine gallery with extracted cross sections and profile
The model in figure 7 shows a piece of a gallery with extended entrance areas at the end. The gallery was excavated from both ends at the same time. One direction was excavated by fire-setting. The heading in opposite direction was done by hammer and chisel. The model was calculated out of some 400 images recorded twice in both directions. EOS Photomodeler and
Agisoft Photoscan were used, but it was not possible to combine all the images in one model automatically. About 8 identical points (4 are needed as a minimum) have to be identified in the images, a very time consuming process, because it is very difficult to identify identical points in photos of old gallery surfaces. This kind of very narrow gallery which is only 40 cm large may be a case limit for our method. But considering that a mine gallery can not be narrower, this kind of scene could be more easily treated in the future using coloured targets to help the process.
Figure 7. Gallery counter excavated from both ends by fire-setting and by hammer and chisel
3.2 Studies on fire-setting
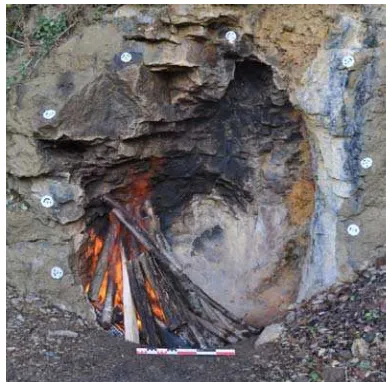
Fire-setting is a traditional mining technique used to excavate minerals embedded in hard rock deposits in particular. This mining method was simulated as an archeometallurgical experiment at the research laboratories of the ‘Mines d’argent des Rois Francs’ in Melle (Deux-Sèvres) (Figure 8).
Eighteen complete fire-setting experiments were documented photogrammetrically. The first zero state has been oriented with the small ground control plate. Doing so, the eight control points surrounding the fire setting area were determined simultaneously to serve as local control points for the next steps.
Figure 8. Experimental fire-setting on the scientific platform of the ‘Mines d’argent des Rois Francs’ in Melle
Some 40 photos per phase were taken with a Nikon D90 and 18 mm lens. The orientation provides a coordinate residual of 2 mm on average. Each single surface model was calculated phase by phase with Agisoft Photoscan and exported for further analysis.
After each fire, the surface is cleaned by hammer and chisel. The excavated ore is weighed and its volume could be derived from its water displacement to compare it with the volume
losses calculated as a result of the photogrammetric process. The accuracy of the volume determination is less than 1 %. The volume dug during the fire-setting experiment can be visualized by different coloured areas after calculation of differences between the surface models of adjacent fires (Figure 9).
Figure 9. Surface changes after a fire-setting
This method offers to mining archaeologists a way to have a better understanding of the fire-setting technique. From now, they can compare the result of a fire-setting with the size and the place of the experimental pyre.
3.3 Reconstruction of tool marks
The analysis of tool marks provides valuable information about the used tools and techniques as well as the skills and knowledge of the miners (Adlung and Stassburger, 2009; Pierre and Weber, 2011). The tool marks can tell us the quality of the used tools, the chosen working directions and the knowledge available to interpret the geological properties of the rock. Furthermore, tool marks show tracks of right-handed and/or left-handed work as well as hints on unskilled forces or even if children were employed. In some cases, the amount of the daily work can be read off. The length and the depth of the tool marks, the distance between them and their relative angle are some parameter of interest to characterize their tracks.
It must be noted that depth of tool marks is usually of a few millimeter only. The shooting direction shall point perpendicular at the rock face. The flashlight is mounted on the camera body on top or sideward and angled parallel to the lens to avoid shadows as good as possible. Reflections on top of the rock surface, caused by water e.g., are ‘empty areas’ like shadows and these cannot be evaluated satisfactorily. Practical image scales are 1:30 - 1:50. Recording the images the camera should be moved parallel to the surface with 90% overlap in both directions. Regarding the relatively small size of the tool mark areas, series of some 50 images can cover the area of interest sufficiently. To scale the model, some distances have to be measured between marked tie points.
Agisoft Photoscan is used to calculate the surface model. To optimize the process of surface generation to not dissolve the tool marks the quality parameter of Photoscan is set to ‘ultra high’. The result is exported for further treatments. Figure 10 shows a rendered scene of a wall model in a medieval underground network (Marigny-Brizay, Vienne) to analyze the tool marks.
Figure 10. Wall model to analyze tool marks with different virtual light conditions
The models are imported into software suites like Rapidform XOR and Technodigit 3D Reshaper to handle point clouds and meshes. Both software allow to remove the surface texture that could disturb the observations. They also offer functions to illuminate the surface by changing light directions. These functions are used to highlight the tool marks graphically and to plot them manually. Changing the artificial light conditions increases the visibility to survey other marks as it could be done on the field using low angle flash illumination (Figure 10). But in our case, the process can be done in an almost exhaustive way in the lab with the 3D model. Finally the tool marks are vectorized and are available for further analysis (Figure 11A).
Figure 11. Manually mapped tool marks on surface without texture (A.) and Meshlab’s radiance scaling lit sphere operator
to emphasis tool marks (B.)
Based on the 3D reconstruction of tool mark's micro topography, some tests with rendering algorithms were done to illuminate the surface artificially and to create preconditions to extract tool marks automatically. Best results were achieved until now by a radiance scaling shader (Vergne et al., 2010), included in the open source software Meshlab. Figure 11B shows some effects of the shader with the lit sphere display mode: the tool marks contrast clearly with their surroundings.
3.4 Reconstruction of an ore mill
During excavations on a medieval smeltery (Castel-Minier, Ariège) numerous millstones in different conditions were discovered (Figure 12). In order to reconstruct a mill for ore crushing experiments, a typical millstone should be reconstructed first.
The surface of the millstone can be treated comparable to the surfaces of rocks with tool marks. The grooves (so called furrows) of a worn or weathered millstone are the tool marks in this case.
Figure 12. Mill stone on the archaeological site
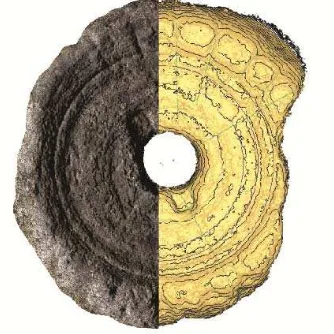
The millstone was recorded in parts by photos taken with some 80 % overlap and an image scale of 1:20. Figure 13 (left) shows the 3D model of the runner stone of a medieval ore mill. The photogrammetric process provides a meshed model of the millstone surface, to be used for further geometrically analyses (Figure 13 right).
Figure 13. 3D model (left) and geometrical analyses (right) of the mill stone
The model could be analyzed and vectorized by 3D Reshaper and finalized with AutoCad 2011 Civil (Figure 14). This model has to be discussed with a stone mason now, to build up a millstone in a 1:1 scale as part of a reconstructed medieval ore mill.
Figure 14. Proposal for reconstruction
3.5 Cultural heritage valorization
Finally, the photogrammetric technique produces 3D models that can be textured with the photographs taken to compute the 3D data. After a study, it is next possible to produce a photorealistic model that can be exposed to the public. Several presentation solutions are available: interactive 3D model, going through video, augmented reality.
To present a mine or an underground, places difficult and sometimes quite dangerous to access, the going trough video is certainly one of the best choice. With the open source Blender software, a photorealistic model can be imported and used as a scene to produce a going trough animation. A camera can be moved inside the model with different light conditions (Figure 15). Realized at the end of a research program the scientific data extracted from the study at the 3D model can also be emphasized in the produced video.
Figure 15. Production of a video inside the Marigny-Brizay medieval underground site with Blender.
4. CONCLUSION
Results obtain after our field tests covering the different types of mines and underground structures confirm that our photogrammetric methodology is effective to produce accurate 3D data. We can now propose to mining archaeologists a new tool that will help them in their work. Even if the traditional survey techniques are still completely reliable, the photogrammetric approach give a better ratio between the field work and the data gathered.
With a minimum training, mining archaeologists could have access to 3D data using simple gear (camera, flash) that can be used in extreme environment.
References:
Adlung, S., Stassburger, M., 2009. Dating of Mine Gallery Profiles: a contribution to typo-chronology in mining archaeology. In: Silvertant, J. (Ed.), Recognition, Investigation and Preservation of Ancient Mining Relics. Institute Europa Subterranea, pp. 80-107.
Ancel, B., 1997. Relevés topographiques et archéologiques en anciennes mines : méthodologie d’un outil d’interprétation. In: 12th Intern. Congress Speleology, La-Chaux-de-Fonds, pp. 195-198.
Ancel, B., 2006. Le relevé topographique et archéologique d’une ancienne mine : méthode et apports. In :“Mine et métallurgie en Provence et dans les Alpes du Sud de la Préhistoire au XXe siècle : reconversion industrielle et enjeux culturels”, Châteaudouble, 2001. Actilia Multimédia, pp. 189-195.
Cauuet, B., 2004. Les mines d’or et d’argent antiques de Dacie : le district d’Alburnus Maior (Rosia Montana, Roumanie). Archéologies. Vingt ans de recherches françaises dans le monde. Ministère des Affaires Etrangères, Paris, pp. 127-128. Cignoni, P., Scopigno, R., Tarini, M., 2005. Technical Section: A simple normal enhancement technique for interactive non-photorealistic renderings. Comput. Graph., 29(1), pp. 125-133. Furukawa, Y., Ponce, J., 2010. Accurate, Dense, and Robust Multi-View Stereopsis. IEEE Transactions on Pattern Analysis and Machine Intelligence, 32(8), pp. 1362-1376.
Palma, G., Corsini, M., Cignoni, P., Scopigno, R., Mudge, M., 2010. Dynamic Shading Enhancement for Reflectance Transformation Imaging",. ACM Journ. on Computers and Cultural heritag, 3(2).
Pierre, F., Weber, A., 2011. The use of gunpwder in 1617 in the mines of Le Thillot (Vosges-France) - inspiration or imitation in the innovative process. In: Claughton, P., Mills, C. (Eds.), Mining Perspectives. Cornwall Council, pp. 30-41.
Pierrot-Deseilligny, M., Clery, I., 2011. APERO, an Open Source Bundle Adjusment Software for Automatic Calibration and Orientation of a Set of Images. In: The ISPRS Commission
V Symposium, Image Engineering and Vision Metrology,
Trento, Italy.
Pierrot-Deseilligny, M., Paparoditis, N., 2012. A multiresolution and optimization-based image matching approach: An application to surface reconstruction from SPOT5-HRS stereo imagery. International Archives of Photogrammetry, Remote Sensing and Spatial Information Sciences, 36(Part 1/W41).
Snavely, N., Seitz, S.M., Szeliski, R., 2006. Photo Tourism: Exploring image collections in 3D. In: ACM Transactions on Graphics (Proceedings of SIGGRAPH 2006).
Téreygeol, F., 2007. Production and circulation of silver and secondary products (lead and glass) from frankish royal silver mines at Melle (VIIth-Xth century). In: Henning, J. (Ed.), Post-roman towns and trade in Europe, byzantium and the near-East, pp. 123-134.
Vergne, R., Pacanowski, R., Barla, P., Granier, X., Schlick, C., 2010. Radiance Scaling for Versatile Surface Enhancement. In: I3D '10: Proc. symposium on Interactive 3D graphics and games. ACM.