Binary Logistic Regression: Tekanan Darah versus Merokok, Berat Badan
Link Function: Logit
Response Information
Variable Value Count
Tekanan Darah 1 22 (Event) 0 70
Total 92
Logistic Regression Table
Odds 95% CI Predictor Coef SE Coef Z P Ratio Lower Upper Constant 1.98717 1.67930 1.18 0.237
Merokok 1.19297 0.552980 2.16 0.031 3.30 1.12 9.75 Berat Badan -0.0250226 0.0122551 -2.04 0.041 0.98 0.95 1.00
Log-Likelihood = -46.820
Test that all slopes are zero: G = 7.574, DF = 2, P-Value = 0.023
Goodness-of-Fit Tests
Method Chi-Square DF P Pearson 40.8477 47 0.724 Deviance 51.2008 47 0.312 Hosmer-Lemeshow 7.2241 8 0.513
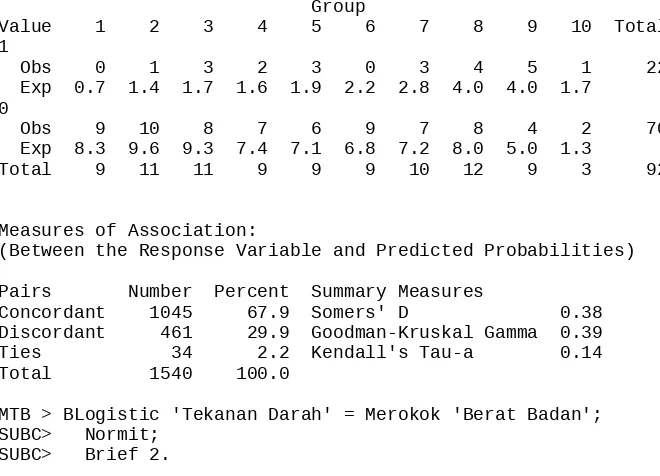
Table of Observed and Expected Frequencies:
(See Hosmer-Lemeshow Test for the Pearson Chi-Square Statistic)
Group
Value 1 2 3 4 5 6 7 8 9 10 Total 1
Obs 0 1 3 2 3 0 3 4 5 1 22 Exp 0.7 1.4 1.7 1.6 1.9 2.2 2.8 4.0 4.0 1.7
0
Obs 9 10 8 7 6 9 7 8 4 2 70 Exp 8.3 9.6 9.3 7.4 7.1 6.8 7.2 8.0 5.0 1.3
Total 9 11 11 9 9 9 10 12 9 3 92
Measures of Association:
(Between the Response Variable and Predicted Probabilities)
Pairs Number Percent Summary Measures
Concordant 1045 67.9 Somers' D 0.38 Discordant 461 29.9 Goodman-Kruskal Gamma 0.39 Ties 34 2.2 Kendall's Tau-a 0.14 Total 1540 100.0
MTB > BLogistic 'Tekanan Darah' = Merokok 'Berat Badan'; SUBC> Normit;
SUBC> Brief 2.
Link Function: Normit
Response Information
Variable Value Count
Tekanan Darah 1 22 (Event) 0 70
Total 92
Logistic Regression Table
Predictor Coef SE Coef Z P Constant 1.20106 0.976437 1.23 0.219 Merokok 0.703780 0.325031 2.17 0.030 Berat Badan -0.0150848 0.0070250 -2.15 0.032
Log-Likelihood = -46.734
Test that all slopes are zero: G = 7.746, DF = 2, P-Value = 0.021
Goodness-of-Fit Tests
Method Chi-Square DF P Pearson 40.5980 47 0.733 Deviance 51.0291 47 0.318 Hosmer-Lemeshow 7.1072 8 0.525
Table of Observed and Expected Frequencies:
(See Hosmer-Lemeshow Test for the Pearson Chi-Square Statistic)
Group
Value 1 2 3 4 5 6 7 8 9 10 Total 1
Obs 0 1 3 2 3 0 3 4 5 1 22 Exp 0.6 1.4 1.7 1.6 1.9 2.2 2.8 4.0 4.0 1.7
0
Obs 9 10 8 7 6 9 7 8 4 2 70 Exp 8.4 9.6 9.3 7.4 7.1 6.8 7.2 8.0 5.0 1.3
Total 9 11 11 9 9 9 10 12 9 3 92
Measures of Association:
(Between the Response Variable and Predicted Probabilities)
Pairs Number Percent Summary Measures
Concordant 1046 67.9 Somers' D 0.38 Discordant 462 30.0 Goodman-Kruskal Gamma 0.39 Ties 32 2.1 Kendall's Tau-a 0.14 Total 1540 100.0
MTB > BLogistic 'Tekanan Darah' = Merokok 'Berat Badan'; SUBC> Gompit;
SUBC> Brief 2.
Binary Logistic Regression: Tekanan Darah versus Merokok, Berat Badan
Response Information
Variable Value Count
Tekanan Darah 1 22 (Event) 0 70
Total 92
Logistic Regression Table
Predictor Coef SE Coef Z P Constant 1.14767 1.38146 0.83 0.406 Merokok 0.969003 0.448461 2.16 0.031 Berat Badan -0.0196978 0.0101180 -1.95 0.052
Log-Likelihood = -46.976
Test that all slopes are zero: G = 7.263, DF = 2, P-Value = 0.026
Goodness-of-Fit Tests
Method Chi-Square DF P Pearson 41.3632 47 0.704 Deviance 51.5125 47 0.302 Hosmer-Lemeshow 8.4240 8 0.393
Table of Observed and Expected Frequencies:
(See Hosmer-Lemeshow Test for the Pearson Chi-Square Statistic)
Group
Value 1 2 3 4 5 6 7 8 9 10 Total 1
Obs 0 1 3 3 2 0 3 2 5 3 22 Exp 0.8 1.5 1.7 1.6 1.9 2.2 2.4 2.8 3.4 3.7
0
Obs 9 10 8 6 7 9 6 7 4 4 70 Exp 8.2 9.5 9.3 7.4 7.1 6.8 6.6 6.2 5.6 3.3
Total 9 11 11 9 9 9 9 9 9 7 92
Measures of Association:
(Between the Response Variable and Predicted Probabilities)
Pairs Number Percent Summary Measures