Development of PV Simulator by Integrating
Software and Hardware for Laboratory Testing
Aryuanto Soetedjo
Department of Electrical Engineering National Institute of Technology (ITN)
Malang, Indonesia [email protected]
Yusuf Ismail Nakhoda
Department of Electrical Engineering National Institute of Technology (ITN)Malang, Indonesia
Abraham Lomi
Department of Electrical Engineering National Institute of Technology (ITN)
Malang, Indonesia
Gunawan Eko Hendroyono
Department of Electrical Engineering National Institute of Technology (ITN)Malang, Indonesia
Abstract—This paper presents the development of PV (photovoltaic) simulator used for laboratory testing. The proposed simulator integrates both the software and the hardware device. The aim of proposed simulator is to develop an instrument that provides the output electrical power which is determined by the characteristic of PV under the varying solar irradiation. The Simulink software is employed to model the I-V characteristic of the PV. The output of Simulink is interfaced to a microcontroller for adjusting the current of an adjustable DC power supply. The experimental results show that the proposed simulator works appropriately, in the sense that power delivered by the adjustable power supply follows the maximum output power determined by the solar irradiation simulated in the Simulink. Further, the output of PV simulator could be connected to real electrical load for laboratory testing.
Keywords—PV simulator; Simulink; adjustable power supply; laboratory testing.
I. INTRODUCTION
Nowadays, the researches on renewable energy resources increase significantly. The PV is one of the renewable resources widely used in the market. For laboratory testing, it is common for researchers to use the PV simulator for evaluating and validating the experiments related to the PV systems. There are two types of PV simulator: a) Using the software [1], [2], [3], [4], [5], [6], [7]; b) Using the hardware devices [8], [9], [10]. The advantages of simulation software are: a) It could be simulated easily on the computer; b) The complex models or techniques could be developed; c) The simulation time could be controlled accordingly. While one major drawback is that the simulator could not be implemented in the real application.
Contrary to the simulation software, the simulation hardware provides the real implementation. It could be connected directly into the electrical power network. However, due to the hardware complexity, the PV models that could be implemented are limited.
In the simulation software, the PV was simulated using the simple models [1], [2], [4], [6], [7] or the detailed models [3], [5]. The models are usually implemented using the Matlab/Simulink software. The PV model describes the characteristic of I-V (current-voltage) under the varying solar irradiation and temperature. In [1],[2],[7] the PV was modeled by a current source in parallel with a diode and simulated using the Matlab. The model in [1] was used to compare several MPPT (Maximum Power Point Tracking) topologies. The diode connected in series with the resistor was employed as the PV model in [4]. They proposed the simple PV model in order to apply the model to the circuit simulator software. The model is very simple and no iteration process is involved.
The PV model by considering the environment conditions such as solar irradation, and wind speed was proposed in [5]. They compared the model with the different PV technologies such as monocrystalline silicon, polycrystalline silicon, and thin film. The performance of the model is good when compared to the monocrystalline silicon and thin film, but it is poor when compared to the polycrystalline silicon.
The simple PV model developed in Matlab was used to simulate the energy resource for the Smart Grid simulation [6]. The PV model is a sub-system from the whole system consists of the wind generator, the main grid, the distribution line and the loads.
In the simulation hardware, the real PV module is eliminated by emulating it using an electronic circuit. In [8], a real-time PV simulator was developed using the Field Programmable Gate Arrays (FPGAs). The simulator consists of two main components, i.e. the switched-mode DC/DC converter and the control system. The control system generates the PWM (Pulse Width Modulation) signal to control the output voltage of the DC/DC converter according to the look-up table of I-V characteristic which is stored in FPGA unit. The user could select the solar irradiation level and cell temperature to simulate the operating condition of PV generator.
978-1-4673-7408-8/15/$31.00©2015 IEEE
In [9], [10], the microcontrollers were used to calculate the PV characteristic and to control the DC-DC buck converter for simulating the PV generator. The look-up table was adopted to store the I-V curve [9]. The algorithm to calculate the I-V characteristic was implemented on the microcontroller [10].
In this research, we propose the PV simulator by combining the software and the electronic hardware. Compared to the existing systems, our proposed method has the benefits such as: it is able to simulate the complex model by the software and the realistic simulation could be performed by the hardware. The Simulink software is employed to simulate the I-V characteristic of PV under the varying solar irradiation. Using the model, the power output of PV is calculated. Based on this output power, the Simulink controls the current of adjustable DC power supply to adjust the desired output power. Thus the maximum power delivered by DC power supply follows the power generated by the PV model.
The rest of paper is organized as follows. Section 2 presents the architecture of proposed system. Section 3 describes the implementation of proposed system. Section 4 presents the experimental results. Conclusions are covered in Section 5.
II. PROPOSED SYSTEM
The aim of proposed simulator is to generate the electrical power in which the maximum output power is determined by the solar irradiation. For instance, when the solar irradiation is 1 Sun, then according to the PV model (I-V characteristic), the PV output is assumed as 50 Watt. Thus the maximum output power of the simulator should be 50 Watt.
The architecture of PV simulator is illustrated in Fig. 1. It consists of the software part and the hardware part. In the simulation software part, the Simulink software is employed to simulate the PV as explained in the next section. The output of simulation software is used to control the hardware part, i.e. the adjustable power supply via the microcontroller. The microcontroller is selected as the interfacing device because of the capability to communicate with the Simulink easily. The serial communication line is employed to communicate between the Simulink and the microcontroller.
Fig. 1. The architecture of PV simulator.
The main components of the hardware part are: a) Microcontroller; b) Current and voltage sensors; c) Adjustable power supply; and d) Servo motor. The Arduino microcontroller is employed to interface between the Simulink and the adjustable power supply. To provide the simplicity, the popular IC LM723 is employed as the main component of adjustable power supply. Using this component, the current of the power supply could adjusted by a potentiometer. Then the power supply module is modified by adding a servo motor to control the rotation of the potentiometer.
The rotation of servo motor is controlled by the Arduino microcontroller according to the control algorithm computed by the Simulink. The current and voltage sensors are employed to read the current and voltage of the adjustable power supply. These parameters are sent to the Simulink for calculating the proper position of the servo motor.
III. IMPLEMENTATION
A. Simulink Model of PV Generator
The PV generator is modelled as illustrated in Fig. 2, where the output current (IL) depends on the solar irradiation (G) and the cell temperature (T) [1]. The model uses the parameters listed in Table 1, which is the typical PV characteristic for 50 Watt PV module.
Fig. 2. The equivalent circuit of PV model [1].
TABLE I. PV CHARACTERISTIC [7]
The PV module is modeled using MATLAB function block as illustrated in Fig. 3. The PV block has three inputs, i.e. the PV voltage, the solar irradiation, and the temperature. The output of the PV block is the PV current. In the experiment, two PV modules are connected in parallel as shown in the figure.
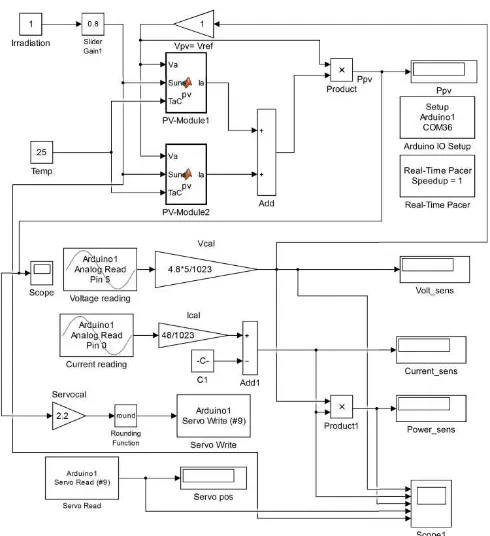
The complete Simulink model of the proposed system is illustrated in Fig. 4. The upper part is the Simulink model of PV model, while the lower part is the model for interfacing to the microcontroller. Thank to [11] which provides the MATLAB package to support the Arduino microcontroller. The interfacing between Simulink and Arduino microcontroller involves the voltage reading, the current reading, and the servo motor control.
As illustrated in the figure, the input voltage of PV module is taken from the voltage sensor read by the microcontroller (Pin-5 of the Arduino microcontroller). The output of PV module, i.e. PV power is used to control the position of motor servo. This position corresponds to the current limit of the adjustable power supply. From the experiment, it is obtained that the servo position (in degree) is given by multiplying the PV power (in Watt) by 2.2.
Fig. 4. The Complete Simulink model of PV Generator.
B. Adjustable Power Supply
The block diagram of adjustable power supply interfaced to the microcontroller is illustrated in Fig. 5. It employs the low cost IC LM723 as the main component for adjusting the voltage and current of the power supply. The potentiometer for current adjustment is coupled by a servo motor which is controlled by the microcontroller.
Since the LM723 provides a small current, the current booster is required to generate the higher output current about 5 Ampere. The servo motor is attached to the potentiometer so it will rotate the potentiometer from the minimum position to the maximum position, where the minimum position corresponds to the servo position of 00 and the maximum position corresponds to the servo position of 1800. Fig. 6 illustrates the picture of the adjustable power supply.
Fig. 5. Block diagram of the adjustable power supply.
Fig. 6. Picture of the adjustable power supply controlled by the servo motor.
IV. EXPERIMENTAL RESULTS
Several experiments are conducted to verify the proposed simulator. In the experiments, the PV Generator (Simulink + adjustable power supply) is connected to the AC load using DC/AC power inverter. The objective of experiments is to verify that the power delivered by the adjustable power supply should not exceed the power limit determined by the solar irradiation condition. Two scenarios are examined during the experiments. In the first scenario, the solar irradiation is fixed, while the load power is varied over the time. In the second scenario, the load power is fixed, while the solar irradiation is varied over the time.
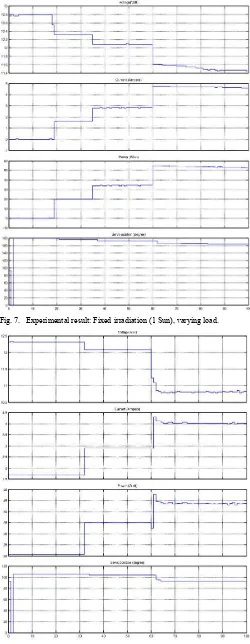
The experimental results of the first scenario are illustrated in Fig. 7 and Fig. 8. In each figure, the output voltage, the output current, the output power, and the servo position are shown in the first, second, third and fourth rows respectively.
Fig. 7 shows the result when the solar irradiation is 1 Sun (1000 Watt/m2) and the load (the incandescent lamp) varies from 0 Watt, 20 Watt, 35 Watt, and 55 Watt. From the figure, it is obtained that the output power follows the load power accordingly. It means that when the solar irradiation is 1 Sun, the maximum power delivered by the PV module is greater than 55 Watt.
Fig. 8 shows the result when the solar irradiation is 0.6 Sun and the load varies from 20 Watt, 35 Watt, and 55 Watt. By observing the figure, when the load power is 20 Watt or 35 Watt, the output power of the simulator follows the load. However, when the load power is 55 Watt, the output power of the simulator is only 44 Watt, i.e. the maximum output power could be delivered by the PV generator under the solar
Adjustable power supply
Potentiometer
irradiation of 0.6 Sun. It refers to the overload condition, where the load power is greater than the maximum output power could be delivered by the PV.
From the above results, it is concluded that the maximum output power of PV simulator varies according to the solar irradiation. When the load power is lower than the maximum power, the output power of PV simulator follows the load power. When the load power is greater than the maximum power, the output power of PV simulator is the maximum output power for a particular irradiation condition.
It is also observed that the output voltage drops about 0.7 Volt (12.3 Volt – 11.6 Volt) when the load power changes from 20 Watt to 55 Watt. Since the solar irradiation is fixed, the servo position is also fixed. The small deviation is caused by the voltage drop.
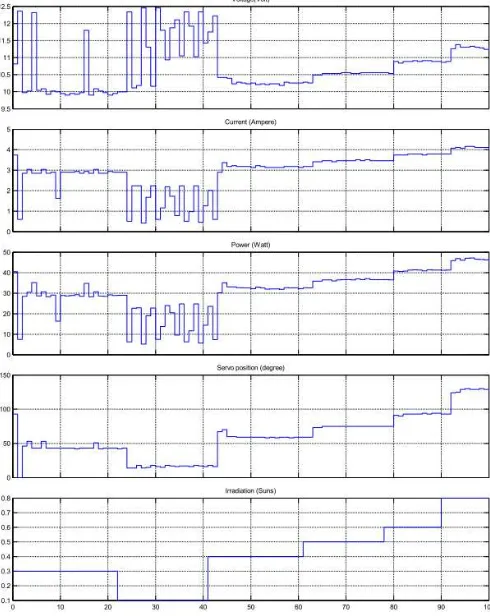
The experimental results of the second scenario are illustrated in Fig. 9 and Fig. 10. In each figure, the output voltage, the output current, the output power, the servo position, and the solar irradiation are shown in the first, second, third, fourth, and fifth rows respectively.
Fig. 9 shows the result when the load power is 35 Watt, while the solar irradiation varies from 0.3 Sun, 0.1 Sun, 0.4 Sun, and 0.5 Sun. Observing the figure, it is obtained that when the solar irradiation is 0.5 Sun, the maximum output power is 32 Watt. It follows with the previous experiment, where the output power of 35 Watt could be achieved when the solar irradiation is 0.6 Sun.
Fig. 10 shows the result when the load power is 55 Watt, while the solar irradiation varies from 0.3 Sun, 0.1 Sun, 0.4 Sun, 0.5 Sun, 0.6 Sun, 0.8 Sun. It is noted from the figure that when the solar irradiation is 0.1 Sun, the output fluctuates. It is observed from the experiment that during this time the lamp is flickering. This condition is caused by too much overload, i.e. the maximum output power of PV generator is only 20 Watt, while the load power is 55 Watt.
It is also observed that the output voltage drops about 1.5 Volt (12.3 Volt – 10.8) Volt when the load power changes from 20 Watt to 55 Watt. Compared to the previous result, the value of voltage drop is an important parameter, which could be used to determine the overload condition.
V. CONCLUSIONS
The PV simulator consists of the simulation software interfaced to the adjustable power supply is presented. The output of the simulator is the DC power connected to the electrical load. The PV simulator is tested under varying load power and solar irradiation with a proper result. It behaves like the real PV system connected to the real electrical load.
In future, the system for higher output power will be developed. Futher the integration with the other electrical power systems will be conducted.
Fig. 7. Experimental result: Fixed irradiation (1 Sun), varying load.
Fig. 9. Experimental result: Fixed load (35 Watt), varying irradiation.
Acknowledgment
This work is supported by the Research Grant 2015 “Excellent Recearch on Higher Institution” from Directorate General of Higher Education, Ministry of Research and Technoloy and Higher Education, Republic of Indonesia (No. : SP DIPA-023.04.1.672453/2015)
References
[1] G.R. Walker, “Evaluating MPPT Converter Topologies Using A MATLAB PV Model,” Journal of Electrical & Electronics Engineering,Vol. 21, No. 1, pp. 49-56, 2001.
[2] Krismadinata, N.A. Rahim, H.W. Ping, and J. Selvaraj, “Photovoltaic Module Modeling Using Simulink/MATLAB,” Procedia Environmental Sciences, Vol. 7, pp. 537-546, 2013.
[3] H. Bellia, R. Youcef, and M. Fatima, “A Detailed Modeling of Photovoltaic Module Using MATLAB,” NRIAG Journal of Astronomy and Geophysics, Vol. 3, pp. 53-61, 2014.
[4] J. Park, H. Kim, Y. Cho, and C. Shin, “Simple Modeling and Simulation of Photovoltaic Panels Using Matlab/Simulink,” Advanced Science and Technology Letters, Vol. 73, pp. 147-155, 2014.
[5] R. Ayaz, I. Nakir, and M. Tanrioven, “An Improved Matlab-Simulink Model of PV Module considering Ambient Conditions,” International Journal of Photoenergy, Vol. 2014, Article ID 315893.
[6] M. A.R. Sarker, Y. Ueno, C.H.K. Chu, and K. Nagasaka, “Incorporating Renewable Energy Resources in a Smart Grid with Power Line Communication Using Matlab/Simulink,” Journal of Advanced Computational Intelligence and Intelligent Informatics, Vol. 17 No. 1, pp. 103-108, 2013.
[7] A. Soetedjo, A. Lomi, Y.I. Nakhoda, A.U. Krismanto, “Modeling of Maximum Power Tracking Controller for Solar System,” TELKOMNIKA, Vol. 10, No. 3, pp. 419-430, 2012.
[8] E. Koutroulis, K. Kalaitzakis, V. Tzitzilonis, “Development of an FPGA-based system for real-time simulation of photovoltaic modules,” Microelectronics Journal, Vol. 40, Issue 7, pp. 1094-1102, 2009. [9] Z. Yuan, “PV Array Simulator Design Based on S3C2440,”
International Journal of Automation and Power Engineering, Vol. 2, Issue 4, pp. 221-225, 2013.
[10] C.H. Balaishan, and N. Sandeep, “Development of a Microcontroller Based PV Emulator with Current Controlled DC-DC Buck Converter,” International Journal of Renewable Energy Research, Vol. 4, No. 4, pp. 1049-1055, 2014.
[11] MATLAB Support for Arduino (aka ArduinoIO Package): http://www.mathworks.com/matlabcentral/fileexchange/32374-legacy-matlab-and-simulink-support-for-arduino
![Fig. 2. The equivalent circuit of PV model [1].](https://thumb-ap.123doks.com/thumbv2/123dok/263943.506032/2.595.310.557.577.687/fig-equivalent-circuit-pv-model.webp)