21
The Impact of Fair Performance Appraisal to Employee Motivation and
Satisfaction towards Performance Appraisal
–
A Case of PT. XYZ.
Christian Jonathan Cowandy
International Business Management Program, Petra Christian University Jl. Siwalankerto 121-131, Surabaya
E-mail: [email protected]
ABSTRACT
This research is conducted to find out employees’ perception about their performance appraisal system at PT. XYZ. The perception will be about how fair is the performance appraisal system of PT. XYZ, and how it can affect the employees’ motivation and their satisfaction towards the performance appraisal system itself.
This research is conducted in PT. XYZ’s headquarter in Surabaya by distributing questionnaire to 80 employees of PT. XYZ from various different functions in the company. The data was analyzed using Multiple Linear Regression Analysis. The results shows that fair performance appraisal have significant impact on employees’ motivation to improve performance and satisfaction towards performance appraisal. Individually, all factors of fair performance appraisal have significant impact to employee’s motivation, but for satisfaction towards performance appraisal, only procedure fairness has significant impact to satisfaction towards performance appraisal.
Keywords: Human Resources, Motivation, Employee’s Motivation, Satisfaction towards Performance Appraisal, Performance Appraisal
ABSTRAK
Penelitian ini dilakukan untuk mengetahui persepsi karyawan terhadap sistem penilaian kinerja di PT. XYZ. Persepsi yang dimaksud adalah mengenai keadilan sistem penilaian kinerja PT. XYZ, dan bagaimana hal itu berdampak kepada motivasi dan kepuasan karyawan terhadap sistem penilaian kinerja tersebut.
Penelitian ini dilakukan di kantor pusat PT. XYZ di Surabaya dengan cara menyebarkan kuesioner kepada 80 karyawan di segala departemen PT. XYZ. Data yang ada dianalisa menggunakan Multiple Linear Regression Analysis. Hasil menunjukkan bahwa penilaian kinerja yang adil memberikan dampak signifikan terhadap motivasi serta kepuasan karyawan terhadap sistem penilaian kinerja. Saat dianalisa secara individu, semua faktor penilaian kinerja yang adil mempunyai dampak signifikan kepada motivasi kerja, tetapi hanya keadilan prosedur yang mempunyai dampak signifikan terhadap kepuasan penilaian kinerja.
Kata Kunci: Sumber Daya Manusia, Motivasi, Motivasi Karyawan, Kepuasan terhadap
Penilaian Kinerja, Penilaian Kinerja.
INTRODUCTION
Performance appraisal or evaluation is considered as the essential part of human capital development, which is in turn an essential part of any company’s performance in the world. Some of the positive results of performance appraisals are providing encouragement to employees to perform better in the future, identify the strength and weakness of the employees, provides a more open communication between supervisor or managers to the employee, and many more (Benefits, 2012, para. 3) . The
22 Rupp, Mohler, & Schminke (2001), a fair performance appraisal and treatment will provide as a motivation foundation for employees to improve in the future, while according to McFarlin and Sweeney (1992) a fair performance appraisal system will yield influence to satisfaction towards performance appraisal. Thus this research will examine the impact of performance appraisal on the employee motivation to improve and satisfaction towards performance appraisal.
Importance of the Research
In order to solidify its position, PT. XYZ turns to both external and internal sources. For external, they continue to sought out talented people outside of the company to recruit, whilst for internal, they continue to develop their own employees. In order to make sure that PT. XYZ is able to sustain and grow itself in the future, they need the right strategy and to execute the strategy, they need their employees to be motivated to improve their performance and satisfied with the performance appraisal of the company. One of the ways to make sure that the employees are motivated to improve and are satisfied with the performance appraisal is to ensure that they are able to get a fair performance appraisal for their performance. Thus, it is important for PT. XYZ to conduct fair performance appraisal on their employees, which does not only measure the current performance of their employees, but also finding out the appropriate training required, which areas the employees are still lacking, and even considerations of promotion and pay rise, which is determined by the performance appraisal.
Statement of Research Problem
1. Does Fair Performance Appraisal system have a significant impact with the motivation to improve the performance of the employees at PT. XYZ?
2. Does Fair Performance Appraisal system have a significant impact with the satisfaction towards performance appraisal of the employees at PT. XYZ?
LITERATURE REVIEW
The concepts & definitions are the concepts that are related to this research, and how it can help defining the research problem. The concepts & definitions stated here will describe the theories related to Fairness of Performance Appraisal, Motivation, and Satisfaction towards Performance Appraisal.
Fairness of Performance Appraisal
Performance appraisal is a concept of human resources which is used in order to measure or evaluate an employee’s job performance on a regular basis, which actually depends entirely on schedules by the company. Performance appraisal is also the process of measuring employees’ performance, through which an organization is able to acquire information regarding how an employee is performing within the company or how they are doing in their job (Noe et al, 2010). Performance appraisal is
generally conducted by the Human Resource Management department. Performance appraisal does not only serve as a way to measure an employee’s performance in the workplace based on preset standards that the company has in place in the first place. Performance appraisal also allows to identify which area in his/her performance that is lacking, and the HR department will be able to recommend possible improvements or training necessary to the direct supervisor of the employee that is appraised or evaluated.
Fairness of Performance Appraisal is another concept within performance appraisal. According to Taylor et al, (1995), the employee’s perception regarding the fairness of the performance appraisal is considered as another significant criterion that is related to the results of the appraisal. This defines that in order to make sure that any performance appraisal’s result is valid, free from bias, as well as useful, it is important to make sure that the employee believes that they will receive a fair performance appraisal from their superiors. To make sure that an employee believe that their performance appraisal is fair, there are three areas that is needed to be make sure of so that the performance appraisal is seen as fair. Colquitt et al, (2001) describe there are three parts that are needed to measure performance appraisal’s fairness, which are distribution fairness, procedure fairness, and interaction fairness. Greenberg (1986) states that distribution fairness is about how fair the results’ distribution is. The results distribution itself, according to Colquitt et al, (2001), is that distributive fairness is the opinion of the employees about the fairness of the results of the performance appraisal and whether it reflects to the work completed, the efforts of the work, the contribution of the employee, and the recent performance of the employee. Procedure fairness is about how fair the procedure in the process of the performance appraisal is (Folger, Knovsky, & Cropanzano, 1992). It can be described as the employee’s perception regarding the fairness about how the performance appraisal is conducted. Colquitt et al (2001) adds that the procedure fairness is the measure of the perception regarding the performance appraisal’s consistency, bias, accuracy, ethic, and the employee’s ability to influence and expressing their views during the performance appraisal as well as ability to appeal to the result of the performance appraisal. Lastly, interaction fairness is about how the interaction between the appraiser and the one appraised during the process of performance appraisal (Bies, 2001). This can be described as how the employee sees how their rater is talking to them, whether supportive or not, etc. Colquitt et al, (2001) adds that the measure for interaction fairness is how the employee is treated during the performance appraisal process, whether they are treated in polite manner, with dignity, or respected, as well as the appraiser refrained from using improper remarks during the process.
Employee Motivation
23 working in the company (Jones & George, 2008). What this means is that motivation is one of the factors that can enhance the work performance of an employee. Kreitner (1995) define motivation as the drive of the people’s psychological state that moves their behavior and direction. When an employee are lacking in motivation in their work, they will not only be unproductive, but they will be discouraged and does not participate completely in their work.
The motivation that is going to be analyzed here is the motivation of the employees to improve after the appraisal process. It is defined as the employees’ personal want to improve their work and performance after they received their feedback and utilized the results to help them improve (Ilgen, et al, 1979). Meanwhile, it can also be defined as the motivations for future improvements of the employee are based on the results of their performance appraisal system (Roberson & Stewart, 2006).
Satisfaction towards Performance Appraisal
Appraisal satisfaction here is stated as the employee’s feeling towards the current process of the performance appraisal system utilized by the company. It is regarded as the important factor that measures the reactions of the employees to the appraisal system and feedback (Giles and Mossholder, 1990).The satisfaction that is measured here will deal with how the employee perceived their performance appraisal system, and their satisfaction towards the performance appraisal system employed within the company. Keeping and Levy (2000) describes that in order to measure the performance appraisal, it usually focuses one of the three components of the appraisal system;
• The process • The interview • The outcome
Brown et al (2010) state that it is not actually focusing on just one of the components, but more to the combination of the three to determine the satisfaction of the employee to the performance appraisal process. This measure is what will be used on this research by the writer later on.
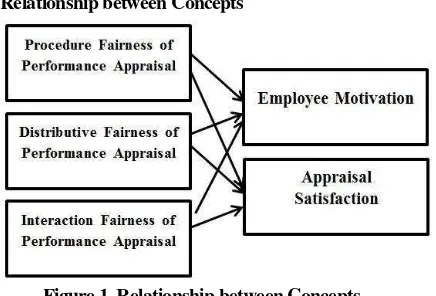
Relationship between Concepts
Figure 1. Relationship between Concepts
The impact of fair performance appraisal on employee’s motivation can be determined through the fairness of the performance appraisal. As been said before,
Colquitt (2001) said that to determine the Fairness of Performance Appraisal is distribution fairness, procedure fairness, and interaction fairness. Meanwhile, it can influence employee motivation to improve the performance through the fairness of the results of the performance appraisal.
The impact of fair performance appraisal on satisfaction of employees to the performance appraisal can be decided through the components of the fair performance appraisal itself. As been mentioned before, Colquitt (2001) described that the Fairness of Performance Appraisal is distribution fairness, procedure fairness, and interaction fairness. This will later influence the employee’s satisfaction on the performance appraisal when they see the performance appraisal system’s fairness implemented.
Based on the literature reviews before, the following hypotheses are formulated:
• H1: Distribution Fairness, Procedure Fairness, and Interaction Fairness has an impact to employee’s motivation
• H2: Distribution Fairness, Procedure Fairness, and Interaction Fairness has an impact to satisfaction towards performance appraisal
• H3: Distribution Fairness of Performance Appraisal has an impact to employee’s motivation
• H4: Procedure Fairness of Performance Appraisal has an impact to employee’s motivation
• H5: Interaction Fairness of Performance Appraisal has an impact to employee’s motivation
• H6: Distribution Fairness of Performance Appraisal has an impact to satisfaction towards performance appraisal
• H7: Procedure Fairness of Performance Appraisal has an impact to satisfaction towards performance appraisal
• H8: Interaction Fairness of Performance Appraisal has an impact to satisfaction towards performance appraisal
RESEARCH METHOD
The purpose of this research is to find out whether fair performance appraisal has any impact with the motivation as well as satisfaction towards performance appraisal of the employee of PT. XYZ. The research method that is chosen by the writer is the causal-explanatory study, because through causal-explanatory study, the writer will be able to find out the impact of the variables stated through the answers provided by the respondents regarding the purpose of the research, as well as to create a connection between the variables.
24 to measure the fairness of the performance appraisal which are; distributive fairness, procedure fairness, and interaction fairness. Distributive fairness will have four elements; procedure fairness will have seven elements; while interaction fairness will have four elements. All of the elements of fairness of performance appraisal are courtesy of the research by Colquitt et al (2001). Employee Motivation will look to motivation of emplyoees to improve after the appraisal process, and there are four elements to measure it. Satisfaction towards performance appraisal is how satisfied the employees are to the appraisal system and it has six elements. The elements for satisfaction towards performance appraisal are part of the scale by Cook and Crossman (2004).
The data needed for this research will be demographic data of the samples as well as the data that is related to the fairness of performance appraisal as well as employee motivation and satisfaction towards performance appraisal. The type of data used for this research will be nominal, ordinal, and interval. The nominal and ordinal will be used for the demographic questions, while the interval used is for the main part of the questionnaire and it is in a 5-point data, it is important to test whether the indicators are valid and reliable or not. Cooper & Schindler (2011) describes validity as “The extent to which a test measures what we actually wish to measure” (Cooper & Schindler, 2011, p.280). Ghozali (2011) describes that validity test are conducted through comparing two different sets of r value. The r-values compared are the r-table and the r-values from questionnaires (r-data of the variables) through the Correlated Item- Total Correlation column. The value from the column must be greater than the value of the r-table which is acquired through using the degree of freedom (df): n – 2 (n is sample number).
Reliability, according to Cooper & Schindler (2011), is about how the measurement procedure is accurate and precise enough. They then continue that reliability is about how the measurement stay stable can and is free from random errors. Ghozali (2011) state that there are two ways to measure reliability, which is through repeated measure and one shot measure. Repeated measure is the method in which the same respondent will be questioned by the researcher on a different time-frame and it will be measured based on the consistency of the answers. One shot measure is a measurement when the respondent is asked only once, and the answers are compared to other questions to measure the correlation between answers. SPSS’s reliability analysis will be used to measure the Cronbach Alpha, in which the variable will be deemed as reliable when it scored equal to or higher than 0.70. The closer the alpha to 1.00, it is more reliable (Nunnally in Ghozali, 2011).
To measure the impact of fair performance appraisal to employee motivation and satisfaction of performance appraisal, this study utilizes the multiple linear regression
analysis. Cooper & Schindler (2011) defined that multiple regression is when more than one independent variable or x values are used to predict the results of the y values. The equations are as follows:
For Fairness of Performance Appraisal to Employee Motivation;
Y1= β0+β1X1+β2X2+β3X3 Which:
Y1 = the dependent variable measured (Employee Motivation)
β0 = the constant value (when X equals to zero) β = the slope of the line
X1 = the independent variable (Procedural Justice) X2 = the independent variable (Distributive Justice) X3 = the independent variable (Interaction Justice)
For Fairness of Performance Appraisal to Satisfaction towards Performance Appraisal
Y2= β0+β1X1+β2X2+β3X3 Which:
Y2 = the dependent variable measured (Satisfaction towards Performance Appraisal)
β0 = the constant value (when X equals to zero) β = the slope of the line
X1 = the independent variable (Procedural Justice) X2 = the independent variable (Distributive Justice) X3 = the independent variable (Interaction Justice)
Pallant (2005) described adjusted R2 as a better estimate of the population’s value. Pallant later adds that the adjusted R2 is better used if the sample number is small. This test is aimed to find out how much of the variance of the dependent variable can be explained by the independent variables used in the regression model. Also, the closer the adjusted R2 is to 1, the better the model will be.
F-test is used in the multiple regression equation to determine the influence of the overall independent variables to the dependent variable tested (Ghozali, 2011). To determine whether or not the independent variables simultaneously have significant impact to the dependent variable, it is required to test the value to the significance level and this research will use a 5% significance level.
If the significance level is lower than 5% (0.05), the H0 will be rejected. If H0 is rejected, it means that the independent variables simultaneously have significant influence on the dependent variable.
25
RESULTS AND DISCUSSION
Table 1. Validity Statistic of Motivation
Variable Corrected Item – Total
Correlation Information
Support Company 0.838 Passed
Work Maximally 0.858 Passed
Improve Performance 0.815 Passed
Fix 0.732 Passed
Table 2. Validity Statistic of Satisfaction
Variable Corrected Item – Total
Correlation Information
Procedure 0.795 Passed
Interview 0.722 Passed
Result 0.739 Passed
Fairness 0.747 Passed
Commitment 0.755 Passed
Feedback 0.683 Passed
Table 3. Validity Statistic of Distribution Fairness
Variable Corrected Item – Total
Correlation Information
Efforts 0.802 Passed
Work 0.814 Passed
Contribution 0.840 Passed
Justified 0.792 Passed
Table 5. Validity Statistic of Procedure Fairness
Variable Corrected Item – Total
Correlation Information
Express Views 0.662 Passed
Consistency 0.716 Passed
Biasity 0.750 Passed
Information 0.783 Passed
Influence 0.737 Passed
Appeal 0.763 Passed
Ethic 0.606 Passed
Table 5. Validity Statistic of Interaction Fairness
Variable Corrected Item – Total
Correlation Information
Politeness 0.676 Passed
Dignity 0.706 Passed
Respect 0.835 Passed
Improper Remarks 0.597 Passed
To test the validity of the data, the r-value acquired from the questionnaire results (r-data) will be compared with the r-value of the table (r-table), with the degree of freedom (df) n-2. This research distributed 90 questionnaires and 80 are acquired back, therefore the degree of freedom will be 78. Based on the table, the r-value from the table is 0.220. This r-value will be compared to the result of the r-data, which can be seen on the Corrected Item – Total Correlation. Based on table 1, 2, 3, 4, and 5, shows that all indicators used in this research are valid, as they all are higher than 0.220.
Table 6. Reliability Statistic
Variable Cronbach’s Alpha Information
Motivation 0.917 Passed
Satisfaction 0.906 Passed
Distribution (X1) 0.918 Passed
Procedure (X2) 0.904 Passed
Interaction (X3) 0.853 Passed
For the data to be considered as reliable, it requires the value of Cronbach’s Alpha of each variable must be higher than 0.7 (Nunnally in Ghozali, 2011). Based on the results of table 6 shows that all of the Cronbach’s Alpha are higher than the required 0.7, making the all the data as reliable.
Table 7. ANOVA Table
Variable Significance Level Information
Motivation 0.000 Significant
Satisfaction 0.000 Significant
Both Motivation and Satisfaction Regression Model shows the significance value of 0.000, see table 7, which is lower than the significance level of 0.05. The conclusion that can be reached is that the null hypotheses (H1 and H2) is rejected and the alternative hypotheses are accepted, and that the independent variables used for this research (Distribution Fairness, Procedure Fairness, and Interaction Fairness) simultaneously have significant impact to Employee’s Motivation and the Satisfaction towards Performance Appraisal.
Table 8. Regression Coefficient Table to Motivation
Variable Standardized Coefficients t-value Significance
Level Information
Constant 1.376 0.173 Significant
Distribution
Fairness (X1) 0.385 4.148 0.000 Significant
Procedure
Fairness (X2) 0.277 2.703 0.008 Significant
Interaction
Fairness(X3) 0.207 2.065 0.042 Significant
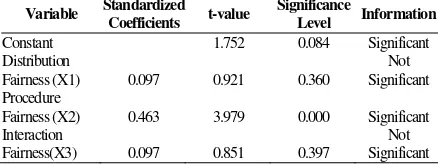
Table 9. Regression Coefficient Table to Satisfaction
Variable Standardized Coefficients t-value Significance
Level Information
Constant 1.752 0.084 Significant
Distribution
Fairness (X1) 0.097 0.921 0.360
Not Significant Procedure
Fairness (X2) 0.463 3.979 0.000 Significant
Interaction significance level of 0.05, while in the Satisfaction model, the significance value of distribution fairness is 0.360, higher than the significance level of 0.05. For the Distribution Fairness to the Motivation model, the null hypothesis can be rejected, while for Distribution Fairness to the Satisfaction model, the null hypothesis is failed to be rejected. The conclusion is that Distribution Fairness has significant impact to creating Employee’s Motivation individually. However, according to the results, individually, Distribution Fairness does not have significant impact to Satisfaction towards Performance Appraisal.
26 Procedure Fairness individually has significant impact to Employee’s Motivation as well as significant impact to Satisfaction towards Performance Appraisal. The result of the statistical tests proves that the null hypotheses for Procedure Fairness for both Employee’s Motivation and Satisfaction towards Performance Appraisal can be rejected. Interaction Fairness’s significance level to Motivation is 0.042 while to Satisfaction, the significance level is 0.397. Thus, it can be deduced that Individually Interaction Fairness has significant impact to Employee’s Motivation. Interaction Fairness however does not have a significant impact to Satisfaction towards Performance Appraisal individually. The null hypothesis can be rejected for Interaction Fairness to Employee Motivation, but the null hypothesis for Interaction Fairness to Satisfaction towards Performance Appraisal is failed to be rejected.
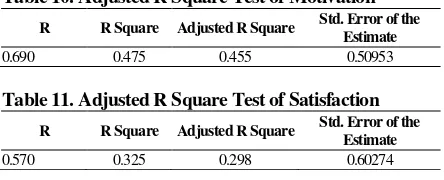
Table 10. Adjusted R Square Test of Motivation
R R Square Adjusted R Square Std. Error of the Estimate
0.690 0.475 0.455 0.50953
Table 11. Adjusted R Square Test of Satisfaction
R R Square Adjusted R Square Std. Error of the Estimate
0.570 0.325 0.298 0.60274
Motivation’s adjusted R2 shows value of 0.455, which means that 45.5% of the variances in Employee’s Motivation can be explained by the independent variables of Distribution Fairness, Procedure Fairness, and Interaction Fairness.
Satisfaction’s adjusted R2 shows the value of 0.298, which means that 29.8% of the variances in Satisfaction towards Performance Appraisal can be explained by the independent variables of Distribution Fairness, Procedure Fairness, and Interaction Fairness.
CONCLUSION
The results shows that this research has successfully reached its objectives which is finding out that fairness in performance appraisal gives a significant impact towards employees’ motivation and satisfaction towards the performance appraisal system.
The limitations of this research are the number of the samples and the attitude of the samples itself. The samples currently are only 80 out of 90, and that it does not come from all the departments of PT. XYZ due to bureaucracy restrictions by the company itself. The attitude is also the problem because some emplyoees did not answer objectively, but rather biasly because of the poor opinion of the employees to the performance appraisal system of the company.
Suggestion for further research would have to be increasing the scope of the research, which is to not only limit the scope to one company but also other companies to gain more insight about how employees feel about the fairness of their performance appraisal system. The second suggestion is to enlarge the sample scope of PT. XYZ. Currently the scope of this research is only in the
headquarters of PT. XYZ, for future research, it is better to include the branches and subsidiaries of the company as well. The third suggestion is to increase the sample numbers to 100, because at the headquarters of PT. XYZ, the total population of samples is 300, so increasing the number of respondents to 100 will better represent the total population’s opinion.
REFERENCES
Aguinis, H., Gottfredson, R.K., & Joo, H. (2012). Delivering effective performance feedback: The strengths-based approach. Business Horizons, 55, 105-111. Retrieved April 10, 2014, from http://www.researchgate.net/publication/251550792_D elivering_effective_performance_feedback_The_stren gths-based_approach/file/5046351f43a56c2f3b.pdf. Ali, S.B., Mahdi, A., & Malihe, J. (2012). The effect of
employees’ performance appraisal procedure on their intrinsic motivation, The International Journal of Academic Research in Business and Social Sciences, Vol. 2, No. 12. Retrieved March 5, 2014, from http://www.hrmars.com/admin/pics/1369.pdf.
Benefits, A. (2012, September 20). Understanding the importance of performance appraisals. Atessabenefits.com. Retrieved February 26, 2014, from http://www.atessabenefits.com/atessa- blog/understanding-the-importance-of-performance-appraisals/
Bies, R.J. (2001), Interactional (In)justice: The Sacred and the Profane, Advances in Organizational Justice, eds. J. Greenberg and R. Cropanzano, Stanford, CA: Stanford University Press, pp. 89–118.
performance appraisal on motivation and job satisfaction in banking sector of Pakistan, Journal of Basic and Applied Scientific Research, 4(2),16-20.
Retrieved March 5, 2014, from
http://www.textroad.com/pdf/JBASR/J.Basic.Appl.Sci. Res.,204(2)16-20, 2014.pdf
Brown, M., Hyatt, D., & Benson, J. (2010). Consequences of the performance appraisal experience, Personnel Review, Vol. 39 (ed. 3), pp. 375-396.
Colquitt, J.A. (2001), On the Dimensionality of Organizational Justice: A Construct Validation of a Measure, Journal of Applied Psychology, Vol. 86, pp. 386-400.
Colquitt, J.A., Conlon, D.E., Wesson, M.J., Porter, C.O.L.H., and Ng, K.Y. (2001), Justice at the Millennium: A Meta-Analytic Review of 25 Years of Organizational Justice Research, Journal of Applied Psychology, Vol 86 (3) pp. 425-445.
27 Cooper, D.R. & Schindler, P.S. (2011). Business research
methods (10th ed.). New York: McGraw Hill.
Cropanzano, R., Rupp, D.E., Mohler, C.J., & Schminke, M. (2001), Three Roads to Organizational Justice, in (ed.) 20, Research in Personnel and Human Resources Management, (Vol. 20), Emerald Group Publishing Limited pp. 1–113.
Folger, R., Konovsky, M.A., & Cropanzano, R. (1992), A Due Process Metaphor for Performance Appraisal, Research in Organizational Behavior (Vol. 13), eds. B.M. Staw & L.L. Cummings, Greenwich, CT: JAI Press, pp. 129–177.
Garson, D. (2012). Testing Statistical Assumptions. Statistical Publishing Associates. Retrieved March 30,
2014, from
www.statisticalassociates.com/assumptions.pdf Ghozali, I. (2011). Aplikasi Analisis Multivariate dengan
Program IBM SPSS 19 Edisi 5. Semarang: Badan Penerbit Universitas Diponegoro
Giles, W.F., and Mossholder, K.W. (1990), Employee Reactions to Contextual and Session Components of Performance Appraisal, Journal of Applied Psychology, Vol. 75 (ed. 4) pp. 371-377.
Goff, S.J. & Longenecker, C.O. (1990), Why performance appraisals still fail, Journal of Compensation and Benefits, November/December, pp. 36-41.
Greenberg, J. (1986), The Distributive Justice of Organizational Performance Evaluations, Justice in Social Relations, eds. H.W. Bierhoff, R.L. Cohen & J. Greenberg, New York:Plenum Press, pp. 337–351. Green, S.B. (1991). How many subjects does it take to do a
regression analysis? Multivariate Behavioral Research, 26 (3) pp. 499-510. Retrieved March 17, 2014, from https://research.son.wisc.edu/rdsu/Green1991.pdf Gregory, K. (2011) The importance of employee
satisfaction, The Journal of the Division of Business & Information Management. Retrieved March 5, 2014, from
http://www.neumann.edu/academics/divisions/busines s/journal/Review2011/Gregory.pdf
Heathfield, S.M. (n.d.).Why Organizations Do Employee Performance Evaluation? Human Resource. Retrieved
February 26, 2014, from Consequences of Individual Feedback on Behavior in Organizations, Journal of Applied Psychology, (Vol. 64), pp. 349–371.
Jones, G.R., George, J.M., Contemporary Management (6th ed.). New York: McGraw Hill.
Karimi, R., Malik, M.I., Hussain, S. (2011), Examining the relationship of performance appraisal system and employee satisfaction, International Journal of Business and Social Science, Vol. 2, no.22. Retrieved
March 12, 2014, from
http://ijbssnet.com/journals/Vol_2_No_22_December_ 2011/28.pdf.
Keeping, L.M., and Levy, P.E. (2000), Performance Appraisal Reactions: Measurement, Modeling, and Method Bias, Journal of Applied Psychology, Vol. 85, no. 5, pp. 708-723.
Kreitner, R. (1995). Management (6th ed.). Boston: Houghton Mifflin Company.
Kuvaas, B. (2007) Different relationships between perceptions of developmental performance appraisal and work performance, Personnel Review, Vol. 36 (pp. 378-397).
McFarlin, D.B., & Sweeney, P.D. (1992), Distributive and Procedural Justice as Predictors of Satisfaction with Personal and Organizational Outcomes. Academy of Management Journal, 35, 626–637.
Noe, R.A., Hollenbeck, J.R., Gerhart, B., Wright, P.M. (2010). Human Resource Management (7th ed.). New York: McGraw Hill.
Pallant, J. (2005). SPSS survival manual: A step by step guide to data analysis using SPSS for windows (version 12). Australia: Allen & Unwin.
Roberson, Q.M., & Stewart, M.M. (2006), Understanding the Motivational Effects of Procedural and Informational Justice in Feedback Processes, British Journal of Psychology, Vol. 97 (ed. 3), pp. 281–298. Sekaran, U. (2003). Research method for business: A
skill-building approach (4th ed.). New York: John Wiley & Sons, Inc.
Selvarajan, T.T., & Cloninger, P.A. (2011), Can performance appraisals motivate employees to improve performance? A Mexican study, The International Journal of Human Resource Management, DOI: 10.1080/09585192.2011.637069. Retrieved March 11, 2014, from: http://www2.uhv.edu/cloningerp/Publications/APUBL ISHEDCOPYPERFAPPINMEXICOIJHRM.pdf Taylor, M., Tracy, K.B., Renard, M.K., Harrison, J., &
Carroll, S.J. (1995), Due Process in Performance Appraisal: A Quasi-Experiment in Procedural Justice, Administrative Science Quarterly, Vol 40(3) pp. 495-523.
Williams, K.J., DeNisi, A.S., Blencoe, A.G., & Cafferty, T.P. (1985), The Role of Appraisal Purposes: Effects of Purpose on Information Acquisition and Utilization, Organizational Behavior and Human Resource Decision Processes, 35, 314–339.