Climate Change Adaptation Series: Document 5
RAPID ASSESSMENT OF SHORELINE
CHARACTERISTICS AND DYNAMICS OF LAZY
LAGOON AT MLINGOTINI VILLAGE, BAGAMOYO
Prepared by:
Dr. Y.W. Shaghude
Institute for Marine Studies
University of Dar Es Salaam
For the Coastal Resources Center, University of Rhode Island
This report is part of the Pwani Project’s Coastal Community Adaptation Series, which includes the following documents:
1. Coastal and Marine Ecosystems in a Changing Climate: the Case of Tanzania.
2. Workshop Proceedings: Tanzania Coastal Climate Change National Adaptation Planning Workshop
3. Village Vulnerability Assessments and Climate Change Adaptation Planning (V & A): Kitonga, Bagamoyo District
4. Village Vulnerability Assessments and Climate Change Adaptation Planning (V & A): Mlingotini, Bagamoyo District
5. Rapid Assessment of Shoreline Characteristics and Dynamics of the Lazy Lagoon at Mlingotini Village, Bagamoyo
6. Livelihoods, Climate and Non-Climate Threats and Adaptation: Pangani District Coastal Villages
7. Livelihoods, Climate and Non-Climate Threats and Adaptation: Bagamoyo District Coastal Villages
8. Village Vulnerability Assessments and Climate Change Adaptation Planning (V & A): Jambiani and Paje, Zanzibar
9. Village Vulnerability Assessments and Climate Change Adaptation Planning (V & A): Kitonga and Mlingotini Villages, Bagamoyo District (Summary Report)
10.Village Vulnerability Assessments and Climate Change Adaptation Planning (V & A): Mwembeni, Pangani District
11.Village Vulnerability Assessments and Climate Change Adaptation Planning (V & A): Sange, Pangani District
This publication is available electronically on the Coastal Resources Center’s website
at http://www.crc.uri.edu. For more information contact: Coastal Resources Center, University of Rhode Island, Narragansett Bay Campus, South Ferry Road, Narragansett, Rhode Island 02882, USA. Tel: (401) 874-6224; Fax: (401) 874-6920.
Citation: Shagude, Y.W. (2011). Rapid Assessment of Shoreline Characteristics and Dynamics of the Lazy Lagoon at Mlingotini Village, Bagamoyo. Coastal Resources Center Coastal Resources Center, University of Rhode Island, Narragansett, RI, 38 pp.
Disclaimer: This report is made possible by the generous support of the American people
ACKNOWLEDGEMENTS
The field operations for the present study were conducted with the support of the scientific team from the Tanzania Coastal Management Partnership (TCMP), namely Mr Jairos Mahenge, Ms Alieth Mutatina, Mr Jumanne Mohammed (J4), together with Mr Ambakisye Simtowe from Mbegani Fisheries Training Centre. Their contribution towards the success of the field
operations is highly acknowledged. In this list, I also wish to thank the TCMP drivers as well as the boat “Captain” from Mbegani Fishing Training Centre who cooperated well with the
1.0 INTRODUCTION. 1
1.1 Background 1
1.2 Study area description 1
2.0 METHODS 3
3.0 RESULTS AND DISCUSSION 5
3.1 Echo sounding measurements and sea bottom topography 5
3.2 Sediment composition 6
3.3 Grain size distribution 7
3.3.1 Mean grain size 7
3.3.2 Sorting 9
3.3.3 Skewness 9
3.4 Tidal currents 12
3.5 Status of coastal erosion and coastal vulnerability to erosion 12
4. 0 CONCLUSIONS AND RECOMMENDATIONS 23
4.1 Conclusions 23
4.2 Recommendations 23
5.0 REFERENCES 25
APPENDICES 26
Appendix 1: UTM Coordinates of the sediment sampling locations 27 Appendix 2: The Mean grain size, sorting and skewness of the Lazy Lagoon sediments 29
1.0 INTRODUCTION
1.1 Background
The work presented in this report is based on a one week field study conducted in January/February, 2011 at Lazy Lagoon area, Bagamoyo for the purpose of making a rapid assessment of the shoreline characteristics and the dynamics of the Lagoon in response of the physical forcing agents (namely the oceanic and meteorological forcing factors). The study was a baseline study which will shed light on other planned scientific studies by the Tanzania Coastal Management Partnership (TCMP) which facilitates a participatory and a transparent process to unite government and the community, science and management, sectoral and public interests to wisely conserve and develop coastal ecosystems and resources.
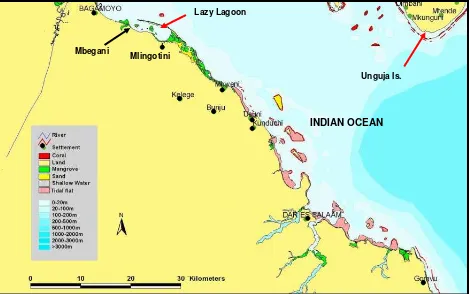
1.2 Study area description
Lazy Lagoon
Unguja Is.
INDIAN OCEAN
Mlingotini Mbegani
492000 497000 502000
Raised reef platforms with
mangroves and other vegetations Raised reef platforms with
mangroves
Sandbanks
Mlingotini Mbegani
Mangrove fringes
INDIAN OCEAN
Lazy Lagoon Lazy Lagoon
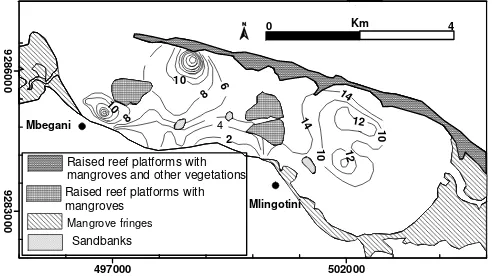
Fig.2. Map showing the main physiographic features of the Lazy Lagoon
An oceanographic and geological field work was conducted at Lazy Lagoon area in January/February 2011 for the purpose of making a rapid assessment of the shoreline characteristics and the dynamics of the Lagoon.
2.0 METHODS
celcius) of the sea water. Processing of the echo sounding data involved correction of the depth data for the tides. The tidal elevation data used for the correction of the depth data were obtained from the pressure measurements. An analysis of the echo sounding data was undertaken using surfer computer software. Surfer is a rectangular gridbased contouring program. Prior to contouring operation, the program require that grid files be created from the original X,Y, Z data
492000 497000 502000
9
Raised reef platforms with mangroves and other vegetations Raised reef platforms with
mangroves
Sandbanks
Mangrove fringes
Mlingotini Mbegani
INDIAN OCEAN
1
2
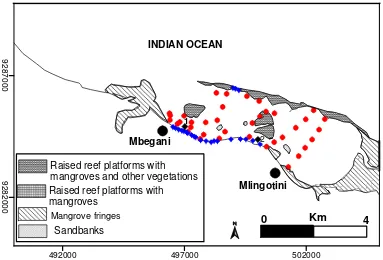
Fig. 3. Map showing the location of the sediment sampling sites and the current meter locations at Lazy Lagoon. Red dots = grab samples, blue diamond symbols = beach samples, black diamond symbols = Station 1 and 2 for the current meter.
was determined according to Folk and Ward (1957). During the beach sediment sampling, attempt was also made to document the major shore characteristic features as well as any observable shore erosion/accretion features.
3.0 RESULTS AND DISCUSSION
3.1 Echo sounding measurements and sea bottom topography
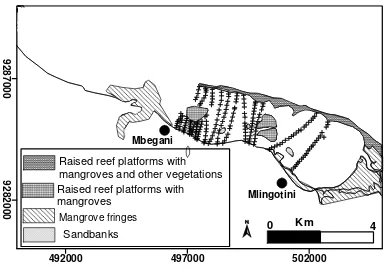
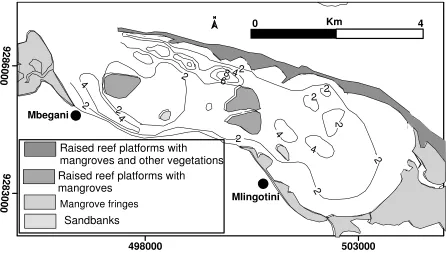
The spatial distribution of the depth data points is shown in Fig. 4a, while the map of sea bottom topography of the Lazy Lagoon is shown on Fig. 4b. The results indicate that the Lazy Lagoon is a shallow lagoon with a maximum depth of about 8 m with two main “deeps”, one along the southern side of the lagoon (close to the shoreline), and the other along the northern side of the lagoon (proximal to the outer reef platform. The southern deep is relatively shallower (with maximum depth of about 4m) compared to the northern deep which has a maximum depth of about 8. The two deeps are the major conduits of the tidal currents in the Lagoon (See section 3.4).
492000 497000 502000
9
Raised reef platforms with
mangroves and other vegetations Raised reef platforms with
mangroves
Sandbanks
Mangrove fringes
Mlingotini Mbegani
9
Raised reef platforms with
mangroves and other vegetations Raised reef platforms with
mangroves
Sandbanks
Mangrove fringes
498000 503000
Fig 4-b: A map showing Lazy Lagoon the sea bottom topography. Note that the depth contours are in metres with contour interval = 2.
3.2 Sediment composition
9
Raised reef platforms with
mangroves and other vegetations Raised reef platforms with
mangroves
Sandbanks Mangrove fringes
Mbegani
497000 502000
Fig. 5: Map showing the distribution of CaCO3 in the sea bottom sediments.
3.3 Grain size distribution
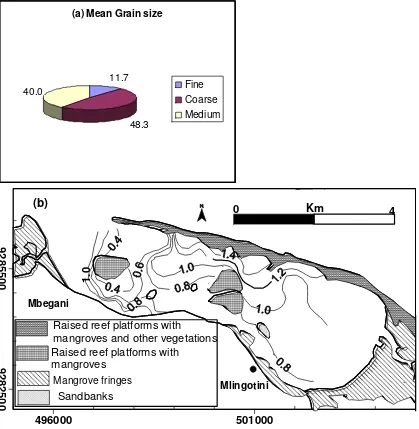
3.3.1 Mean grain size
side of the lagoon (from the mid part of the lagoon towards the shore) where the sediments were dominated by coarse sand size category. In contrast the sediments on the northern side of the lagoon were characterized by medium to fine sand categories. To a large extent, the mean grain size distribution at Lazy Lagoon seem to be controlled by depth, with coarser sediments on shallow areas and finer sediments in deeper parts of the sea bottom.
Raised reef platforms with
mangroves and other vegetations Raised reef platforms with
mangroves
Sandbanks
Mangrove fringes
Mbegani
496000 501000
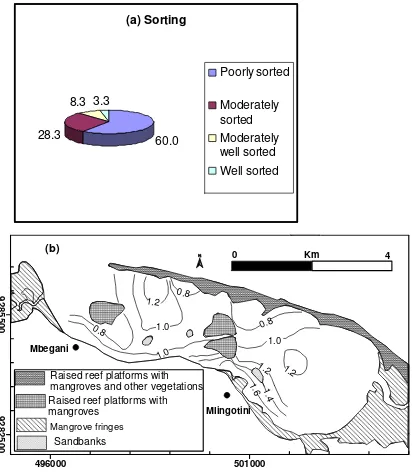
3.3.2 Sorting
Sorting of the sediments reflects the overall size variation of the particles as influenced by the variation of the energy of the depositing medium.Analyses of the sorting distribution of the sediments (Fig. 7a) revealed that majority of the sediment samples (more than 85 %) were either poorly sorted (sorting range between 1 and 2 phi; Folk, 1966) or moderately sorted (sorting range between 0.7 phi and 1.0 phi; Folk, 1966), while 11.6 % of the sediments were either moderately well sorted (8.3%) or well sorted (3.3%), with sorting ranges between 0.5 and 0.7 phi and 0.35 and 0.5 respectively. Furthermore, the results revealed that the sediments surrounding the western reef platform (the reef platform off Mbegani) as well as the most of the sediments on and adjacent to the northern tidal channel were relatively better sorted than the rest of the Lazy Lagoon sediments, These sediments were characterized by sorting value less than 1.0 phi, while the remaining parts of the sea bottom was characterized by poorly sorted sediments (sorting value >1.0 phi).
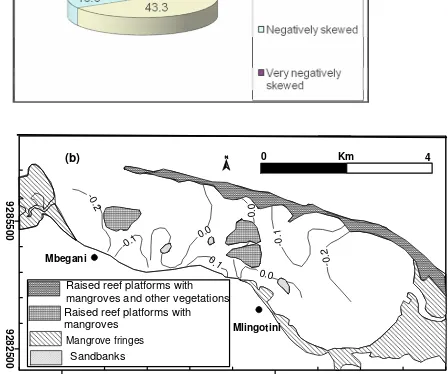
3.3.3 Skewness
(a) Sorting
Poorly sorted
8.3
496000 501000
9
Raised reef platforms with
mangroves and other vegetations Raised reef platforms with
mangroves
Sandbanks
Mangrove fringes Mbegani
Mlingotini
(b)
9
Raised reef platforms with
mangroves and other vegetations Raised reef platforms with
mangroves
Sandbanks
Mangrove fringes
Mbegani
496000 501000
3.4 Tidal currents
3.5 Status of coastal erosion and coastal vulnerability to erosion
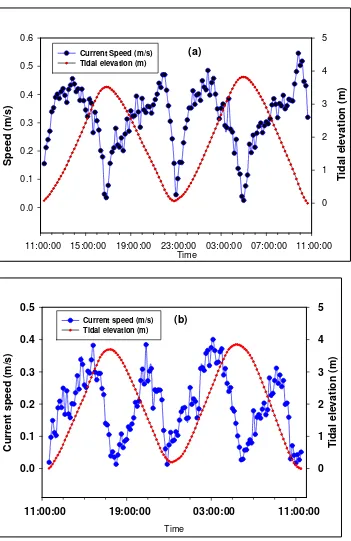
0.6 5
Current Speed (m/s) (a) Tidal elevation (m)
0.5 4 Tidal elevation (m)
0.4 4
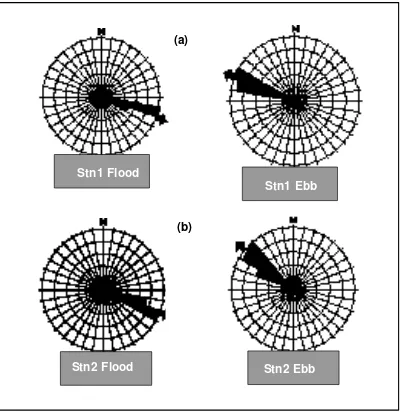
Fig. 10: Current roses at (a) Station 1 and (b) Station 2 of Lazy Lagoon, Bagamoyo. The current roses indicate the dominant current direction at two stations during Flood (Left) and Ebb (Right) tidal phases.
Stn1 Ebb Stn1 Flood
Stn2 Ebb Stn2 Flood
(a)
9
Raised reef platforms with mangroves and other vegetations Raised reef platforms with mangroves
Sandbanks Mangrove fringes
498000 503000
Fig. 11: Map showing the two major tidal current streams (dotted lines) in Lazy Lagoon, superimposed on the bathymetric contour map discussed in section 3.1.
492000 497000 502000
9
Raised reef platforms with mangroves and other vegetations Raised reef platforms with mangroves
Sandbanks
Mlingotini Mbegani
Mangrove fringes
INDIAN OCEAN
Lazy Lagoon Lazy Lagoon
The other coastal protective structures encountered along the coastal stretch between Mbegani and Mlingtini were gabions Fig. 13. Gabions are vertical wall structures made of rectangular containers (baskets) of thick galvanized wire, which are normally filled with quarried rocks and stacked to each other, usually in tiers that step back with the slope rather than vertically (Fig. 13. Exposure of tree roots (Fig. 14), incidences of uprooting of mangrove tress (Fig. 15) as well as actual collapse of cliffs (Fig. 16) were common features along a 23 km coastal stretch on the western side of the Lagoon (Fig. 12), but less common on the coastal stretch proximal to Mlingotini. The erosional features were generally absence along the coastal stretch fringed by dense mangrove thickets east of Mlingotini fish landing site.
Field investigations of the coastal stretch from Mbegani to Mlingotini revealed that mangrove vegetations formed one of the prominent features of the shoreline and to large extent the mangrove vegetations had played a significant role in shore stabilization and protection of the shore against wave erosion.
Other important features observed along the coastal stretch from Mbegani to Mlingotini were marine terraces and beach ridges. Marine terraces are relatively horizontal or inclined geomorphic surfaces with vertical steps of marine origin while beach ridges are waveswept or wavedeposited ridges running parallel to the shoreline of marine origin. Both the marine terraces and beach ridges are considered to be distinctive backshore geomorphological features formed during the Late Pleistocene to Holocene sea level fluctuations, and are common backshore geomorphological features along the coast of Tanzania (Alexander, 1968, 1969, 1985; Muzuka et al. 2004).
In the present investigated coastal section between Mbegani and Mlingotini, beach ridges were particularly common on the 2 km western coastal stretch (Fig. 1415). Further eastwards (the next 2 km) along the coastal stretch, the marine terraces (Fig. 16) were relatively more important distinctive backshore features than the beach ridges. Most of the marine terrace units observed along this central coastal stretch had vertical steps and in most cases the lowest terrace unit was eroding. The coastal stretch proximal to Mlingotini was characterized by superposition of beach ridges and marine terraces (Fig. 17).
the subsurface 2m depth sediment composition could shed more light on the reasons for the observed magnitude of shoreline erosion between the western side and eastern side of the investigated coastal stretch.
Fig. 15: Eroding shore at Mbegani as exemplified by the uprooting of trees.
4. 0 CONCLUSIONS AND RECOMMENDATIONS
4.1 Conclusions
• The Lazy Lagoon, located between Mbegani and Mlingotini, Bagamoyo is a shallow lagoon with a maximum depth of 8 m, with two “deeps” one along the southern side of the lagoon (close to the shoreline), and the other along the northern side of the lagoon (proximal) to the outer reef platform. The northern “deep” with a maximum depth of 8 m was relatively deeper than the southern “deep”.
• The lagoon has two tidal channels, corresponding to the southern and northern “deep”, respectively. The two channels which merge on their upstream side are the major conduits of the tidal currents during flood and ebb.
• The sediments on the lagoon (including the beach sediments) are dominated by siliciclastic (land derived sediments) with the biogenic components in the sediments averaging to about 5%. The biogenic components was relatively higher (between 10-25%) on the northern and southern deeps as well as on the sea bottom proximal to Mlingotini, than in the remaining parts of the sea bottom including the beach sediment. • The tides in the Lagoon were semidiurnal (with two high waters and two low waters
each day) with maximum tidal amplitude of about 4 m and maximum speeds of about 0.5 m/s. During the flood phase of the tides, the tidal currents were dominantly southeasterly and during ebb the tidal currents were dominantly northwesterly.
• Evidence of wave erosion along the coastal stretch between Mbegani and Mlingotini were abundant but the severity of wave erosion was relatively higher on the coastal stretch towards Mbegani than on the coastal stretch towards Mlingotini. The observed difference could either be attributed to the difference in the physiographic settings between the two sides or the difference in the mangrove coverage between the two.
4.2 Recommendations
differences on the severity of wave erosion between the western side and eastern side of the investigated coastal stretch.
• Tidal currents measurements along the northern tidal channel were not measured during the present study. This would be another important data for the future studies as the data would provide further insights on the circulation pattern of the tides in the lagoon.
5.0 REFERENCES
Alexader, C.S. (1968). The Marine terraces of the northeastern coast of Tanganyika. Zeitschrift fur Geomorphologie, Supplementband 7: 133-154.
Alexander, C.S. (1969). Beach ridges in northeastern Tanzania. Geographical Review, 49: 104-123.
Alexander, C.S. (1985). Tanzania. In “Bird, E.C.F. and Shwartz, M.L. (Editors), The world’s coastlines”. Van Nostrand Reinhold Company Inc., pp.691695.
CIRIA (1996) Beach Management Manual. CIRIA Report 153. Construction Industry Research and Information Association, London. 448pp.
Folk, R. L. and W.C. Ward. 1957. Brazos, river bar: A study in the significance of grain size parameters. Journal of Sedimentary Petrology 27: 327.
Folk, R.L. (1966). A review of grain size parameters. Sedimentology, 6: 73-93.
Muzuka, A.N.N., Nyandwi, N and Shaghude, Y.W. (2004). Preliminary investigation on the
Pleistocene/Holocene sea level changes along the coastline of Tanzania, with reference to Unguja and Pemba islands. Bulletin of the Directorate of Geology, Mozambique (Boletim Direcção Nacional de Geologico, Moćambique), 43: 813.
Ngusaru, A. 2002. “Climate and Oceanography”. In A field guide to the seashores of East Africa and the western Indian Ocean Islands, edited by Richmond, M.D. Pages 1221,
SIDA/SAREC
Shaghude,Y.W., Mburu,J.W, Arthurton, R.S. , Dubi, A., Gachuiri,S., Kangwe, J., Magori,C., Msuya, F., Mwaipopo,R., Nyandwi, N., Ochiewo, J., Ong’anda,H., Sallema,R., Sanga, I., Shalli, M., Uku, J. (2010). Shoreline change in Tanzania and Kenya: Assessment
procedures and mitigation strategies for management. 88 p., submitted, Western Indian Ocean Journal of Marine Science.
Wentworth, C.K (1922). A scale of grade and class terms for clastic sediments, J. Geology
APPENDICES
Appendix 1: UTM Coordinates of the sediment sampling locations, grain size distribution parameters (Mean grain size, Sorting and Skewness) and % of calcium carbonate content in the sediment samples.
Appendix 2: The Mean grain size, sorting and skewness of the Lazy Lagoon sediments and their corresponding descriptive terms according to Folk (1966).
Sample X Y Mean Sorting Skewness Carbonate BG43 502240 9284372 0.861 0.886 0.010 7.83
BG44 501952 9284032 0.784 1.017 -0.086 15.47
BG45 501688 9283690 1.036 1.151 -0.090 8.19
BG46 501262 9283240 1.135 1.675 0.018 7.11
BG47 497137 9284645 0.826 1.083 0.198 0.95
BG48 497293 9284563 2.317 1.278 -0.473 1.43
BG49 497395 9284502 2.135 1.417 -0.422 1.27
BG50 497464 9284470 2.342 1.192 -0.339 1.15
BG51 497662 9284346 1.512 1.444 -0.155 1.15
BG52 497884 9284315 2.598 1.562 -0.610 7.09
BG53 498096 9284272 1.399 1.087 0.171 0.76
BG54 498196 9284665 1.094 0.895 0.081 3.47
BG55 498350 9284310 1.610 1.353 0.063 3.14
BG56 498911 9284391 0.840 1.099 0.110 0.67
BG57 499295 9284394 0.807 1.099 0.183 0.58
BG58 499522 9284390 0.988 0.630 0.302 0.49
BG59 499807 9284330 1.156 0.851 0.127 0.36
Appendix 2: The Mean grain size, sorting and skewness of the Lazy Lagoon sediments and their corresponding descriptive terms according to Folk (1966)
Sample Mean Descriptive term
Sorting Descriptive term
Skewness Descriptive term
BG1 0.870 coarse 1.232 Poorly sorted 0.331 Very positively skewed
BG2 1.800 medium 1.672 Poorly sorted 0.533 Very negatively skewed
BG3 1.517 medium 1.794 Poorly sorted 0.365 Very negatively skewed
BG4 0.802 coarse 1.332 Poorly sorted 0.357 Very positively skewed
BG5 0.702 coarse 0.840 Moderately sorted
0.187 Positively skewed BG6 1.140 medium 0.788 Moderately
sorted
0.175 Positively skewed BG7 1.807 medium 1.024 Poorly sorted 0.463 Very negatively
skewed BG8 2.273 Fine 0.648 Moderately well
sorted
0.200 Negatively skewed BG9 1.086 Medium 1.313 Poorly sorted 0.075 Symmetrical BG10 1.288 Medium 1.194 Poorly sorted 0.064 Symmetrical BG11 1.001 Medium 1.231 Poorly sorted 0.164 Negatively skewed BG12 0.341 Coarse 0.740 Moderately
sorted
0.082 Symmetrical BG13 0.460 Coarse 0.779 Moderately
sorted
0.085 Symmetrical BG14 0.329 Coarse 0.852 Moderately
sorted
0.023 Symmetrical BG15 1.055 Medium 1.320 Poorly sorted 0.110 Positively skewed BG16 0.932 Coarse 1.469 Poorly sorted 0.177 Positively skewed BG17 0.617 Coarse 0.790 Moderately
sorted
0.145 Negatively skewed BG18 0.332 Coarse 0.681 Moderately well
sorted
0.115 Negatively skewed BG19 0.830 Coarse 1.092 Poorly sorted 0.115 Negatively skewed BG20 0.680 Coarse 0.826 Moderately
sorted
Sample Mean Descriptive term
Sorting Descriptive term
Skewness Descriptive term
BG25 1.340 medium 1.007 Poorly sorted 0.151 Positively skewed BG26 2.388 Fine 0.305 Well sorted 1.163 Negatively skewed BG27 2.464 Fine 0.425 Well sorted 0.014 Symmetrical BG28 1.202 medium 0.670 Moderately well
sorted
0.050 Symmetrical BG29 1.545 medium 1.044 Poorly sorted 0.004 Symmetrical BG30 1.447 medium 0.560 Moderately well
sorted
0.075 Symmetrical BG31 0.850 coarse 0.943 Moderately
sorted
0.084 Symmetrical BG32 0.755 coarse 0.870 Moderately
sorted
0.078 Symmetrical BG33 0.621 coarse 0.986 Moderately
sorted
0.036 Symmetrical BG34 0.916 coarse 1.051 Poorly sorted 0.020 Symmetrical BG35 0.913 coarse 1.135 Poorly sorted 0.496 Very negatively
skewed BG36 0.927 coarse 1.235 Poorly sorted 0.059 Symmetrical BG37 0.956 coarse 1.110 Poorly sorted 0.017 Symmetrical BG38 1.134 medium 1.035 Poorly sorted 0.184 Negatively skewed BG39 0.664 coarse 0.923 Moderately
sorted
0.027 Symmetrical BG40 1.556 medium 0.800 Moderately
sorted
0.315 Very negatively skewed
BG41 1.052 medium 0.967 Moderately sorted
0.026 Symmetrical BG42 1.220 medium 1.256 Poorly sorted 0.079 Symmetrical BG43 0.861 coarse 0.886 Moderately
sorted
0.010 Symmetrical BG44 0.784 coarse 1.017 Poorly sorted 0.086 Symmetrical BG45 1.036 medium 1.151 Poorly sorted 0.090 Symmetrical BG46 1.135 medium 1.675 Poorly sorted 0.018 Symmetrical BG47 0.826 coarse 1.083 Poorly sorted 0.198 Positively skewed BG48 2.317 Fine 1.278 Poorly sorted 0.473 Very negatively
skewed
BG49 2.135 Fine 1.417 Poorly sorted 0.422 Very negatively skewed
BG50 2.342 Fine 1.192 Poorly sorted 0.339 Very negatively skewed
Sample Mean Descriptive term
Sorting Descriptive term
Skewness Descriptive term
BG53 1.399 medium 1.087 Poorly sorted 0.171 Positively skewed BG54 1.094 medium 0.895 Moderately
sorted
0.081 Symmetrical BG55 1.610 medium 1.353 Poorly sorted 0.063 Symmetrical BG56 0.840 coarse 1.099 Poorly sorted 0.110 Positively skewed BG57 0.807 coarse 1.099 Poorly sorted 0.183 Positively skewed BG58 0.988 coarse 0.630 Moderately well
sorted
0.302 Very positively skewed
BG59 1.156 medium 0.851 Moderately sorted
0.127 Positively skewed BG60 0.463 coarse 0.815 Moderately
sorted
Appendix 3: The UTM coordinates of the sounding points and the corresponding depth in metres. Note that the positive are by convention below zero depth and negative values are above zero depth.(i.e. on land).
X Y Depth(m) X Y Depth (m)
Line 1 Line 12
497098 9284700 0.5 498549 9285578 2
497084 9284751 5.2 498501 9285411 1.7 497092 9284817 5.2 498447 9285237 1.9
497097 9284876 5.4 498387 9285068 2
497106 9284950 5.3 498322 9284876 2.1 497116 9285015 3.3 498286 9284760 2.7
497120 9285099 0.4 498251 9284542 1
497128 9285172 0.6 498239 9284395 1.6 497143 9285239 1.4 498228 9284311 1.9 497165 9285286 2.3 Line 13
Line 2 498450 9284339 1.8
497314 9285215 2.2 498525 9284443 3.4
497284 9285129 1.3 498600 9284581 1
497250 9285011 0.4 498663 9284713 2.2 497227 9284904 3.9 498734 9284946 2.1
497211 9284796 5 498760 9285052 1.9
497183 9284700 6.8 498809 9285255 1.3
497173 9284853 2 498853 9285418 1.5
Line 3 498891 9285578 1.9
497319 9284551 1.4 498936 9285758 1.6 497331 9284640 6.3 498945 9285796 1.6 497349 9284766 3.8 498997 9286048 7.6 497361 9284833 2.4 499016 9286160 4.8 497376 9284910 0.3 499035 9286295 0.8 497388 9285018 1.2 499042 9286407 1.8 497400 9285100 1.6 Line 14
497414 9285167 2.1 499303 9286314 1.6 497436 9285223 2.4 499321 9286164 0.7
Line 4 499332 9285988 0.1
X Y Depth(m) X Y Depth (m) 497435 9284612 5.4 499385 9284789 1.2 497412 9284536 5.9 499384 9284644 0.3 497394 9284493 2.1 499388 9284519 1.8
Line 5 499370 9284413 0.6
496856 9284804 0.8 Line 15
496854 9284866 4 499533 9284349 1.3
496872 9284925 3.9 499537 9284429 0.9 496889 9284993 4.4 499555 9284523 0.7
496912 9285079 5.67 499581 9284650 0
496939 9285179 4.4 499610 9284797 0.6 496967 9285284 1.5 499632 9284914 0.4 496981 9285360 0.7 499655 9285049 0.2 496986 9285446 1.4 499669 9285155 0.2
Line 6 499683 9285250 0.1
496799 9285466 5.3 499694 9285380 1
496775 9285293 6.4 499714 9285544 0.1
496740 9285195 1.2 499734 9285663 2
496694 9285031 5.3 499755 9285780 10.8 496663 9284919 0.5 499774 9285908 5.8
Line 7 499788 9285995 3.6
496540 9284993 1.2 499800 9286042 0.1 496562 9285075 0.9 Line 16
496588 9285160 2.5 500110 9285966 0.3 496603 9285236 1.3 500095 9285859 0.8
496642 9285297 1.7 500042 9285716 7
496713 9285351 1.5 499968 9285527 0.3 496734 9285431 4.9 499933 9285405 0.1 496734 9285568 6.2 499889 9285235 0.1 499852 9285119 0.1 497497 9286671 5.1 499821 9284980 0.6 497452 9286543 1.5 499809 9284840 0.8 497432 9286385 1.6 499788 9284683 0.7 497384 9286234 2.2 499778 9284535 0.4 497331 9286143 0.2 499756 9284404 1.2
Line 9 499725 9284288 1.3
497509 9285916 1.9 Line 17
X Y Depth(m) X Y Depth (m) 497745 9286310 0.5 500682 9284265 0.4 497763 9286448 0.4 500803 9284294 1.1 497772 9286529 7.9 500903 9284365 0.1 497740 9286583 8.3 501022 9284462 0.5
Line 10 501166 9284539 6.8
498022 9286557 0.8 501269 9284619 2.4
498030 9286405 6 501358 9284679 0.5
498020 9286278 1 501468 9284764 0.3
498032 9286166 1.3 501569 9284854 0.4
498009 9286033 0.7 501665 9284887 0
497990 9285926 2.2 501790 9285006 0.1 497798 9285501 2.4 501877 9285095 0.2 497726 9285432 2.3 501977 9285201 0.2 497782 9285240 2.4 502094 9285288 1.6 497788 9285084 1.9 502159 9285372 0.9 497780 9284930 1.6 502228 9285447 0.2 497767 9284818 1.6 502300 9285575 1.1 497748 9284646 0.3 Line 18
497731 9284491 5.5 502760 9285212 0.7 497696 9284398 2.1 502766 9285107 0.1
497677 9284354 2.2 502700 9285004 0
Line 11 502605 9284588 0.9
497859 9284328 1.5 502525 9284779 0.1 497918 9284416 3.6 502455 9284642 0.1 497969 9284511 3.1 502389 9284555 0.4 498027 9284647 1.9 502307 9284459 0.2 498089 9284798 1.2 502240 9284372 0.2 498138 9284948 1.6 502154 9284260 1.5 498179 9285108 1.2 502097 9284195 6.1 498219 9285300 1.9 502014 9284104 4.4 498269 9285525 1.7 501952 9284032 1.2 498302 9285710 1.2 501895 9283916 0.4 498350 9285927 0.7 501834 9283848 0.9
498392 9286108 1 501757 9283760 0.9
498404 9286293 6.2 501688 9283690 0.6 498396 9286438 5.9 501595 9283591 0.6
Line 12 501535 9283535 0.6