Copyright © 2017 (Ramón Tirado-Morueta, Damian Mendoza-Zambrano, Isidro Marín-Gutiérrez, and Mariuxi Mendoza-Zambrano). Licensed under the Creative Commons Attribution Non-commercial No Derivatives (by-nc-nd). Available at http://ijoc.org.
The Relativity of Sociodemographic Determinism on the
Digital Divide in High School Students in Ecuador
RAMÓN TIRADO-MORUETA
Although the digital divide on physical access to the Internet in developing countries is closing with respect to developed countries, a new gap on the social usage of the Internet is opening. This study focuses on Ecuador for the purpose of (a) determining the level of access to Internet use of the younger sector of the population (high school students) and (b) understanding to what extent sociodemographic factors determine Internet access and its use. This study uses a random sample (3,754 individuals), stratified by provinces, which is representative of high school students in Ecuador. The results show that the influence of sociodemographic factors are higher with regard to the physical access to the Internet, and this influence decreases with regard to more complex levels of Internet usage (i.e., the data show that a high sociofamilial status does not guarantee access to more complex Internet usage levels; however, a low status is a risk factor).
Keywords: media literacy, digital literacy, digital divide, Internet access, sociodemographic determinism, Internet usage
The presence of the Internet is increasingly evident in social relations, economic transactions, and production processes in Ecuador (López, Callejo, & Cajiao, 2014). The increased activity on the Internet is a reflection of the activities and economic, social, and cultural relations offline, including inequalities (Witte & Mannon, 2010; Zillien & Hargittai, 2009). In this sense, the appropriation of technology by the citizens will be a factor for social inclusion (Haddon, 2000; van Deursen, van Dijk, & ten Klooster, 2015). Arguments about the Internet affecting social inclusion are reflected in the digital-divide
discourse. Digital-divide-related research often takes one or more types of Internet access and investigates how these access types relate to sociodemographic variables.
In this regard, in developing countries such as Ecuador, although there have been notable advances in the access to equipment needed for accessing the Internet, the situation is still far from other more developed areas of the world (see Table 1). For example, according to the Network Readiness Index (NRI; Bilbao-Osorio, Dutta, & Lanvin, 2014), Ecuador is ranked 82nd among 144 countries that make up the report. The NRI is an index of four dimensions: (a) environment (political/regulatory and innovation environment and business), (b) the preparation of the environment (skills, infrastructure, and affordability), (c) the use of the environment (individual, business, and government), and (d) the impact on the environment (economic and social). This report recognized the effort that many countries in the region of Latin America and the Caribbean are undertaking to develop and update their ICT infrastructure. However, although the distances in infrastructure, policies, and regulations between this area of the world and more developed areas are reduced, there are still difficulties that widen a new digital divide on the use of ICT between countries that are achieving positive economic and social impacts and those without (Bilbao-Osorio et al., 2014). This type of report, among others (e.g., ICT Development Index [IDI]; ITU, 2014) shows macroeconomic and social information through key informants and indirect data, which have political utility. However, there are few studies at the national/international level with representative samples that explore such aspects.
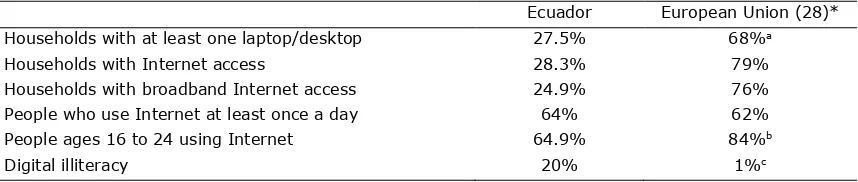
The study presented in this article took place and was developed in Ecuador. As shown in Table 1, even though the percentage of people who use the Internet daily is very similar to the European Union (28)
average, the proportion of Internet access quality is much lower. It is obvious that the gap in frequency of Internet use with regard to developed countries is closing. However, the type of use given to the Internet by the population as well as the literacy required to exploit the medium intelligently is unknown.
Table 1. Indicators of Access and Internet Use in Ecuador Versus the European Union (28).* Ecuador European Union (28)*
Households with at least one laptop/desktop 27.5% 68%a
Households with Internet access 28.3% 79%
Households with broadband Internet access 24.9% 76%
People who use Internet at least once a day 64% 62%
People ages 16 to 24 using Internet 64.9% 84%b
Digital illiteracy 20% 1%c
Source: National Survey of Employment, Unemployment and Underemployment (ENEMDU; 2010–13); EUROSTAT, 2015.
aData from 2010. bDaily use. cData from 2015.
This study focuses on the population of high school students, ages 16 to 18 years, living in Ecuador. This group is the age group that usually uses the Internet more frequently, and they are the human resources for the country’s future development. However, their ability to access the Internet in other levels other than the mere frequency of use is unknown. These other levels for Internet access are what research on the digital divide have defined as the second level (type and ability to use the Internet; Hargittai, 2002; Witte & Mannon, 2010; Zillien & Hargittai, 2009) and third level of Internet access
(intelligent use of the Internet; van Deursen & Helsper, 2015). In this sense, the first objective of this research is to determine the capacity of high school students in Ecuador to access and use the Internet intelligently.
Also, as mentioned at the beginning of this introduction, research on the digital divide has been dedicated to relating the different types of access to sociodemographic variables. Recent studies have shown that the relationship between sociodemographic variables and different types of Internet access is complex and not clear on how the sociodemographic factors relate to Internet access and use. In this sense, these studies have shown that personal preferences and needs reflected by the sociocultural and economic backgrounds often predict Internet use (Yu, Ellison, McCammon, & Langa, 2015).
Also, we must add the idea that access to the Internet means more than physical access and how often it is used. Recent studies demonstrate a relative influence of sociodemographic factors on the different levels of access and Internet use (e.g., van Deursen & van Dijk, 2015).
Considering this background, in this study, the following objectives were also proposed: (a) to determine the level of access and Internet usage for the younger sector of the population (high school students) and (b) to understand the influence of sociodemographic factors on the different levels of Internet access.
Literature Review
Digital Exclusion
The penetration of technology in society, social life, and the transformation of productive and economic processes threaten a social stratification that makes people with high social status occupy a privileged position on social and personal progress (Weber, 1978). According to Kuttan and Peters (2003), access to the (Internet) technology potentially affects the equality of social, educational, political, and economic opportunities. Recent studies have shown that the increased use of the Internet within society is reflected in the social, economic, and cultural relations of the off-line world, including inequalities (Hargittai & Hinnant, 2008; van Deursen & van Dijk, 2014; van Dijk, 2006). Empirical studies on the benefits of Internet use are being conducted in many societies, and although they often lack a strong conceptual base, they are providing results that show a direct relationship between intensive and extensive use of the Internet and economic social, institutional, political, and educational benefits (van Deursen & Helsper, 2015). They have also clearly shown that the relationship between Internet use and benefits is quite complex depending on the skills and many other sociodemographic aspects as well as personal (e.g., Chadwick, 2013; Robinson, 2009), cultural (e.g., Brundidge & Rice, 2009; Hindman, 2008), and structural (e.g., Bilbao-Osorio et al., 2014) factors.
Digital Divide Levels
The term digital divide has a North-American origin, dating from the 1990s, and it was used for the first time in an official publication written by the National Telecommunications and Information Administration (NTIA; see Gunkel, 2003). In the first reports about its state (Compaine, 2001; Servon, 2008), the term digital divide was identified with the material/physical access to ICTs, using as independent variables factors such as race, gender, age, economic situation, level of education, type of household, and geographic location.
As the presence of computers and the Internet increased in developed countries, the term started to evolve, and more complex conceptualizations were developed, including a set of indicators of Internet access (Livingstone & Helsper, 2007; Riggins & Dewan, 2005; Selwyn, 2004; van Deursen & van Dijk, 2011; van Dijk, 2006, 2012; Warschauer, 2002, 2004). As a result, three successive levels of digital divide have been differentiated.
The first level focuses on the differences in access of the individuals to the infrastructure, including factors such as autonomy and the continuity of access (Newhagen & Bucy, 2004; Selwyn, 2004; van Dijk, 2006). Therefore, the first level has special relevance on the development of infrastructure and the weaving of goods and services that are accessible by the population. In this study, on the one hand, the physical access to the Internet, the number of devices, and the quality of the Internet signal were taken into account, and on the other hand, the operative ability that includes the skills possessed by the students to work with the Internet as well as the frequency of operational use were also deemed important.
As access to Internet resources has been generally overcome by the citizens of developed countries, the second level of division presents itself in the type of use and the abilities required for taking advantage of the ICTs (Hargittai, 2002; Riggins & Dewan, 2005; Witte & Mannon, 2010; Zillien & Hargittai, 2009). Studies on the second level of digital divide have contributed to a great number of classifications of the types of activities that people conduct online and on the type of skills needed for this (Blank & Groselj, 2014; Buckingham, 2007; Celot & Tornero, 2009; Hobbs, 2010; van Deursen & van Dijk, 2014). This study takes into account the knowledge possessed by the students for managing the digital autonomy and literacy can obtain very different benefits when using the Internet. In this sense, the development of a theoretical framework that is well cemented and that brings to light the relationship between different uses of the Internet and its benefits has been suggested (Blank & Groselj, 2014; Dornaleteche, Buitrago, & Moreno, 2015; van Deursen & Helsper, 2015). Even though this topic is not analyzed in depth in this study, it does takes into account how students use the Internet by the students when conducting academic tasks. Therefore, this study tries to understand the academic usefulness of the Internet for high school students.
RQ1: What is the capacity of high school students in Ecuador to access the Internet at the following levels: physical access (PA), operational ability (OA), operational use (OU), informational knowledge (IK), knowledge of language (KL), expressive use (EU), and academic achievement (AA)?
Sociodemographic Determinism in the Access to Internet Use
The study of sociodemographic determinism has been one of the most studied aspects in research studies on the digital divide. Barzilai-Nahon (2006), after performing a rigorous literature review on digital-divide research, showed that the direct influence of demographic factors―socioeconomic status, gender, age, education―was the most studied topic.
The sociodemographic factors are usually interpreted as factors of social status, which are usually associated with the capacity of physical access to the technology. In this sense, van Dijk (2012) proposed a cyclical and causal model on the appropriation of technology. In this model, the high social status of the citizen is a factor that facilitates the physical access to new media (van Deursen & van Dijk, 2015). Some studies have shown the direct association among socioeconomic status and frequency of use of the Internet. For example, Cheong (2007) examined the digital divide in the use of the Internet at home and at work in Singapore, finding that individuals with the highest income and educational level had a higher probability of using the Internet as well as a higher frequency of doing so. In a study of Canadian citizens, Haight, Quan-Haase, and Corbett (2014) showed that citizens with a higher social status―income, educational level, among others―had a greater degree of Internet activity and participated with greater frequency in social networks.
However, the relationship between socioeconomic status and potential uses of the Internet is not always direct. It now appears that sociocultural and economic factors, reflecting the attitudes and needs of individuals, predict the type of Internet use.
For example, Kolodinsky, Hogarth, and Hilgert (2004) and Hogarth, Kolodinsky, and Gabor (2008) analyzed the use of online banking by American consumers. Their findings revealed that socioeconomic and demographic factors such as income, education, gender, and age affected not only the adoption of online banking applications but also their original intent for its adoption. Similar results have been provided by Zhang, Wang, and Kolodinsky (2010) with respect to the use of the Internet for information searching, identifying sociodemographic factors such as salary, educational level, and age as the main factors that influence the probability of using the Internet to search for information.
Also, numerous empirical studies show not only the influence of the sociodemographic factors on the frequency of use of the new media but also their relationship with the attitude toward new technologies. For example, Dixon et al. (2014) identified the attitudes as a determinant factor of Internet use, relating it to gender. More specifically, they concluded that women used the Internet to a lesser degree than men did due to the nostalgia they felt toward paper books. Harambam, Aupers, and Houtman (2013) identified the influence of what the people feel and think about technology.
educated to compensate for their social disadvantage, used the Internet more frequently as a medium of expression, association, and learning than more favored communities.
Also, regarding the influence of sociodemographic factors on the different levels of Internet access, a recent study by van Deursen and van Dijk (2015), through a structural analysis, showed that such factors mainly influenced physical access. Also, the most advanced levels of Internet use were influenced by cultural aspects associated with digital literacy.
Therefore, given these previous studies, this study assumes that the sociodemographic status of the student’s families in Ecuador determine, to varying degrees, their capacity to access Internet. The sociodemographic factors mainly affect physical access and operational use of the Internet, whereas its effect on the more advanced levels is scarce (see Figure 1).
Therefore, with this background, the following questions are proposed to answer the rest of the objectives of this study:
RQ2: To what extent do sociodemographic factors influence Internet access levels?
To answer RQ2 the following hypotheses are proposed:
H1: The sociodemographic variables have a greater influence on the physical and operational access to the Internet than on more advance levels, such as IK, KL, EU, and AA.
H2: It is more likely for men to have a high level of access to Internet use (PA, OA, OU, IK, KL, EU, and AA) than women.
H3: It is more likely that students whose parents have a university degree have a high level of access to Internet use (PA, OA, OU, IK, KL, EU, and AA) than those whose parents do not.
H4: It is more likely that students whose monthly family income is high (≥$1,200) have a high level of access to Internet use (PA, OA, OU, IK, KL, EU, and AA), compared with those whose income is lower.
H5: It is more likely that students with fewer family members at home (≤4) have a high level of access to Internet use (PA, OA, OU, IK, KL, EU, and AA), compared with those who live with more family members (≥5).
H6: It is more likely that students who study and work have a high level of access to Internet use (PA, OA, OU, IK, KL, EU, and AA), than those who only devote themselves to study.
Figure 1. Research scheme.
Method
Sampling
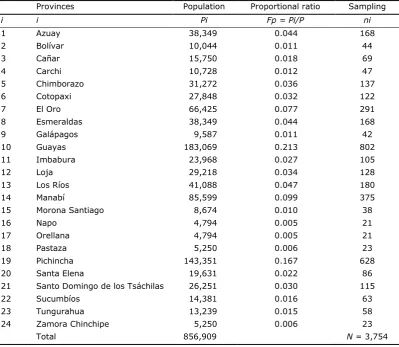
The population for this study consisted of 856,909 high school students from public, private, rural, and urban educational centers in Ecuador (Ministry of Education, 2014). To determine the total size of the sample needed, an infinite population assumption was used, with Z = 2.57, resulting from a 99% degree of confidence with ±2.1% used as the margin of error. To select the subjects for the study, a proportional and stratified sampling was conducted on the country’s 24 provinces.
For the sampling, the following formula was used: ni = n * (Pi / P), where i = number of
provinces, n = size of the sample, ni = size of the sample from strata i (province); Pi = population of
province i; P = the population of those age 16 to 18 years.
Table 2 illustrates the sample size for each of the provinces and the total (3,754 subjects).
Once the sample size was determined for each of the 24 provinces, a simple random sampling was applied so that each individual from the sample had the same probability of begin chosen during the sampling process.
Table 2. Sample Size per Province.
Provinces Population Proportional ratio Sampling
i i Pi Fp = Pi/P ni
To answer the RQ1, seven constructs were made with the aim of measuring the seven types of access to Internet use (e.g., Blank & Groselj, 2014; Buckingham, 2007; Celot & Turner, 2009; Hobbs, 2010; van Deursen & van Dijk, 2014). To measure each construct, an ordinal Likert scale with values from 1 to 4 was used. Each construct corresponded to one of the three access levels to Internet use. The first level referred to physical access (DiMaggio & Hargittai, 2001; Warschauer, 2004) and the capacity for operational Internet use: operational ability (Van Deursen, van Dijk & Peters, 2012) and operational use (e.g., Mossberger, Tolbert, & Stansbury, 2003).
For the validation of the constructs, the following properties were analyzed (see Appendix 1).
Dimensionality. First, it was found that the indicators―variables―that composed each construct were unidimensional. A principal component analysis was performed for each construct, and the Kaiser (1960) criteria was applied, meaning that a value greater than one was only given to the first component. Another important detail was that the first component should explain most of the variance. The analysis results showed that the value of the first component was >1, whereas the value of the second component was <1, except for the OA scale (value = 1.67) and the OU scale (value = 1.01). Also, the percentage of variance explained by the first factor on all scales was superior to 50%, with the exception of OA (46.41%) and IK (47.35%).
Reliability. Measures the consistency of the indicators forming the construct (i.e., to what extent the indicators were measuring the same object). To achieve this, Cronbach’s alpha and composite reliability (CR; Werts et al., 1974) were calculated, and it was found that all values were above the recommended (>.70) with the exception of PA (α = .62; CR = .54) , possibly due to the small number of indicators that composed it.
Convergent validity. Measures the extent to which the indicators reflect the construct (i.e., they measure what they are supposed to measure). To do this, the following variables were used: (a) the average variance extracted (AVE), with the minimum recommended value of .50, and (b) the load factor indicator, with the recommendation that the variance of each indicator exceed .5. Regarding the load factor, all indicators of each construct exceeded .50, except the indicator “receive and make calls on cell” (.48). In contrast, AVE was moderate in same constructs such as OA (.41), KL (.40), PA (.30), and IK (.46).
In Appendix 1, the descriptive results of each of the variables considered in each construct as well as the properties of each of the constructs used in the study are shown. Each construct is identified with a type of Internet access.
To answer RQ2, to identify the influence of sociodemographic factors on the different types of access to Internet use, logistic regression (LR) was used. The dependent variables were the seven types of access. Each of these variables become dummy variables, the lowest values being Q3 = 0, and equal or superior to Q3 = 1 values. The independent variables used were gender (male and female), monthly family income (reference quartiles: No income, <$300, $300–$1,199, and ≥$1,200), the main activity (only studies and studies work), educational level of father/mother (no schooling, primary, secondary, and university), number of family members at home (quartiles refer to four and more than four), ethnic group (Mestizo, White, Aboriginal, Montubio and Afro-Ecuadorian), and region (Costa, Sierra, Oriente, and Galápagos).
Results
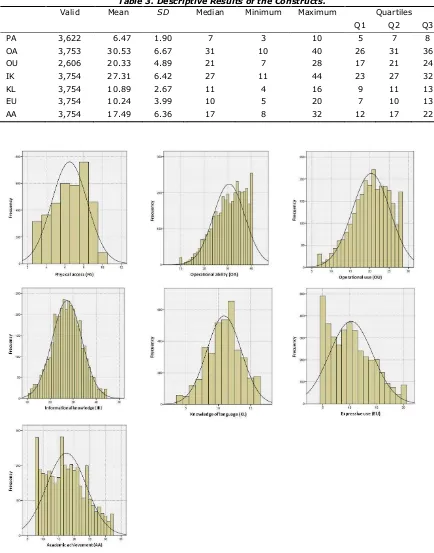
Table 3. Descriptive Results of the Constructs.
Valid Mean SD Median Minimum Maximum Quartiles
Q1 Q2 Q3
PA 3,622 6.47 1.90 7 3 10 5 7 8
OA 3,753 30.53 6.67 31 10 40 26 31 36
OU 2,606 20.33 4.89 21 7 28 17 21 24
IK 3,754 27.31 6.42 27 11 44 23 27 32
KL 3,754 10.89 2.67 11 4 16 9 11 13
EU 3,754 10.24 3.99 10 5 20 7 10 13
AA 3,754 17.49 6.36 17 8 32 12 17 22
The results show median values above average for PA, OA, and OU. Also, unimodal distribution was skewed to the left in the OA and OU constructs, so it could be said that students in Ecuador had physical access and high capacity of operational Internet use. Regarding the IK and KL constructs, the distribution was symmetrical, so it could be said that students had an average degree of informational knowledge and the media language. Regarding the EU and AA constructs, median scores were below the median value. Furthermore, the distribution was right-skewed unimodal, so we can say that high school students in Ecuador had a low ability for expressive use and academic achievement of the Internet.
To answer RQ2, the results of the hypotheses analysis are presented below (see Table 4).
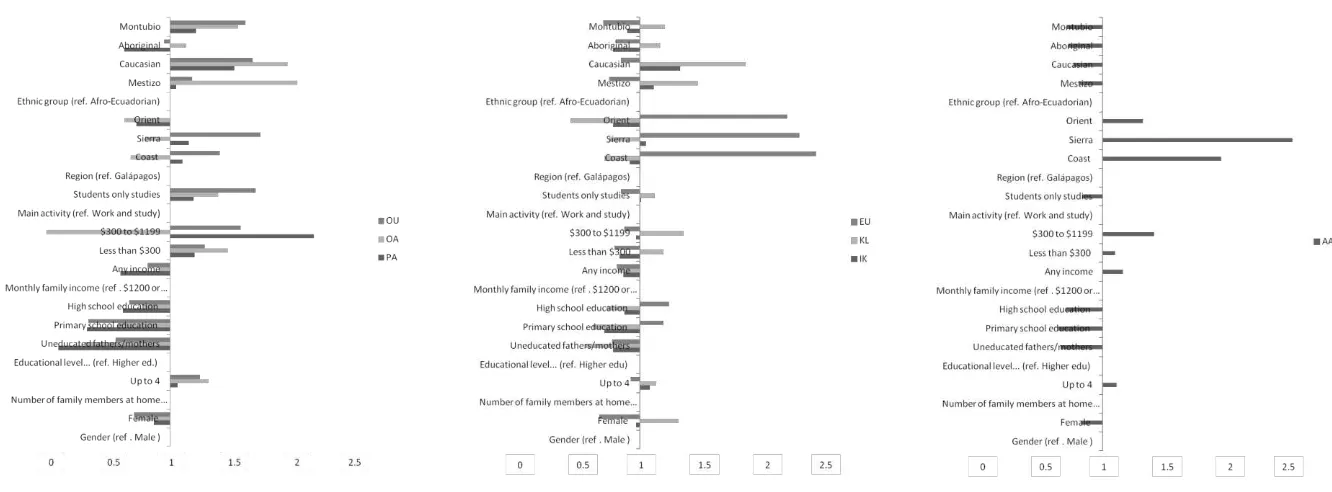
H1 is accepted. The sociodemographic variables have a greater influence on physical access, R2 (PA) = .14, and operational use of the Internet, R2 (OA) = .09; R2 (OU) = .11, than on more complex levels, such as media/informational knowledge, R2 (IK) = .01; knowledge of language, R2 (KL) = .04; expressive use, R2 (EU) = .02; and academic achievement, R2 (AA) = .03 (see Figure 3).
H2 is partially accepted. Men are more likely than women to have a high level of OA, Exp(B) = .72, p < .001; OU, Exp(B) = .71, p < .001; EU, Exp(B) = .68, p < .001; and AA, Exp(B) = .83, p < .05. It is also more likely that women, Exp(B) = 1.31, p < .001, have a higher level of KL on the Internet than do men.
H3 is partially accepted:
• It is more likely that students whose fathers/mothers have a university degree have a high level of PA than those whose fathers/mothers have no education, Exp(B) = .10, p < .001; with primary education, Exp(B) = .33, p < .001; or secondary education, Exp(B) = 62, p < .001.
• It is more likely that students whose fathers/mothers have a university degree have a higher level of OU than those whose fathers/mothers have primary education, Exp(B) = .34, p < .001, or secondary education, Exp(B) = .67, p < .01.
• It is more likely that students whose fathers/mothers have a university degree have a higher IK level than those whose parents/mothers have primary education, Exp(B) = .72, p < .05.
• It is more likely that students whose fathers/mothers have a university degree have a higher level of KL than those whose fathers/mothers have a primary education degree, Exp(B) = .63, p < .001, or secondary education degree, Exp(B) = .74, p < .01.
• It is more likely that students whose fathers/mothers have a university degree have a higher level of AA than those whose fathers/mothers have no education, Exp(B) = .67, p > .05; with primary studies, Exp(B) = .65, p < .001; or secondary education, Exp(B) = .71, p < .001.
In general, H4 is not accepted:
• It is more likely that students whose family income is high have a high level of PA to the Internet than those without family income, Exp(B) = .60, p < .001. However, this is less likely than those students with an average household income level ($300–$1,199), Exp(B) = 2.16, p < .001.
• It is more likely that students whose family income is low (<$300), Exp(B) = 1.47, p < .001, or intermediate ($300–$1,199), Exp(B) = 1.92, p < .001, have a higher level of OA than those with higher household incomes (≤$1,200).
• It is more likely that students whose family income is intermediate ($300–$1,199), Exp(B) = 1.57, p < .001, have a higher level of OU than those with higher household incomes (≤$1,200).
• It is more likely that students whose family income is intermediate ($300–$1,199), Exp(B) = 1.35, p < .01, have a higher level of KL than those with higher household incomes (≤$1,200).
• It is more likely that students whose monthly family income is high (≥$1,200) have a higher level of CU than those whose family income is lower.
• However, it is more likely that students whose family income is intermediate ($300– $1,199), Exp(B) = 1.41, p < .01, have a higher level of AA than those with higher household incomes (≤$1,200).
H5 is relatively accepted since this probability is only significant for the OA, Exp(B) = 1.31, p < .01, and OU, Exp(B) = 1.24, p < .05, that is, at the operational level.
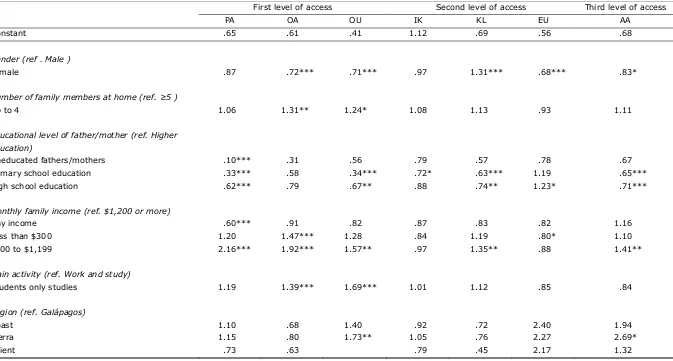
Table 4. Results of the Logistic Regression.
First level of access Second level of access Third level of access
PA OA OU IK KL EU AA
Constant .65 .61 .41 1.12 .69 .56 .68
Gender (ref . Male )
Female .87 .72*** .71*** .97 1.31*** .68*** .83*
Number of family members at home (ref. ≥5 )
Up to 4 1.06 1.31** 1.24* 1.08 1.13 .93 1.11
Educational level of father/mother (ref. Higher education)
Uneducated fathers/mothers .10*** .31 .56 .79 .57 .78 .67
Primary school education .33*** .58 .34*** .72* .63*** 1.19 .65***
High school education .62*** .79 .67** .88 .74** 1.23* .71***
Monthly family income (ref. $1,200 or more)
Any income .60*** .91 .82 .87 .83 .82 1.16
Less than $300 1.20 1.47*** 1.28 .84 1.19 .80* 1.10
$300 to $1,199 2.16*** 1.92*** 1.57** .97 1.35** .88 1.41**
Main activity (ref. Work and study)
Students only studies 1.19 1.39*** 1.69*** 1.01 1.12 .85 .84
Region (ref. Galápagos)
Coast 1.10 .68 1.40 .92 .72 2.40 1.94
Sierra 1.15 .80 1.73** 1.05 .76 2.27 2.69*
Ethnic group (ref. Afro-Ecuadorian)
Mestizo 1.05 2.03*** 1.18 1.11 1.46* .76 .82
White 1.52 1.95** 1.67 1.32 1.84* .85 .77
Aboriginal .63 1.13 .95 .79 1.16 .81 .73
Montubio 1.21 1.55 1.61 .90 1.20 .71 .72
Nagelkerke R2 .14 .09 .11 .01 .04 .02 .03
Chi-square 286.788*** 195.339*** 152.401*** 28.505* 88.932*** 46.825*** 66.267***
Discussion
This study was developed in Ecuador, a developing country in Latin America where in recent years progress of Internet access infrastructure has occurred. Ecuador is in position 82 on the Network Readiness Index (NRI: Bilbao-Osorio et al., 2014), in which 64% of the population has daily access to the Internet even though the bandwidth is usually slow (>2 to <10 Mbit/s; ITU, 2014). Although the frequency level of Internet use cannot confirm a significant gap when compared with more developed countries, a gap in terms of infrastructure, affordability, households with access, and insight into the socioproductive network persists (Bilbao-Osorio et al., 2014; ITU, 2014). Therefore, we believe that this physical access to the Internet gap with developed countries affects other levels of the gap, such as the type of use, literacy, and the benefits that citizens gain from use of the Internet in different spheres of life.
Regarding RQ1, this study, which was based on self-reporting by high school students, shows that while the level in their ability to access equipment and operational use is high, they have a way to go to reach an expressive use of and academic achievement due to the Internet. These results are similar to those found in other studies conducted in more developed countries that show high levels of technical skill among younger people but also detect gaps in critical and reflective skills (van Deursen & van Diepen, 2013).
Regarding RQ2, this study shows that sociodemographic factors―family status―have an influence, especially with regard to physical access and operational abilities, and it has little or no influence regarding abilities/knowledge and more complex Internet practices (e.g., van Deursen & van Dijk, 2015). It would seem that these findings refute the thesis that postulates that the influence of socioeconomic status is stronger, as measured in relation to the level of Internet access (e.g., Hargittai & Hinnant, 2008; van Dijk, 2006). However, it should be noted that the study is conducted in a context that is still in the process of overcoming the first level of access to Internet use, so its social benefits are not clearly evident.
Conclusions
In Ecuador, although the material and operational access divide is closing, new gaps are arising regarding the capacity of students to harness the potential of technology in expressive and educational spheres. This study focuses on a sector of the population―high school students―who will be the country’s workforce in the near future. We used a large representative sample stratified by province. With the use of descriptive statistics and multivariate analysis, the aim was to investigate the different levels of access to Internet use and to understand to what extent sociodemographic factors are associated with the capacity to obtain academic benefits from its use. In this sense, it was found that it was more likely that a student whose father/mother had a university degree had a high capacity of physical access and operational use. Therefore, a parent’s university degree was a factor associated with a high capacity of operational access to the Internet. Also, with respect to expressive use, students whose parents were university graduates were more likely to perform these activities on the Internet.
Therefore, the influence of family status on the capacity of Internet access in all its levels was relative. That is, although it was relevant to live in a family with an average educational and economic level, it did not guarantee that students were able to take advantage of the benefits that the Internet may bring in different spheres of life.
Finally, it was found that the sociodemographic factors had greater influence on the most basic levels—physical and operational—of access to Internet use than on more complex ones―informational knowledge, language, and expressive and academic use. Therefore, although it is necessary to ensure socioeducational status that allows for physical access to the Internet, policies also need to be set that allow citizens to learn to use the Internet as a media of expression and an academic resource.
Limitations
The first limitation of the study is the use of self-administered questionnaires, where the respondent expresses his or her opinion. However, while it is true that the use of observation is a more reliable technique, its application in studies where the sample size is very large and very dispersed is usually very expensive (van Deursen, van Dijk, & Peters, 2012).
Furthermore, although the structural factors (e.g., infrastructure, regulations, affordable prices to access Internet services) are highly important, in-depth studies analyzing the capabilities of citizens are recommended to make better use of the Internet ecosystem (van Deursen et al., 2015) that can be beneficial to different spheres of their lifespans in different parts of the world.
The use of models such as the use and gratifications theory (Papacharissi, 2008; Roy, 2014) are recommended, as they allow for associating different types of Internet use (van Deursen & van Dijk, 2014) with motivations, consequences, and media literacy in different cultures and regions of the world (see, e.g., Brandtzæg, Heim, & Karahasanović, 2011).
References
Barzilai-Nahon, K. (2006). Gaps and bits: Conceptualizing measurements for digital divide/s. The Information Society, 22(5), 269–278. doi:10.1080/01972240600903953
Bilbao-Osorio, B. A., Dutta, S., & Lanvin, B. (2014). The global information technology report. New York, NY: World Economic Forum.
Blank, G., & Groselj, D. (2014). Dimensions of Internet use: Amount, variety, and types. Information, Communication & Society, 17(4), 417–435. doi:10.1080/1369118x.2014.889189
Brandtzæg, P. B., Heim, J., & Karahasanović, A. (2011). Understanding the new digital divide—A typology of Internet users in Europe. International Journal of Human-Computer Studies, 69(3), 123–138. doi:10.1016/j.ijhcs.2010.11.004
Buckingham, D. (2007). Media education goes digital: An introduction. Learning, Media and Technology, 32(2), 111–119. doi:10.1080/17439880701343006
Celot, P., & Tornero, J. M. (2009). Study assessment criteria for media literacy levels: Final report. Brussels, Belgium: European Commission.
Chadwick, A. (2013). The hybrid media system: Politics and power. Oxford, UK: Oxford University Press.
Cheong, P. H. (2007). Gender and perceived Internet efficacy: Examining secondary digital divide issues in Singapore. Women’s Studies in Communication, 30(2), 205–228.
doi:10.1080/07491409.2007.10162513
Compaine, B. (2001). Re-examining the digital divide. In B. M. Compaine & S. Greenstein (Eds.), Communications policy in transition: The Internet and beyond (pp. 321–350). Cambridge, MA: MIT Press.
DiMaggio, P. J. E., & Hargittai, E. (2001). From the ‘digital divide’ to ‘digital inequality’: Studying Internet use as penetration increases (Working Paper 15). Princeton, NJ: Center for Arts and Cultural Policy Studies, Woodrow Wilson School, Princeton University.
Dixon, L. J., Correa, T., Straubhaar, J., Covarrubias, L., Graber, D., Spence, J., . . . Rojas, V. (2014). Gendered space: The digital divide between male and female users in Internet public access sites. Journal of Computer-Mediated Communication, 19(4), 991–1009. doi:10.1111/jcc4.12088
Dornaleteche, J., Buitrago, A., & Moreno, L. (2015). Categorization, item selection and implementation of an online digital literacy test as media literacy indicator. Comunicar, 44, 177–185.
doi:10.3916/C44-2015-19
Gunkel, D. J. (2003). Second thoughts: Toward a critique of the digital divide. New Media & Society, 5(4), 499–522. doi:10.1177/146144480354003
Haddon, L. (2000). Social exclusion and information and communication technologies: Lessons from studies of single parents and the young elderly. New Media & Society, 2(4), 387–406. doi:10.1177/1461444800002004001
Haight, M., Quan-Haase, A., & Corbett, B. A. (2014). Revisiting the digital divide in Canada: The impact of demographic factors on access to the Internet, level of online activity, and social networking site usage. Information Communication & Society, 17(4), 503–519.
doi:10.1080/1369118X.2014.891633
Harambam, J., Aupers, S., & Houtman, D. (2013). The contentious gap: From digital divide to cultural beliefs about online interactions. Information Communication & Society, 16(7), 1093–1114. doi:10.1080/1369118X.2012.687006
Hargittai, E., & Hinnant, A. (2008). Digital inequality differences in young adults’ use of the Internet. Communication Research, 35(5), 602–621. doi:10.1177/0093650208321782
Hindman, M. (2008). The myth of digital democracy. Princeton, NJ: Princeton University Press.
Hobbs, R. (2010). Digital and media literacy: A plan of action. Washington, DC: Aspen Institute.
Hogarth, J. M., Kolodinsky, J., & Gabor, T. (2008). Consumer payment choices: Paper, plastic, or electrons? International Journal of Electronic Banking, 1(1), 16–35.
doi:10.1108/02652320410542536
Ministry of Education. (2014). Master File of Educational Institutions. Administrative Registrations 2014-2015. [Consultation: November 2014]. Retrieved from https://educacion.gob.ec/amie/
ITU (International Telecommunication Union). (2014). Measuring the information society report. Geneva, Switzerland: International Telecommunications Union.
Kaiser, H. F. (1960). The application of electronic computers to factor analysis. Educational and Psychological Measurement, 20(1), 141–151. doi:10.1177/001316446002000116
Kolodinsky, J. M., Hogarth, J. M., & Hilgert, M. A. (2004). The adoption of electronic banking technologies by US consumers. International Journal of Bank Marketing, 22(4), 238–259.
doi:10.1108/02652320410542536
Kuttan, A. P., & Peters, L. (2003). From digital divide to digital opportunity. Lanham, MD: Scarecrow Press.
Livingstone, S., & Helsper, E. (2007). Gradations in digital inclusion: Children, young people and the digital divide. New Media & Society, 9(4), 671–696. doi:10.1177/14614448070803351
López, D., Callejo, G., & Cajiao, E. (2014). Evolución del consumo de Internet en el Ecuador entre los años 2010 al 2012: evidencia empírica de una ecología de la comunicación [Evolution of Internet consumption in Ecuador between 2010 and 2012: Empirical evidence of a communication ecology]. Revista ComHumanitas, 5(1), 19–30.
Milioni, D. L., Doudaki, V., & Demertzis, N. (2014). Youth, ethnicity, and a ‘reverse digital divide’: A study of Internet use in a divided country. Convergence: The International Journal of Research into New Media Technologies, 20(3), 316–336. doi:10.1177/1354856513517366
Mossberger, K., Tolbert, C. J., & Stansbury, M. (2003). Virtual inequality: Beyond the digital divide. Washington, DC: Georgetown University Press.
Papacharissi, Z. (2008). Uses and gratifications. In D. W. Stacks & M. B. Salwen (Eds.), An integrated approach to communication theory and research (pp. 137–152). Mahwah, NJ: Erlbaum.
Riggins, F. J., & Dewan, S. (2005). The digital divide: Current and future research directions. Journal of the Association for Information Systems, 6(12), 298–337.
Robinson, L. (2009). A taste for the necessary. Information, Communication & Society, 12(4), 488–507. doi:10.1080/13691180902857678
Roy, S. K. (2008). Determining uses and gratifications for Indian Internet users. Case Studies in Business, Industry and Government Statistics, 2(1), 78–91.
Schradie, J. (2011). The digital production gap: The digital divide and Web 2.0 collide. Poetics, 39(2), 145–168. doi:10.1016/j.poetic.2011.02.003
Selwyn, N. (2004). Reconsidering political and popular understandings of the digital divide. New Media & Society, 6(3), 341–362. doi:10.1177/1461444804042519
Servon, L. J. (2008). Bridging the digital divide: Technology, community and public policy. Hoboken, NJ: John Wiley & Sons.
Torres-Díaz, J. C., Duart, J. M., Gómez-Alvarado, H. F., Marín-Gutiérrez, I., & Segarra-Faggioni, V. (2016). Usos de Internet y éxito académico en estudiantes universitarios [Internet use and academic success in university students]. Comunicar: Revista Científica de Comunicación y Educación, 24(48), 61–70. doi:10.3916/C48-2016-06
van Deursen, A. J. A. M., & van Diepen, S. (2013). Information and strategic Internet skills of secondary students: A performance test. Computers & Education, 63, 218–226.
doi:10.1016/j.compedu.2012.12.007
van Deursen, A. J. A. M., & van Dijk, J. A. G. M. (2011). Internet skills and the digital divide. New Media & Society, 13(6), 893–911. doi:10.1177/1461444810386774
van Deursen, A. J. A. M., & van Dijk, J. A. G. M. (2014). The digital divide shifts to differences in usage. New Media & Society, 16(3), 507–526. doi:10.1177/1461444813487959
van Deursen, A. J. A. M., & van Dijk, J. A. G. M. (2015). Toward a multifaceted model of Internet access for understanding digital divides: An empirical investigation. The Information Society, 31(5), 379–391. doi:10.1080/01972243.2015.1069770
van Deursen, A. J. A. M., van Dijk, J. A. G. M., & Peters, O. (2012). Proposing a survey instrument for measuring operational, formal, information, and strategic Internet skills. International Journal of Human-Computer Interaction, 28(12), 827–837. doi:10.1080/10447318.2012.670086
population (2010 to 2013) over gender, age, education, and income. Telematics and Informatics, 32(2), 259–272. doi:10.1016/j.tele.2014.09.003
van Deursen, A. J., & Helsper, E. J. (2015). A nuanced understanding of Internet use and non-use among the elderly. European Journal of Communication, 30(2), 171–187.
doi:10.1177/0267323115578059
van Dijk, J. (2012). The evolution of the digital divide: The digital divide turns to inequality of skills and usage. In J. Bus, M. Crompton, M. Hildebrandt, & G. Metakides (Eds.), Digital enlightenment yearbook (pp.57–75). Amsterdam, Netherlands: IOS Press.
van Dijk, J. A. (2006). Digital divide research, achievements and shortcomings. Poetics, 34(4), 221–235. doi:10.1016/j.poetic.2006.05.004
Warschauer, M. (2002). Reconceptualizing the digital divide. First Monday, 7(7). doi:10.5210/fm.v7i7.967
Warschauer, M. (2004). Technology and social inclusion: Rethinking the digital divide. Cambridge, MA: MIT Press.
Weber, M. (1978). Economy and society: An outline of interpretive sociology. Berkeley, CA: University of California Press.
Werts, C. E., Linn, R. L., & Jöreskog, K. G. (1974). Intraclass reliability estimates: Testing structural assumptions. Educational and Psychological Measurement, 34(1), 25–33.
doi:10.1177/001316447403400104
Witte, J. C., & Mannon, S. E. (2010). The Internet and social inequalities. New York, NY: Routledge.
Yu, R. P., Ellison, N. B., McCammon, R. J., & Langa, K. M. (2015). Mapping the two levels of digital divide: Internet access and social network site adoption among older adults in the USA. Information, Communication & Society, 10(19), 1445–1464. doi:10.1080/1369118x.2015.1109695
Zhang, G., Wang, Q., & Kolodinsky, J. (2010). The digital divide in Internet information searching: A double-hurdle model analysis of household data from Vermont. First Monday, 15(11). doi:10.5210/fm.v15i11.3118
Appendix 1. Descriptive Results and Properties of Constructs.
Validity Reliability Unidimensionality
Mean (SD) Load factor
AVE Composite reliability
Cronbach Variance 1st factor
Eigenvalue 1st factor
Eigenvalue 2nd factor
Operative ability (OA)—Indicate your level of efficiency:
To receive and to make calls with a cellular phone 3.49 (.81) .48 .41 .80 .86 46.41% 4.64 1.67
To decode written or verbal message with a cellular phone 3.23 (.95) .70 To create, to modify, to save contacts in a cellular phone 3.40 (.86) .70 To configure alarms, sounds, hour, and date in a cellular
phone
3.49 (.83) .65
To create contact groups in a cellular phone 2.70 (.09) .66
To compress and unzip files 2.69 (1.02) .66
To install and sync devices 2.79 (1.19) .77
To install and replace operating systems 2.95 (.99) .79 To edit photos, videos, sounds digitally 3.03 (.96) .66 To transfer information among computers 2.76 (1.04) .65
Operative use (OU)—What frequency is Internet used:
To use e-mail in Internet 3.20 (.88) .74 .58 .89 .86 56.85% 3.98 1.02
To use multimedia tools 3.34 (.80) .77
To navigate Web pages 3.41 (.79) .79
To download and print information from the Web 3.32 (.84) .79
To download diverse software 2.50 (1.01) .75
To configure security options for cellular phone. 2.66 (.98) .75
To do online applications 2.22 (1.07) .65
Informational knowledge (IK)—Indicate your level of
National or international news agencies 2.40 (.83) .62 .46 .83 .88 47.35% 5.20 0.94
Sources of information 2.97 (.77) .62
Mass media sections 2.75 (.81) .67
Mass media ideology and ownership 2.55 (.88) .70
Access to scientific, valid and trustworthy information 2.44 (.86) .73
Organize scientific information 2.34 (.84) .73
Mass media to share scientific information 2.37 (.84) .72
Financing of mass media 2.51 (.87) .69
Regulation of contents of the information in mass media 2.37 (.83) .71
Copyright regulations and protocols 2.39 (.86) .68
Freeware licenses to work on the Internet (Creative Commons)
2.21 (.91) .64
Knowledge of languages (KL)—Indicate your level of
knowledge:
Audiovisual forms of expression (e.g., formats, sound, angle, color, planes)
2.50 (.86) .77 .40 .72 .78 61.03% 2.44 0.63
Written forms of expression (e.g., formats, angle, color, planes)
2.73 (.81) .82
Expression and oral communication 2.79 (.90) .72
Organize information and content on the Internet 2.87 (.84) .79
Expressive use (EU)—What frequency is Internet used:
To comment in blogs 2.24 (.98) .77 .54 .85 .86 66.10% 3.30 0.65
To create blogs 2.10 (.98) .84
To create articles in wikis 1.83 (.95) .88
To create wikis 1.81 (.95) .87
Academic achievement (AA)—What frequency is Internet used:
To organize academic or cultural courses/events 2.26 (1.01) .74 .58 .89 .90 61.21% 4.89 0.79
To work in teams, video, conference (e.g., Skype, Adobe Connect)
2.32 (1.03) .77
To create academic contents in teams across wikis 1.85 (.95) .79 To create academic contents in teams across blogs 1.96 (.96) .79 To create multimedia presentation content 2.32 (1.04) .74
To perform academic work in teams 2.27 (1.03) .75
To coordinate online work in teams 2.19 (1.04) .75
To access reliable sources of information in teams 2.32 (1.03) .65
Physical access (PA)
Numbers of computers in household (from 1 to 4 [more than 3])
2.17 (.78) .74 .30 .54 .62 57.39% 1.72 0.77
Internet Access in household (from 1 [no access] to 4 (broadband])
2.28 (.88) .84
Internet Access on cell phones (from 1 [no access] to 4 (broadband])