11 (2000) 295 – 315
Relatedness and coherence in technological and
product diversification of the world’s largest
firms
Lucia Piscitello *
Dipartimento di Economia e Produzione,Politecnico di Milano,P.za L. da Vinci 32, 20133 Milan, Italy
Received 12 May 1998; received in revised form 24 February 2000; accepted 17 March 2000
Abstract
The present paper investigates relatedness and coherence with reference to both product and technological diversification. In particular, it is argued that: (i) relatedness can be disentangled into three dimensions: industry-, technology- and firm-specific; and that (ii) coherence refers to both product and technological diversification. We provide empirical support of our premises with a study of a large cross-firm panel of technological and economic activity for 248 large firms over the period 1977 – 1995. The results support the view that large firms’ diversification processes are characterised by product-based coherence at the beginning of the period considered, and by technology-based coherence more recently. © 2000 Elsevier Science B.V. All rights reserved.
JEL classification:L2; O33
Keywords:Corporate diversification; Relatedness; Coherence; Competencies
www.elsevier.nl/locate/econbase
1. Introduction
Diversification has long been studied as a broad topic. The economic and managerial literature has paid extensive attention to corporate diversification, emphasising the benefits from diversification in terms of lower costs and
risk-* Tel.:+39-2-23992740; fax: +39-2-23992710. E-mail address:[email protected] (L. Piscitello).
spreading, as would arise from the exploitation of economies of scale and scope by firms. Nonetheless, diversification has still largely focused upon the reasons for, and the nature of, product diversification (Rumelt, 1974; Bigadikke, 1979; Didrichsen, 1982; Pavitt et al., 1989; Montgomery, 1994), for which the concepts of relatedness and coherence have been specifically developed. These concepts led to the perception that, by diversifying into related product markets or areas which lie ‘close’ into the firms’ existing profiles of competencies, those firms could grow and attain economies of scale and scope (Chandler, 1990). In this way the firm is able to diversify and expand whilst corporate coherence is maintained.
More recently, these issues have begun to be extended to the concept of corporate technological diversification (e.g. Granstrand and Sjo¨lander, 1992; Granstrand et al., 1997; Pavitt, 1999), meaning the diversification of the firm’s technological competencies. In accordance with Penrose’s resource-based view of the firm as a collection of productive assets, and with the more recent competence-based theory of the firm (Richardson, 1972; Winter, 1987, 1988; Loasby, 1991; Nelson, 1991; Foss, 1993; Cantwell, 1994; Teece et al., 1994), in which the firm is seen as an institution that constructs capabilities through internal learning processes in the form of evolutionary experimentation, firms extend their capabilities into ‘closely’ related fields of production and technology. Therefore, firms do not diversify in a random way. Instead, most of them display a pattern and logic to both the product and the technological diversification choices.
Nonetheless, although several approaches have been so far suggested in the literature in order to capture the ‘orientated patterns’ (Cainarca and Mariotti, 1985), the ‘coherence’ (Dosi et al., 1992; Teece et al., 1994) or the ‘purposiveness’ (Scott, 1993) of corporate product diversification, there remains great ‘fuzziness’ over what the concept of relatedness does actually include.
In this context, the purpose of the present paper is twofold:
1. to suggest an alternative multidimensional interpretation of relatedness which distinguishes between: (i) industry-specific, (ii) technology-specific, and (iii) firm-specific aspects; and
2. to measure and investigate the coherence with reference to both the technolog-ical and the product diversification patterns pursued by large firms.
These are both quite novel contributions to the literature in the field, as — to our knowledge — previous studies have neither considered multi-dimensional measures of relatedness, nor applied the concept of coherence to the diversifica-tion of technological activities by the firm.
2. Relatedness and coherence: a theoretical framework
The theoretical and empirical literature has extensively investigated firms’ growth through diversification. The most recent studies observe that the world’s largest firms are not just multi-product, but typically and increasingly multi-technology too (Oskarsson, 1993; Patel and Pavitt, 1994; von Tunzelmann, 1995; Granstrand et al., 1997).
In both these contexts, a central issue is what determines the direction of firm diversification, and in particular whether they diversify into related or unrelated lines of business (Teece, 1982). Nonetheless, much of the discussion on relatedness and coherence has been so far applied to the level of products, and to the possibility of expanding product ranges whilst maintaining coherence (Dosi, 1982, 1988; Dosi et al., 1992; Teece et al., 1994).
That a fundamental part of any firm’s corporate strategy is its choice of what portfolio of businesses to compete in, and that related diversification in product terms outperforms unrelated diversification (Wernerfelt, 1984; Barney, 1991; Markides and Williamson, 1994; Robins and Wiersema, 1995), are well-established propositions. However, there is still disagreement about what the concept of relatedness does precisely include.
According to Edith Penrose’s theory of diversified growth (Penrose, 1959), unused productive services are a selective force in determining the direction of expansion. Excess resources are most often employed in similar settings, i.e. firms prefer to enter industries where the resource characteristics — the level of capital intensity, the level of sales intensity, the level of R&D intensity — are similar to their own resource profiles. More specifically, firms seem to choose to enter industries that are close to their existing line of business, since the enterprise’s firm-specific resources help drive its diversification strategy. However, Penrose herself recently argued that ‘there is no reason why a firm should see its prospects of growth, its productive opportunities, in terms of its existing products only; there are many reasons why it should see them in terms of its productive resources and its knowledge, and should search for opportunities of using them more efficiently’ (Penrose, 1995). Other studies, characterising corporations by boundaries which relate to their shared firm-specific assets (Winter, 1987) and their multi-product scope (Teece, 1982), have shown that firms do not diversify in a random way (e.g. Teece et al., 1994).
Nevertheless, despite the noteworthy amount of theoretical studies, the empirical measures of relatedness and coherence hitherto suggested provide only a partial picture of the scope of the firm to exploit interrelationships between sectors and technologies. The focus is predominantly on industry- and technology-specific characteristics of sectors (Markides and Williamson, 1994). Pairs of sectors can be thought of as similar:
1. if they are vertically related or integrated;
2. if they have technology-based inter-sectoral linkages (or technological spillovers);
In other words, relatedness is considered as a concept exclusively associated with the inherent properties of the sectors. As such, firms can know a priori and exploit them in order to develop and maintain competitive advantages over their rivals. More recently, a wider concept of relatedness which also embodies firm-specific aspects (capabilities and technological competencies) has been suggested (Dosi et al., 1992, 2000; Teece et al., 1994). It is based on the idea that a firm does not know what is related until trying it out.
Relatedness and coherence are essentially cognitive and firm-specific concepts. Coherence is the result of a trial-and-error process, and what may be related diversification and coherent organisation for one firm, may not be so for another firm. The firm becomes an experimental device for selection: by exploring new combinations of capabilities, the firm incrementally and cumulatively learns which capabilities are related, and collects these together within its organisation as a coherent whole (Cantwell, 1998). Consequently, coherence could then be seen in a dynamic context as the firm’s capacity to exploit and explore complementarities between a diversity of stocks of dispersed knowledge and localised learning processes (Foss and Christensen, 1996).
In this context, the present paper argues that:
1. the concept of relatedness amongst sectors must include all the dimensions separately suggested by the previous literature, as well as an additional firm-spe-cific dimension; and
2. the notion of coherence, as discussed with reference to product diversification, is applicable in the case of technological diversification too. Indeed, as in the case of product diversification where ‘coherence is exhibited when a firm’s lines of business are related in that there are certain technological and market character-istics common to each’ (Teece et al., 1994), one would expect technological coherence to be exhibited when certain underlying scientific or engineering knowledge is common to each relevant technological area (e.g. Breschi et al., 1998).
Other authors (e.g. Scott, 1993) have recently argued that the diversification of R&D within the firm is not random, that is the firm diversifies its R&D effort purposively to gain advantage of better appropriability, or because of cost advan-tages of common facilities or complementarities in the process of research across multiple industries1. Moreover, identifying and integrating competencies essential for the corporation almost inevitably requires investment in in-house learning and
1It is worth observing that the coherence of the technology base has been recently associated with the
patient experimentation, with the expectation of finding winning combinations of technologies, as where the technological relatedness lies may be unclear a priori2 (Granstrand et al., 1997).
3. The data
In order to analyse corporate diversification and to investigate the coherence issue through the multi-dimensional type of relatedness suggested above, we considered both product and technological diversification straategies of the world’s largest firms. Several studies have extensively shown that large multi-divisional firms are the largest single source of the new technological knowledge. Indeed, they perform most of the R&D activities, employ most of the qualified research scientists and engineers, perform and publish most of the corporate basic research, and maintain the closest links with academic research (Pavitt, 1999). They also con-tribute to the development of knowledge and products for their suppliers of production equipment, components and software (Rosenberg, 1963; Patel and Pavitt, 1994).
Corporate diversification has been examined using data on world’s largest firms sales and patenting activities in the United States for the period 1977 – 1995. Specifically, we considered 248 US, European and Japanese worlds’ largest indus-trial companies (as listed in Dunning and Pearce (1985) with a few additions of companies apparently missed from the Fortune listings). The sample chosen is stratified in order to include firms from the whole sectoral and geographical spectrum. The consolidated firms are allocated to their primary industry of output according to the product distribution of their sales, so that firms have been divided into 18 industrial groups (see Appendix A). In order to analyse business diversifica-tion, product distribution of sales has been allocated over 42 sectors (26 manufac-turing and 16 services sectors, see Appendix B). Such data have been collected at Politecnico di Milano.
Technological diversification of firms relates to their patenting activity in the USA. The corporate patenting was divided into 56 technological fields (see Ap-pendix C), derived from the US patent class system.
Patent statistics present a potentially very rich source of empirical evidence on questions related to technology. The advantages and disadvantages of using US patents as an indicator of technological activity are well known and quite widely discussed in the literature (e.g. Schmookler, 1950, 1966; Basberg 1983, 1987; Pavitt, 1985, 1988; Jaffe, 1986; Archibugi, 1992). Though recognising some potential limitations of the US patenting measure, mainly related to the fact that patents measure codified knowledge whereas a high proportion of firm-specific competence
2For instance, firms from certain chemical sectors sometimes move into areas of competence
is tacit (or non-codified) knowledge, studies like Patel and Pavitt (1997) have shown that other measures that embody tacit knowledge (such as R&D expenditure, or judgement of technological peers) give results that are very similar to those obtained using US patenting.
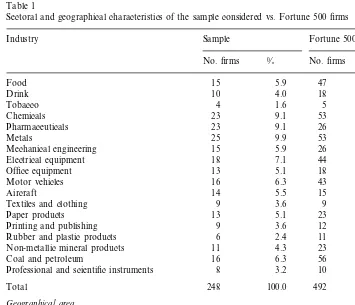
Sectoral and geographical characteristics of firms constituting our sample are reported in Table 1. The comparison with the relevant characteristics of the Fortune 500 firms (also reported in Table 1) allows to assess the balance of the sample.
4. The three dimensions of relatedness
In order to investigate firms’ diversification patterns in the period considered, and particularly whether they moved into related or unrelated areas of activity, we developed a survivor measure of relatedness. According with Teece et al. (1994), this measure is based on the principle that economic competition will lead to the
Table 1
Sectoral and geographical characteristics of the sample considered vs. Fortune 500 firms
Industry Sample Fortune 500 (1993)
No. firms % No. firms %
Mechanical engineering 15 5.9 26 5.2
18 44 8.8
Electrical equipment 7.1
3.6
Office equipment 13 5.1 18
6.3
Textiles and clothing 9
13
Paper products 5.1 23 4.6
12 3.6
9
Printing and publishing 2.4
11
2.4 2.2
Rubber and plastic products 6
4.3 23
Professional and scientific instruments
Total 248 100.0 492 98.4
disappearance of relatively inefficient organisational forms (Stigler, 1961). There-fore, the underlying assumption is that the activities in sectors which are more related will be more frequently combined within the same firm. Thus, if corpora-tions which engage activity in sectorialmost always engage activity also in sector
j, then these two sectors are likely to be related.
Accordingly, considering the universe as constituted byKfirms (= 1,...,k,...,K), it is possible to define:
Cik=1 if firm k is active in sector i, and 0 otherwise;
mk=iCik=the number of activities3 of firm k;
ni=kCik=the number of firms active in sectori Therefore:
Jij=kCikCjk=the number of firms which are active in both sectoriand sector
j;
mij=E(xij)=the expected number of firms active in both sector i and sector j, under the hypothesis that diversification is random.
In order to operationalise the random hypothesis, we consider the numberxijof firms active both in sectoriandjas a hypergeometric random variable. Therefore, with populationK, and specific participantsniandnj, random diversification would imply4:
mij=E(xij)=ninj/K
s2ij=mij[(K−ni)/K)][(K−nj)/(K−1)]
If the actual numberJijof linkages observed between sectoriand sectorjgreatly exceeds the expected numbermij, then the two sectors are highly related. Therefore, the measure of relatedness between sector i and sectorj is:
RELATij=(Jij−mij)/sij
which, by analogy with a t-statistic, measures the degree to which the observed linkage between the two sectors exceeds that which could be expected if the assignments of activities were simply random.
In order to avoid subjectivity problems, the data employed to evaluate related-ness between industries refer to the data obtained from the 1985 Trinet Large Establishment data set5. The values of RELAT
ijrange from a minimum of −18.85
3Following the notation adopted in Teece et al. (1994), activity has been defined as the operation of
a firm in a sector.
4It is perhaps worth reminding that the hypergeomentric distribution is derived from a sampling
without replacement, which is the most appropriate for the case under study. Indeed, it can be associated to an experiment in which we are interested in the probability of drawing a firmkactive in sectoriafter drawing the same firmkactive in sectorjfrom the universe of pairs (firm, sector).
5The Trinet data set provides information on every establishment in the United States with over 20
(between Holding services and Distribution services) to a maximum of 46.22 (between Holding services and Financial services). The average relatedness is 3.20 and the standard deviation is 6.47.
The hypothesis developed in this paper is that relatedness between sectors is only partially explained by industry-specific (i.e. vertical integration between sequential phases in the production chain, and market similarity) and technology-specific (technological spillovers) characteristics. In fact, the remaining unexplained vari-ance has mostly to do with firm-specific characteristics, that is with individual firms’ capabilities and competencies.
In order to test the multi-dimensional character of relatedness, we develop an econometric model. According whith previous theoretical and empirical studies, the variables considered as proxy for the different dimensions are the followings.
The industry-specific aspects of relatedness have been proxied by vertical integra-tion and market similarity. Specifically, as far as vertical integraintegra-tion is concerned, we evaluated the linkages between sectors as obtained from input/output tables6 (Eurostat, 1980). Accordingly, the variable VERTijis a dummy which assumes the value 1 if the two sectors i and j are sequential in the productive chain, and 0 otherwise.
The market similarity has been proxied by the variable MKTij, which is a dummy equals to 1 if two sectorsi andj are both oriented to the industrial market, and 0 otherwise.
The technology-based inter-sectoral linkages (or spillovers) have been proxied by an input – output measure of the interlinkages in terms of R&D flows (Scherer, 1982). Such a measure is consistent with a two-way interaction between sectors (Laursen and Meliciani, 1999). Thus, the variable TECH –LINKij is a dummy which assumes the value 1 if the two sectorsiandjhave high technological linkages in terms of R&D flows7
.
The firm-specific aspect has been proxied by the affinity or proximity in the underlying technological competencies8. The firm’s idea is that firms require
spe-6We considered as the critical value a share of 5%. Other studies (e.g. Orecchia, 1998) consider a
critical value of 3%, but the results obtained are very similar in both cases.
7The cut-off point considered, in accordance with a sensitivity analysis run for different values, is
US$15 millions in Scherer’s table. Our choice of R&D flows as indicators for technological spillovers obviously implies that we take a limited perspective on the issue. Spillovers are much broader than what is captured by our indicator. Griliches (1979) distinguishes between two types of spillovers, i.e. rent spillovers and pure knowledge spillovers. Like all the studies considering R&D as a neasure of spillovers, we are within the interpretation of rent spillovers (Coe and Helpman, 1995; Laursen and Meliciani, 1999).
8Other approaches have been suggested. Among the most recent, Engelsman and van Raan (1994)
cialised technological competence in order to produce attractive products by efficient methods in their respective industries. The firm’s competencies con-struction activity proceeds purposively (Markides, 1995, 1996) through an evolu-tionary learning process, based on trial and error which is gradual and path-dependent. Therefore, the affinity between the technological profiles of sectors determines firms’ diversification into them. Consequently, it helps explain their relatedness.
According to the survivor principle, innovative activities (and therefore, compe-tencies) in related technological fields would be more frequently combined within the same firm. In order to build a proxy for this dimension of relatedness, the analytical framework used in Teece et al. (1994) has been applied to the firms’ technological competencies. By measuring the firms’ technological competencies through their patenting activity in the relevant technological fields, it is possible to define9
:
Pik=1 if firmkhas been granted at least one patent in technological fieldi, and 0 otherwise;
rk=iPik=the number of technological fields in which the firm k patents;
si=kPik=the number of firms patenting in technological field i Therefore:
Yij=kPikPjk=the number of firms patenting in both technological field iand
j;
nij=E(xij)=the expected number of firms patenting in both technological fieldi and j, under the hypothesis that technological diversification is random. Considering the numberxijof firms which patent in both technological fieldiand
jas a hypergeometric random variable, it will be:
gij=E(xij)=ninj/K
s2ij=mij[(K−ni)/K)][(K−nj)/(K−1)]
Therefore, if the actual number Yij of linkages observed between technological fieldiandjgreatly exceeds the expected number nij, the two technological fields are highly related. The measure of the technological competence-based relatedness between fieldsi and j, is:
COMPETij=(Yij−gij)/sij
The values of COMPETijrange from a minimum of −2.53 (between field 40, i.e. motor vehicles and components, and fields 20, food products, and 21, tobacco products) to a maximum of 27.57 (between food products and tobacco products). The average value is 6.06 and the standard deviation is 3.94.
9Again, in order to limit subjectivity problems, the data refer to the whole data set on patents
Table 2
Correlation matrix
VERT TECH –LINK MKT
RELAT COMPET
RELAT 1
COMPET 0.456 1
VERT 0.403 0.188 1
TECH –LINK 0.139 0.149 0.124 1
0.276 0.093
MKT 0.398 0.230 1
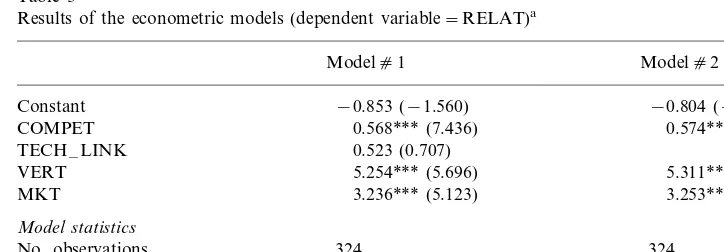
Table 3
Results of the econometric models (dependent variable=RELAT)a
Modelc1 Modelc2
−0.804 (−1.484)
Constant −0.853 (−1.560)
0.574*** (7.582)
COMPET 0.568*** (7.436)
0.523 (0.707) TECH –LINK
5.254*** (5.696) 5.311*** (5.785) VERT
3.236*** (5.123) 3.253*** (5.157) MKT
Model statistics
324
No. observations 324
61.490***
Regression,F 46.171***
0.358
AdjustedR2 0.359
aNotes: thet-statistics are reported in parentheses (all are two-tail tests).
*** Significant atPB0.01. 4.1.The econometric model
In order to investigate whether the relatedness between two sectors i and j
depends on industry-, technology- and firm-specific dimensions, we modelled the dependent variable RELATijas a function of the variables described in the previous section10. Such a model has been estimated by OLS.
Before running the regression, we performed a correlation analysis in order to detect if any problem of multicollinearity amongst the variables existed (see Table 2). RELAT shows a noteworthy correlation with COMPET (r=0.456), but also with VERT (r=0.403) and MKT (r=0.398). The independent variables do not show any multicollinearity problems, as the highest simple correlation is that between MKT and VERT (r=0.276).
The results of the regression are reported in Table 3. In particular, Model 1 illustrates the regression in which all the independent variables are jointly tested,
10It is worth observing thatiandjconcern here only industrial activities (i.e. the 26 sectors described
while Model 2 represents the best specification obtained. The econometric results support the hypothesis that relatedness among sectors depends on:
industry-specific factors. The proximity in the productive chain, VERT, shows a positive coefficient significantly different from zero at PB0.01 in both the
models. Likewise, the proxy for the market similarity, MKT, is always significant at PB0.01;
the firm-specific dimension. The variable COMPET is always significant at
PB0.01 in both the models.
Interestingly, the technology-specific dimension proxied by TECH –LINK does not seem to influence the dependent variable significantly. Nonetheless, that might well reflect shortcomings in the measurement of technological specificity.
5. Coherence in technological and product diversification
The analysis of relatedness among sectors paves the way for the empirical investigation of coherence in the diversification patterns pursued by the firm.
Since coherence has been defined as the presence of relatedness in firms’ lines of business, it increases as the number of common characteristics found in each product line increases. Therefore, a firm fails to exhibit coherence when com-mon characteristics and competencies are allocated randomly across its lines of business.
Following Teece et al. (1994), coherence in the firm diversification patterns of product activities is defined as the firm’s co-presence in related sectors. A possible measure of coherence can be the weighted average relatedness in products (WARP). Specifically, WARPiis defined as the relatedness of sectori to all the other sectors in which the firm is active:
WARPi=%jRELATijsj/%jsj
wheresj represents the firm’s sales in sectorj.
Likewise, we could define the coherence for the firms’ technological diversifica-tion as the weighted average relatedness in technologies (WART). Specifically, WARTiis defined as the relatedness of the technological fieldito all the other fields in which the firm patents. WARTi is defined as follows:
WARTi=%jCOMPETijpj/%jpj
wherepjis the number of patents granted to the firm in technological field j. In order to investigate the dynamic aspects of coherence in firms’ diversification patterns, both WARPi and WARTi have been calculated in three different years (1977, 1986, 1995).
number of firms showing an index above the average also decreases, thus confirm-ing a decreasconfirm-ing coherence over time.
On the contrary, technological diversification in the same period remains a rather coherent process. The average value of WART tends to remain rather stable over the whole period, while the number of firms with a coherence index above the average slightly increases.
This preliminary descriptive statistical analysis highlights that corporate coher-ence is increasingly associated with the firms’ moves into new technological areas more than into new product activities.
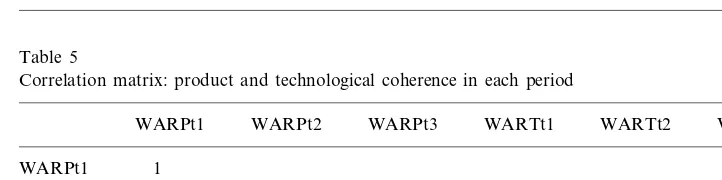
Additionally, the analysis can offer suggestions about the dynamics of coherence in the decades considered. The analysis of the correlation matrix for those variables in each period (see Table 5) suggests that coherent strategies pursued by firms are cumulative (or path-dependent). In particular, this result holds more strongly at the beginning of the whole period considered for the diversification of product activities (the correlation coefficient between WARPt1and WARPt2is 0.742, while it is only 0.206 between WARPt2and WARPt3). Conversely, coherence in the firms’ diversifi-cation patterns of technological activities seems to be higher in the most recent period, though it is also considerable in the previous one (the correlation coefficient
Table 4
Coherence in product diversification (WARP) and in technological diversification (WART), in the three periods considered
Technological diversification (WART) Product diversification (WARP)
t2
t1 t2 t3 t1 t3
243 243 240
No. observations 200 213 217
11.57 10.08 10.39
Mean 11.12 10.79 5.09
2.67 2.23
6.42 6.91
S.D. 8.40 7.55
2.78 1.00 0.00
Min −6.74 −2.86 −3.82
56.95 31.48 29.00 79.52
Max 21.39 27.57
Coherence\mean6alue
77
95 133
100
No. of firms 99 141
50.00 55.42
% 44.60 35.48 41.42 58.02
Table 5
Correlation matrix: product and technological coherence in each period
WARPt1 WARPt2 WARPt3 WARTt1 WARTt2 WARTt3
WARPt1 1
WARPt2 0.742 1
0.206 0.258
WARPt3 1
WARTt1 0.020 0.030 0.270 1
0.433 1
WARTt2 −0.032 0.026 0.215
0.413 0.758 1
Table 6
Results of Kolmogorov–Smirnov testsa
WARPt3 WARTt2 WARTt3
WARPt2 0.083** (0.424) WARPt1
0.421 (0.000) WARPt2
0.235 (0.000) WARTt1
0.042** (0.987) WARTt2
aNotes: the adjustedP-value are reported in parentheses (two-sided test).
** Significant atPB0.05.
is 0.758 between WARTt2 and WARTt3, and 0.433 between WARTt1 and WARTt2).
In order to strengthen this result, we run the Kolmogorov – Smirnov test11 for the equality of coherence patterns over the period considered (see Table 6). It emerges that the coherence in diversification of product activities is more persistent at the beginning of the period considered. The equality of the two distributions WARPt1 and WARPt2can not be rejected, while it is rejected between WARPt2and WARPt3 at PB0.05. On the contrary, coherence in the firms’ diversification patterns of
technological activities is persistent in the most recent period. The observed data provide some evidence in support of the null hypothesis (that is, the equality of the distributions WARTt2 and WARTt3), while they do not seem to sustain it in the first period (in which the null hypothesis is rejected atPB0.05).
The findings support the view of the firm as a repository of accumulated competencies which are developed by firms themselves through a gradual learning process. This accumulation process takes place within the firm and provides it with the characteristics of technological persistence or path dependency (Fai, 1998; Cantwell and Fai, 1999a,b).
6. Conclusions
This paper has suggested a multi-dimensional concept of relatedness, and it has explored coherence in diversification processes pursued by large firms.
The literature has to date extensively studied relatedness as a concept exclusively based on industry and market similarities between sectors. On the contrary, the present study argued that relatedness must involve a firm-specific dimension too. Indeed, the firm acts as a selection mechanism, thus determining ex interiore what
11The Kolmogorov – Smirnov test (which is a non parametric test of two sample to determine a
is related and what is not. First empirical results confirmed the significance of the firm-specific dimension in reducing the proportion of unexplained variance.
As far as coherence is concerned, it has been traditionally investigated only with reference to product diversification. Instead, we argue that coherence is an impor-tant feature also for technological diversification. The analysis of a sample of the world’s largest firms over the last decades, confirmed that diversification does not proceed in a random way but coherently (Teece et al., 1994), purposively (Scott, 1993), in an ‘oriented’ domain (Cainarca and Mariotti, 1985) where firms are driven by competencies allowing them competitive advantages over their rivals.
Importantly, the empirical results confirmed this hypothesis both at the business level and at the technological level. However, technological diversification and product diversification followed coherent patterns in different periods. Specifically, product diversification undertaken by large firms was more coherent in the first period considered (roughly, late 1970s to mid-1980s). Technological diversification strategies along coherent paths predominate only more recently (from later 1980s to mid-1990s).
Additionally, the coherent patterns pursued by the firms in the diversification of their technological activities do not necessarily reflect a similar behaviour in diversification of products. Product diversification refers primarily to the exploita-tion of accumulated resources, usually to attain lower marginal costs. As far as technological coherence is concerned, whilst lowering the cost of developing a competence in a particular technology through economies of scope in the applica-tion of the underlying scientific or engineering principles remains, firms are even more concerned with which technologies can be used together strategically, how they might be combined to make better current goods and to produce them more efficiently, as well as which technologies could be used to produce new products and how. Technological diversification by firms has changed over time from broad to more focused diversification, thus implicitly recognising the coherence embodied in the process (Fai, 1998).
Finally, it is possible to draw some hints about the interrelationship between product and technological diversification. Recent empirical evidence (Markides, 1995; Gambardella and Torrisi, 1998) already showed that firms have recently reduced their product diversity but they have continued to increase the diversity of their technological base. Accordingly, our results suggest a growing independence of technological diversification from product diversification.
This constitutes a noteworthy step forward in the research field since, at least to our knowledge, no previous empirical attempts have tested ‘dynamic corporate coherence’ (Christensen, 1998b) at the technological competencies level. The present findings thus underpin a widespread but hitherto largely unsubstantiated belief about a major aspect of structural change in economic dynamics.
Acknowledgements
The author wishes to thank John Cantwell, Giovanni Dosi, Nick von Tunzel-mann, two anonymous Referees, and the participants in the Schumpeter Society Conference and the TSER Conference held in June 1998, in Vienna and Urbino, respectively, for helpful comments and suggestions on earlier versions of this paper. The usual disclaimer applies.
Appendix A. Primary industries of production
Description Industry no.
Food products 1
Drink products 2
Tobacco products 3
Chemicals and allied products 4
Pharmaceuticals 5
Metals 6
Mechanical engineering 7
Electrical equipment 8
Office equipment 9
Motor vehicles 10
Aircraft 11
Textiles products and clothing 12
13 Paper products
Printing and publishing 14
Rubber and plastic products 15
Non-metallic mineral products 16
Coal and petroleum products 17
Professional and scientific instruments 18
Appendix B. Description of the 42 sectors
Services Manufacturing
Sectors (definitions) No. Sectors (definitions) No.
Constructions
Mining 27
1
2 Food products 28 Transportations 3 Tobacco products 29 Communications
Furniture and fixtures 31 Distribution 5
Lumber, wood and paper products 32 Catering and hotels 6
Finance and investment 33
7 Printing and publishing
34
Chemicals and allied products Brokerage 8
Insurance 35
9 Petroleum and coal products
36
Rubber and plastic products Real estate 10
37
Leather and leather products Holding offices 11
Business services 38
12 Non-metallic mineral products
13 Primary metal industries 39 Informatics Leisure services Fabricated metal products
14 40
Electronic and other electrical
15 41 Health care services equipment 42 Miscellaneous service
industries Scientific instruments
16
17 Other transportation equipment Motor vehicles and components 18
Aircraft 19
20 Pharmaceuticals
21 Cosmetics and detergents 22 Computer and office equipment 23 Mechanical engineering
Appendix C. Description of the 56 technological fields
Technological fields No. Technological fields No.
Other general industrial 29
Food and tobacco products 1
Distillation processes equipment 2
30 Mechanical calculators and 3 Inorganic chemicals
4 Agricultural chemicals typewriters Power plants
Cleaning agents and other Telecommunications 7 9 Synthetic resins and fibres 35
Image and sound equipment 36
Bleaching and dyeing 10
Other organic compounds 37 Illumination devices 11
39 Other general electrical 12 Pharmaceuticals and
biotechnology equipment 40
13 Metallurgical processes Semiconductors 41
14 Miscellaneous metal products Office equipment and data pro-Food, drink and tobacco
15 cessing systems
equipment 42 Internal combustion engines Motor vehicles
16 Chemical and allied equipment 43
17 Metal working equipment 44 Aircraft
18 Paper making apparatus 45 Ships and marine propulsion Railways and railway equipment 19 Building material processing 46
equipment 47 Other transport equipment 48
Assembly and material handling Textiles, clothing and leather 20
equipment 49 Rubber and plastic products 21 Agricultural equipment 50 Non-metallic mineral products 22 Other construction and excavat- 51 Coal and petroleum products
ing equipment 52 Photographic equipment Mining equipment
23 53 Other instruments and controls 24 Electrical lamp manufacturing 54 Wood products
25 Textile and clothing machinery 55 Explosive combustions and Printing and publishing
26 charges
machinery 56 Other manufacturing and non-27 Woodworking and machinery industrial
Other specialised machinery 28
Appendix D. Aggregation of 56 technological fields according to the 26 manufacturing sectorsa
No. Technological fields Sectors
Food products+tobacco products Food and tobacco products
1
Distillation processes Chemicals and allied products+
2
drinks products
Chemicals and allied products Inorganic chemicals
3
Chemicals and allied products 4 Agricultural chemicals
Chemicals and allied products Chemical processes
5
Chemicals and allied products Photographic chemistry
6
Cosmetics and detergents Cleaning agents and other
7
compositions
8 Disinfecting and preserving Chemicals and allied products Chemicals and allied products Synthetic resins and fibres
9
Chemicals and allied products Bleaching and dyeing
10
Pharmaceuticals Pharmaceuticals and biotechnology
12
Metallurgical processes Primary metal industries 13
14 Miscellaneous metal products Fabricated metal products Mechanical engineering Food, drink and tobacco equipment
15
Mechanical engineering Chemical and allied equipment
16 Assembly and material handling
20
equipment
21 Agricultural equipment Mechanical engineering Mechanical engineering Other construction and excavating
22
equipment
23 Mining equipment Mining+mechanical engineering Electrical lamp manufacturing Electronic and other electrical 24
equipment
25 Textile and clothing machinery Mechanical engineering
Printing and publishing machinery Printing and publishing+mechanical 26
engineering
Woodworking and machinery Mechanical engineering 27
Mechanical engineering Other specialised machinery
28
Mechanical engineering Other general industrial equipment
29
30 Mechanical calculators and Computer and office equipment typewriters
Electronic and other electrical Power plants
31
equipment
Nuclear reactors Fabricated metal products 32
Telecommunications Electronic and other electrical 33
equipment
34 Other electrical communication Electronic and other electrical systems equipment
Special radio systems
35 Electronic and other electrical equipment
Image and sound equipment
36 Scientific instruments
Electronic and other electrical Illumination devices
37
equipment
38 Electrical devices and systems Electronic and other electrical equipment
39 Other general electrical equipment Electronic and other electrical equipment
40 Semiconductors Electronic and other electrical equipment
Mechanical engineering Internal combustion engines
42
43 Motor vehicles Motor vehicles and components Aircraft
44 Aircraft
Other transport equipment Ships and marine propulsion
45
46 Railways and railway equipment Other transport equipment Other transport equipment Other transport equipment
47
Textile, mill products and cloth-Textiles, clothing and leather
48
ing+leather and leather products 49 Rubber and plastic products Rubber and plastic products
Non-metallic mineral products 50 Non-metallic mineral products
Petroleum and coal products Coal and petroleum products
51
Scientific instruments Photographic equipment
52
Scientific instruments Other instruments and controls
53
Lumber, wood and paper prod-Wood products
54
ucts+furnitures and fixtures 55 Explosive combustions and charges Chemicals and allied products
Leisure products+miscellaneous Other manufacturing and
non-56
industrial
aWhen necessary, technological field has been split and incorporated into
aggregation of two different sectors.
References
Archibugi, D., 1992. Patenting as an indicator of technological innovation: a review. Science and Public Policy 19, 357 – 358.
Barney, J.B., 1991. Firm resources and sustained competitive advantage. J. Manag. 17, 99 – 120. Basberg, B.L., 1983. Foreign patenting in the US as a technology indicator. Res. Policy 12, 227 – 237. Basberg, B.L., 1987. Patents and the measurement of technological change: a survey of the literature.
Res. Policy 16, 131 – 141.
Bigadikke, E., 1979. Corporate Diversification, Entry, Strategy and Performance. Harvard University Press, Boston, MA.
Breschi, S., Lissoni, F., Malerba, F., 1998. Knowledge proximity and firms’ technological diversification. Mimeo, CESPRI-Bocconi University, Milan.
Cainarca, G.C., Mariotti, S., 1985. I sentieri della diversificazione orientata: un’analisi empirica dei comportamenti delle grandi imprese statunitensi. Econ. Polit. Ind. 46, 47 – 90.
Cantwell, J.A., 1994. Introduction. In: Cantwell, J.A. (Ed.), Transnational Corporations and Innovatory Activities. Routledge, London.
Cantwell, J.A., 1998. Knowledge, capabilities, imagination and cooperation in business: introduction. J. Econ. Behav. Organ. 35, 1 – 4.
Cantwell, J.A., Fai, F., 1999. ‘Firms as the source of innovation and growth: the evolution of technological competence’. J. Evol. Econ. 9, 331 – 366.
Cantwell, J.A., Fai, F., 1999. The changing nature of corporate technological diversification and the importance of organisational capability. In: Dow, S., Earl, P. (Eds.), Economic Knowledge and Economic Co-ordination: Essays in Honour of Brian J. Loasby. Edward Elgar, Cheltenham. Chandler, A.D., 1990. Scale and Scope: the Dynamics of Industrial Capitalism. Harvard University
Christensen, J.F., 1998a. Strategy and structure and the management of technology base in multi-product companies. In: Coombs, R., Green, K., Richards, A., Walsh, V. (Eds.), The Organisational Dimensions of Technical Change. Edward Elgar, Aldershot.
Christensen, J.F., 1998b. The dynamics of the diversified corporation and the role of central manage-ment of technology. DRUID working paper no. 98-4.
Coe, D.T., Helpman, E., 1995. International R&D spillovers. Eur. Econ. Rev. 39, 859 – 887.
Didrichsen, J., 1982. The development of diversified and conglomerate firms in the United States, 1920 – 1970. Business Hist. Rev. 46.
Dosi, G., 1982. Technological paradigms and technological trajectories: a suggested interpretation of the determinants of directions of technical change. Res. Policy 11, 147 – 162.
Dosi, G., 1988. Sources, procedures, and microeconomics effects of innovation. J. Econ. Lit. 26, 1120 – 1171.
Dosi, G., Teece, D.J., Winter, S., 1992. Toward a theory of corporate coherence: preliminary remarks. In: Dosi, G., Giannetti, R., Toninelli, P.A. (Eds.), Technology and Enterprise in a Historical Perspective. Claredon Press, Oxford.
Dosi, G., Nelson, R.R., S. Winter (Eds.), 2000. The Nature and Dynamics of Organizational Capabili-ties. Oxford University Press, in press.
Dunning, J.H., Pearce, R.D., 1985. The World’s Largest Industrial Enterprises, 1962 – 1983. Gower, Farnborough.
Engelsman, E.C., van Raan, F.J., 1994. A patent-based cartography of technology. Res. Policy 23, 1 – 26.
Eurostat, 1980, ‘National accounts, ESA, Input – Output tables’.
Fai, F.M., 1998. Corporate technological competence and the evolution of technological diversification. PhD thesis, University of Reading, MA.
Foss, N.J., 1993. Theories of the firm: contractual and competence perspective. J. Evol. Econ. 3, 127 – 144.
Foss, N.J., Christensen, J.F., 1996. A process approach to corporate coherence. DRUID working paper no. 96-7.
Gambardella, A., Torrisi, S., 1998. Does technological convergence imply convergence in markets?: evidence from the electronics industry. Res. Policy 27, 445 – 464.
Granstrand, O., Sjo¨lander, S., 1992. Internationalisation and diversification of multi-technology corpo-rations. In: Granstrand, O., Ha˚kanson, L., Sjo¨lander, S. (Eds.), Technology Management and International Business: Internationalisation of R&D and Technology. Wiley, London.
Granstrand, O., Patel, P., Pavitt, K., 1997. Multi-technology corporations: why they have ‘distributed’ rather than ‘distinctive’ core competencies. California Manag. Rev. 39, 8 – 25.
Griliches, Z., 1979. Issues in assessing the contribution of research and development to productivity growth. Bell J. Econ. 10, 92 – 116.
Jaffe, A., 1986. Spillover of R&D: evidence from firms’ patents, profits and market value. Am. Econ. Rev. 76, 984 – 1001.
Laursen, K., Meliciani, V., 1999. The importance of technology-based inter-sectoral linkages for market share dynamics. DRUID working paper no. 99-10.
Loasby, B.J., 1991, ‘Economics and Evolution: an Exploration of Connecting Principles in Economics’, Manchester: Manchester University Press.
Markides, C.C., 1995. Diversification, restructuring and economic performance. Strategic Manag. J. 16, 101 – 118.
Markides, C.C., 1996. Diversification, Refocusing and Economic Performance. MIT Press, Cambridge, MA.
Markides, C.C., Williamson, P., 1994. Related diversification, core competences and corporate perfor-mance. Strategic Manag. J. 15, 149 – 165.
Montgomery, C.A., 1994. Corporate diversification. J. Econ. Perspect. 8, 163 – 178.
Nelson, R.R., 1991. Why do firms differ and how does it matter? Strategic Manag. J. 12, 61 – 74. Orecchia, M., 1998. Coerenza d’impresa e diversificazione settoriale: un’applicazione alle societa` leaders
Oskarsson, C., 1993. Technology diversification — the phenomenon, its causes and effects. Doctoral Dissertation, Department of Industrial Management and Economics, Chalmers University of Tech-nology, Goteborg.
Patel, P., Pavitt, K., 1994. Technological competencies in the world’s largest firms: characteristics, constraints and scope for managerial choice. Mimeo, Science Policy Research Unit, University of Sussex, Brighton.
Patel, P., Pavitt, K., 1997. The technological competencies of the world’s largest firms: complex and path-dependent but not much variety. Res. Policy 26, 141 – 156.
Pavitt, K., 1985. Patent statistics as indicators of innovative activities: possibilities and problems. Scientometrics 7, 77 – 99.
Pavitt, K., 1988. Uses and abuses of patent statistics. In: van Raan, A.F.J. (Ed.), Handbook of Quantitative Studies of Science and Technology. North-Holland, Amsterdam.
Pavitt, K., 1999. Technologies, products and organisation in the innovating firms: what Adam Smith tells us and Joseph Schumpeter doesn’t. In: Dow, S.C., Earl, P.E. (Eds.), Economic Organisation and Economic Knowledge: Essays in Honour of Brian Loasby. Edward Elgar, Cheltenham.
Pavitt, K., Robson, M., Townsend, J., 1989. Technological accumulation, diversification and organisa-tion in UK companies 1945 – 1983. Manag. Sci. 35, 81 – 99.
Penrose, E., 1959. The Theory of the Growth of the Firm. Basil Blackwell, Oxford.
Penrose, E., 1995. Introduction. In: Penrose, E. (Ed.), The Theory of the Growth of the Firm, 2nd edn. Oxford University Press, Oxford.
Richardson, G.B., 1972. The organisation of industry. Econ. J. 82, 883 – 896.
Robins, J., Wiersema, M.F., 1995. A resource-based approach to the multibusiness firm: empirical analysis of portfolio interrelationships and corporate financial performance. Strategic Manag. J. 16, 277 – 299.
Rosenberg, N., 1963. Technological change in the machine tool industry, 1840 – 1910. J. Econ. Hist. 23, 414 – 446.
Rumelt, R.P., 1974. Strategy, Structure and Economic Performance. Harvard University Press, Cam-bridge, MA.
Scherer, F.M., 1982. Inter-industry technology flows in the United States. Res. Policy 11, 227 – 245. Schmookler, J., 1950. The Interpretation of Patent Statistics, Journal of the Patent Office Society, 32,
123 – 146.
Schmookler, J., 1966. Invention and Economic Growth. Harvard University Press, Cambridge, MA. Scott, J.T., 1993. Purposive Diversification and Economic Performance. Cambridge University Press,
Cambridge.
Stigler, G.J., 1961. The Organisation of Industry. Irwin, Homewood.
Teece, D.J., 1982. Towards an economic theory of the multiproduct firm. J. Econ. Behav. Organ. 3, 39 – 63.
Teece, D.J., Rumelt, R., Dosi, G., Winter, S., 1994. Understanding corporate coherence: theory and evidence. J. Econ. Behav. Organ. 23, 1 – 30.
Verspagen, B., 1997. Measuring intersectoral technology spillovers: estimates from the European and the US patent office databases. Econ. Syst. Res. 9, 47 – 65.
von Tunzelmann, G.N., 1995. Technology and Industrial Progress: the Foundations of Economic Growth. Edward Elgar, Aldershot.
Wernerfelt, B., 1984. A resource-based view of the firm. Strategic Manag. J. 5, 171 – 180.
Winter, S.G., 1987. Knowledge and competence as strategic assets. In: Teece, D.J. (Ed.), The Competi-tive Challenge. Harper and Row, Berkeley.