Developing a Seasonal Cash Demand Simulation for
Agricultural Cooperatives (Village Unit Cooperative)
in Indonesia
Gadjah Mada International Journal of Business Vol. 14, No. 1 (January - April 2012): 35 - 59
Abstract: Irrespective of the success of the Indonesian Government to achieve self-sufficiency of rice in
1985, and the rice price stabilization, paddy growers still suffer from a very low price for their produce. Koperasi Unit Desa (KUDs) –in Indonesian, or Village Unit Cooperative (VUC) have been entrusted with the marketing of rice paddies although their performance has always been less than satisfactory. One problem experienced by the KUDs is not having sufficient cash to purchase and process paddies into rice. The purpose of this study is to develop and validate a simulation model to represent cash flows during one paddy plantation season for a KUD (VUC). The simulation model is a decision support tool that enables a KUD’s (VUC) management to determine the maximum quantity of paddies to be pur-chased; the minimum borrowing and additional borrowing; and the earnings before taxes. An investiga-tor-administrated questionnaire was used to collect historical data of the twenty randomly selected KUDs (VUC) on Lombok Island to validate the sub-models of the simulation model. The Kolmogorov-Smirnov Goodness of Fit (two-sample), linear regression, correlation and t- tests were used to validate the simulation model. The validation results have shown that the sub-models of the simulation model are valid, and these may contribute to the valid results of the simulation model. This study has found that the limitations of the paddy storage building, drying floor, and milling machine owned by the KUDs (VUC) may restrict the KUDs (VUC) from buying the entire paddies harvested. Therefore, further research is needed to find out the minimum capacities of those facilities enabling the KUDs (VUC) to work effi-ciently.
Abstrak: Dibalik keberhasilan yang telah dicapai Pemerintah Indonesia dalam swasembada pangan/
beras pada tahun 1985, dan stabilisasi harga beras, petani padi masih menderita akibat sangat murahnya harga hasil produksinya. Koperasi Unit Desa (KUD) yang telah dipercaya berfungsi pemasaran gabah/ beras padahal kinerjanya selalu menunjukan sangat buruk. Satu kendala yang dialami oleh KUD adalah tidak memiliki cukup dan untuk membeli gabah dan memprosesnya menjadi beras. Tujuan penelitian ini adalah mengembangkan dan mem-validasi simulasi aliran kas dalam satu musim tanam padi untuk KUD. Simulasi ini merupakan suatu alat bantu pengambilan keputusan yang memungkinkan pengelola KUD untuk menentukan: jumlah maksimal gabah yang bisa dibeli; pinjaman minimum dan pinjaman tambahan; dan laba sebelum pajak. Daftar pertanyaan dimanfaatkan untuk mengumpulkan data dari dua puluh KUD di pulau Lombok yang dipilih secara acak untuk mem-validasi sub sistem simulasi.
Kolmogorov-Budi Santoso
Keywords: agricultural cooperatives (Village Unit Cooperative); seasonal demands; cash flows; simulation; validation
Introduction
Indonesia is commonly described as a Developing Country and about 58 percent of its population lives in rural areas (World Bank 1998a). In 1997, (the year for which the most recent figures are available) the total popula-tion of Indonesia (the fourth-populous coun-try in the world) is approximately 200.1 mil-lion people (World Bank 1998a). This means that approximately 116.06 million people live in rural areas. Generally, these areas are char-acterized by a traditional agricultural-based life style.
From an economic point of view, com-pared to other sectors, the agricultural sector has made the smallest total contribution to Indonesia’s Gross Domestic Product (GDP). At the end of the sixth five-year development era (1996/1997), agriculture accounted for approximately 16.1 percent of Indonesian GDP, other sectors such as industrial sectors contributed approximately 43.9 percent, and service sectors approximately 40.1 percent (World Bank 1998a). Regardless of its small contribution to the Indonesian GDP, the ag-ricultural sector has been the largest employer of people who live mainly in rural areas. Ac-cording to the World Bank (1998b), Indone-sian people in employment number 91 mil-lion, of whom about 50.96 million (56%) worked in the agricultural sector (see also Ferry 1988). The service sector, which is the sec-ond largest area of employment, employed about 28.21 million (31%) people (World Bank 1998b). The industrial sector employed approximately 11.83 million (13%) people (World Bank 1998b). Thus, the agricultural sector has a very important role in Indonesia’s economy (Dillon 1992). Moreover, the most
recent reports have revealed that the agricul-tural sector isa dominant alternative employ-ment for people who have lost their jobs be-cause of the economic crisis in Indonesia since late 1997 (IMF 1998; Pambudy 1998c; YAS 1998).
In 1996, approximately 51,101,506 tons of paddies were produced nationally (Biro Pusat Statistik 1999)1. This produce is equivalent to about 28,616,843.36 tons of rice (assuming that the conversion rate is 56%). Meanwhile, the national rice consump-tion per year is about 29,400,000 tons of rice (equivalent to 52,500,000 tons of paddies). This number is based on an average rice in-take per person per year of 147 kilograms. Again, from an economic viewpoint, there was an excess demand of paddies/rice. Theo-retically, the excess demand should increase the price of paddies/rice. In fact, every time a paddy harvest season comes, paddy grow-ers have to sell their produce at a lower price than the floor price set annually by the Indo-nesian Government (Suyanto 1996; Harijono 1998; Suganda 1998; SAH. et al. 1999).
Agricultural cooperatives (Indonesian: Koperasi Unit Desa or KUD) were introduced and established in 1973, and they have been entrusted with the marketing of paddies. A KUD may cover an area as small as one vil-lage. Based on the most recent data available released by the Indonesian Board of Statis-tics (1993), about 8,679 KUDs operate in Indonesian villages. The main duties of KUDs are to ensure their members (farmers) get agricultural inputs with a relatively stable price, and sell produce with a price as low as the floor price. The similar function of an agricultural cooperative was also found in the
1 Cited from Biro Pusat Statistik [Central Bureau of Statistics] homepage: http://www.bps.go.id/statbysector/
U.S.A. (Oehler 1996; Knoeber 1997; Demetrakakes 1998), in India (Kumar 1990; Sidhu and Sidhu 1990), in Malaysia (Ramli 1988), in Thailand (Boonma 1988), in Korea (Kim 1988; Lee 1988), in Taiwan (Chen 1988), in Japan (Fukui and Hirose 1993), Nicaragua (Kroeke 1996), and in Australia (Langdon 1991; Langdon 1994). However, up to now, KUDs have been blamed for let-ting paddy growers suffer from a very low price for their produce. Paddy growers often have had to sell their produce at a price lower than the floor price. Reports of the Indone-sian media and findings of recent research-ers have suggested that several factors may contribute to the unsatisfactory performance
of KUDs. First, although the Indonesian
Government provides a low interest rate for loans, KUDs are still unable to purchase con-tinuously their members’ produce because of an apparent cash shortage (P3P 1997; Santoso 1993). This implies that whenever KUDs did not purchase their members’ pro-duce the members (paddy growers) had to sell their produce to private paddy wholesalers at a price lower than the price paid by KUDs.
Second, a lack of transport facilities may also contribute to the inability of KUDs to pur-chase paddies directly from paddy growers, and on the other hand, farmers do not have enough funds to transport their produce to KUD locations (Santoso 1993; P3P 1997).
The KUD is an intermediary organiza-tion of the Indonesian Government to help and improve the welfare of farmers (paddy growers), and to stabilize the price of rice (Timmer 1996). The rationale of setting a floor price annually for farmers’ produce is to help farmers get an income to support the minimum needs of their families. Timmer (1996, 1997), and Jones (1995) have stated that the stable food price (rice) may
contrib-ute to the economic growth for developing countries.
However, up to now, there have been no serious attempts taken by the Indonesian Government or any other institution to solve the low paddy price that was routinely expe-rienced by the paddy growers. Previous stud-ies have only covered the prescriptive aspects of phenomena surrounding this problem. Pambudy (1998b), Ida (1996), and Krisnamurthi (1996) have argued that cor-ruption, bureaucracy and a lack of manage-rial skills contribute to the unsatisfactory per-formance of KUDs. However, these studies have not given constructive and practical approaches to solve the problem.
Objectives
Literature Review
Before commencing the discussion of cash management models, it is necessary to cite three classical motives for holding cash. (Keynes, cited in Homonoff and Mullins 1975: 3)
“…. the transaction motive relates to “hold-ing cash to bridge the interval between the receipt of income and its disbursement [or] between the time incurring business costs and that of the receipt of the sale-proceeds.” The precautionary motive concerns hold-ing cash to provide “for conthold-ingencies re-quiring sudden expenditure and for unfore-seen opportunities of advantage purchases.” The speculative motive involves holding cash in order to secure “profit from know-ing better than the market what the future will bring forth”; in other words, this mo-tive is a function of expectations. Keynes believed the transactions motive and the pre-cautionary motive to be essentially functions of the level of income (i.e., the money value of the transactions) and the speculative motive to be a function of the interest rate.”
As far as this study is concerned, de-mand for cash is to fund the operating pro-cesses of a KUD during the paddy planta-tion season. This involves the first two mo-tives, the transaction motive and the precau-tionary motive. The last motive, speculative motive, is not relevant to the nature of the cash flow model in this study. Holding cash in this study is not a function of the interest rate, because the interest rate of credit pro-vided by the Indonesian Government for KUD and the interest rate of credit lent by KUD to its members (for agricultural credit program/KUT) is the same.
Cash management models discussed in the prior literature focus mainly on optimiz-ing the cash balance, speedoptimiz-ing or delayoptimiz-ing specific cash flow components, and short run
investment strategies. Among these works, is that of Baumol (1952) who applied an in-ventory modeling approach. He employed a deterministic model that assumes cash dis-bursements are spread over time, and cash receipts occur periodically at discrete points in time. His suggested model concentrates on the quantity and spending of funds transferred between transaction and investment ac-counts. In his model, Baumol assumed that to ensure a positive cash balance, a firm con-stantly and continuously reserves its cash balance by converting its asset to cash. Un-like Keynes, Baumol perceived that the trans-action cash demand was a function of both income and interest rate (the combination of Keynes’s three motives).
Another researcher, Tobin (1956) ar-gued that the only motive for cash demand would depend inversely on the interest rate. Similar to Baumol, Tobin also employed a deterministic model, but he permitted the number of transactions into cash to take only positive integral values. He also assumed that (supporting Baumol’s assumption as well) cash withdrawals should be evenly spread over time and in equal amounts.
optimal cash balance level. They found that the transaction demand for cash is sensitive to income, interest rate and synchronization. Neave (1970) examined the stochastic cash balance problem with fixed and propor-tional costs incurred whenever the inventory increases or decreases. The study focused on the positive transfer costs of the fixed com-ponent of stochastic cash balance. Neave employed convex upper and lower bounds on the cost functions partially to describe opti-mal policy. He argued that the convex bound-ing technique might provide an approach to study the complex optimal policy of inven-tory problems.
A more advance effort is that of Homonoff and Mullins (1975) who examined the assumption used in the model suggested by Miller and Orr in generating daily cash flow data. On the basis of extending the Miller-Orr model, they constructed and tested variations of an inventory control limit approach, though they saw the presence of systematic effects and sequential patterns, which violate the assumption underlying the Miller-Orr model. Although their models per-formed slightly better than those of previous models, they did not explore sophisticated approaches, which take into consideration dynamic properties of data.
Similar to Miller and Orr (1966), Constantinides (1976) suggested a continu-ous time model of cash management assum-ing stochastic demand, but allowassum-ing for posi-tive and negaposi-tive cash balances. He assumed fixed and proportional transaction costs. Un-like Neave, Constantinides assumed the op-timal policy form was very simple.
Seeing cash management models as an inventory problem, Mensching et al. (1978) suggested the simple cash balance problem to determine the timing, direction and
mag-nitude of transfers between a firm’s earning asset and cash balance. They assumed that there would be a discrete-time, multi-period, and deterministic economic lot-size model allowing negative demands and disposal of goods. The heuristic procedures were used in a protective planning-horizon to determine the future demand of cash. The model con-sidered the dynamic properties of data, but it did not take into account the stochastic demand of cash.
A more advance effort than that of Mensching et al. (1978), Chand and Morton (1982) developed a perfect planning horizon procedure for the simple deterministic cash balance problem assuming the requirements for cash (positive or negative) are known for several periods ahead. They stated that the model was guaranteed to obtain optimal ini-tial decisions for the infinite horizon of cash balance problems by using the minimum pos-sible number of periods of forecast data. They employed an efficient forward dynamic programming algorithm. Although their ap-proach employed dynamic programming, they neglected the stochastic properties of daily cash flows.
A more recent study by Stone and Miller (1987) used multiplicative models of cash flow patterns for daily cash forecasting. They also underlined four common reasons con-tributing to the failure of most efforts at daily
cash forecasting. First, the definition of
ma-jor flows is not periodic and not generally
estimable from past data. Second, the
break-down of non-major flows into components
is sometimes neglected. Third, the
require-ment of information systems support to track hundreds of non-major cash flow streams as well as hundreds of individual non-major
cash flow streams is ignored. Fourth, there is
models for treating week and day-of-month interaction of cash flow streams. Nei-ther dynamic nor stochastic properties of daily cash flow data were included in their multiplicative models.
Another study, which considered cash balance problems, is Bergh and Hallerbach (1991) who suggested a simple model to solve one period stochastic cash problem assum-ing a fixed cash outlay at the end of the pe-riod. They also assumed the decision maker faces a single deterministic liability that is due at a certain time. A constant overdraft facil-ity and the presence of an initial potential fund needed to be fulfilled in the model. Irre-spective of the involvement of stochastic and dynamic properties of cash flow data, the model failed to fulfil the nature of stochas-tic cash outlay and the overdraft facility, which is stochastic in nature.
There have been a few attempts to study the efforts of improving cash management. Thompson (1986), and Madura (1987) re-vealed that simulation models could be used by decision makers to improve cash manage-ment. Moreover, Thompson (1986) stated that a computer simulation could provide an overview of the complex relationships within the business. A similar approach (a dynamic-stochastic simulation model) was also sug-gested by Golub et al. (1995) to manage money for mortgage security.
Most prior researchers have attempted to study cash management models as a par-tial approach. One stream of researchers con-sidered dynamic programming of cash man-agement models, but neglected the stochas-tic properties of cash flow data. The other stream emphasized the stochastic properties of cash flow data on its cash management model, but overlooked the dynamic aspect of the model. Most prior researchers agreed
that a simulation model might resolve the difficulties and complexities of the integrated approach of cash management models incor-porating dynamic programming and stochas-tic properties of cash flow data.
There have been only a few studies which research cash management of agricul-tural cooperatives. Rasmussen (1983) under-lined the difficulties of determining the proper level of cash to have on hand to meet liquidity and efficiency. Basset (1992) stated that the substantial margin of error has to be tolerantof forecasting cash to meet seasonal service demand.
Levy et al. (1989) examined the impli-cations of financial cooperation in Israel’s semi-cooperative villages. Their research fo-cused on the problems associated with po-tential free ride when farmers’ borrowings are uncoordinated. There are three main
difficul-ties identified in their study. First, the usual
pecuniary externality arose when cooperative members acted as price takers regarding the cost of credit, though the cooperative faced an upward sloping credit supply function.
Second, the added uncertainty for the indi-vidual farmer stemmed from his dependence on the uncoordinated borrowing and invest-ment behavior of other cooperative members.
taken into account stochastic properties of cash flow data.
Johnson and Crawford (1993) examined cash management in rural America. Their study described Basin Electric Power Cooperative’s innovations in cash manage-ment. They underlined the main problem faced by the cooperative. At the same time that the cooperative needed to borrow funds to meet its seasonal cash requirements, its members invested their seasonal access li-quidity in the same institution at a lower in-terest rate than that paid by the cooperative. The study described how the cooperative solved its problem by opening a new busi-ness section to accommodate its members’ savings. However, the study did not include any dynamic and stochastic properties of cash flow data.
Zaman (1992) suggested a working capital management model for public enter-prise in Bangladesh by strengthening the cur-rent ratio. He also identified that the work-ing capital models suggested by Western scholars and the Indian Reserve Bank were not practically applicable under the environ-ment constraints of Bangladesh. The results of that study indicated that the suggested prescriptive model improved the working capital position by gradually reducing the dependence on bank borrowings. However, the study did not consider stochastic and dy-namic properties of cash flow processes.
Previous research has mainly focused on the role of the bank as an intermediary in the improvement of financing of rural small farms. This study attempts to fill the gap that is left by previous researchers. Hence this study will focus on the KUD as a financial intermediary to help peasant farmers in In-donesia have better access to credit. Most previous studies have given more attention to macroeconomic levels of rice price
stabi-lization. In addition, the KUD that directly deals with farmers or producers was not a focus of the past studies. This study perceives the KUD as an important bridge between BULOG and farmers who need specific at-tention to obtain better income through gain-ing a reasonable price for their produce. The research efforts and methodologies reviewed in this chapter provide the foundations for the model developed in this thesis. The mod-eling approach provides a means for integrat-ing the dynamic and stochastic properties of cash flow processes. This supplies the link-age between Baumol’s deterministic assump-tions and the purely stochastic proposition of Miller and Orr. The determinants investi-gated in this study include those identified in the agricultural cooperative cash management literature. The exponential family function
(i.e., LogNormal) is mainly adopted to
gener-ate cash inflows and outflows associgener-atedwith operating processes within a KUD during the paddy plantation season. Finally a simulation model is developed to represent integrated elements of the cash flow of a KUD during a paddy plantation season by incorporating a transport cost, and by considering resources and capacities owned by a KUD.
Methods or Approaches
This part will discuss short descriptions of the simulation model, how to build the simulation, how data are to be collected to run and validate the simulation model, and how to validate the simulation model.
Why Use Simulation as the
Research Method
1993). This implies that building a computer simulation or program is surprisingly time consuming, and involves long computer pro-gramming of some complexity. However, since the purpose of this study is to develop a new cash flow model, which includes com-ponent costs (not existing in the current cash flow process), and complex processes, com-puter simulation may be the only way to cope with these phenomena. In general, there are two main reasons why a computer simulation should be used as a research method. These reasons are to overcome problems associated with real experimentation, and as an alterna-tive to a mathematical model.
Overcoming Problems of Real
Experimentation
Pidd (1993) has suggested four items that have to be considered to argue that a computer simulation can overcome problems associated with real experimentation. The first item is cost - building a computer simu-lation may be time consuming and expensive, however, real experiments might be more expensive if something goes wrong. The time taken to build a computer simulation is sec-ondary. Although it would be time consum-ing and involvecomplex computer program-ming, once the computer simulation has been built, it can be used to simulate weeks or months or years in just a matter of seconds or minutes in computer time. The third item is replication. Under certain conditions, it would be impossible to repeat strategies or tactics or any other events using real experi-ments, due to high costs. However, a com-puter simulation can be replicated to achieve the expected results of a certain strategy or tactic. Finally, safety is the essential issue, which has to be considered, when real experi-mentation deals with extreme conditions. A
computer simulation can cope with this re-quirement no matter how extreme the condi-tions are.
An Alternative to Mathematical
Modeling
The suggested cash flow model is sys-tem dynamic, involving sequential processes and transient effects resulting from tempo-rary impacts of rainfall, some capacities or constraints, and machine breakdowns. Math-ematical models would not be able to cope with this process, and as a result, a computer simulation is the only way to tackle this pro-cess (Pidd 1993). In addition, mathematical models such as queuing theory may only per-mit a certain type of sample distribution, but on the other hand, a computer simulation may cope with any types of sample distributions (Pidd 1993).
What is Borland Delphi?
Borland Delphi for Microsoft Windows is a general purpose and relatively new na-tive code compiler programming language that was first introduced in the first quarter 1995 by Borland International Corp. Borland Delphi enables application developers to build applications visually by dragging and dropping built-in and/or customized compo-nents onto a form, and linking/hooking them with minimum codes to respond to some event handlers. Borland Delphi is based on Object-Oriented Programming (OOP) archi-tecture, Object Pascal. The Object Pascal is
also called a hybrid language (Wozniewicz et
one single executable program (without any additional files, except when Borland Data-base Engine is used) or library (dynamic link library) that runs on Microsoft Windows, Borland Delphi is very easy to learn, and as result, the learning curve is relatively short, usually less than one year. Thus, Borland
Delphi can be defined as a visual,
object-ori-ented, and components-based development environ-ment (Pacheco and Teixeira 1995: 4).
Up to 1997, Borland International Corp. had released three versions of its Delphi fam-ily, namely: version 1.0, version 2.0, and ver-sion 3.0. Borland Delphi verver-sion 1.0 (herein-after simply called: Borland Delphi) is hosted on Microsoft Windows 3.1 (hereinafter called: Windows 3.1) operating system, and
is targeted to write 16-bit applications for Windows 3.1 or later. Of course, this does mean that 16-bit applications built by Borland Delphi can run on Microsoft Windows 95 (hereinafter called: Windows 95) or later and Microsoft Windows NT 3.51 (Service Pack 5, hereinafter called: Windows NT 3.51) or later. Meanwhile, Borland Delphi version 2.0, Borland Delphi version 3.0, and beyond run on Windows 95 or later and Windows NT 3.51 or later, and are used to create 32-bit applications for Windows 95 or later, and Windows NT 3.51 or later (see GreenBerg 1996). In this thesis, Borland Delphi solely refers to version 1.0 because the simulation is written in Borland Delphi, and is intended at minimum to be able to run on Windows 3.1 or later.
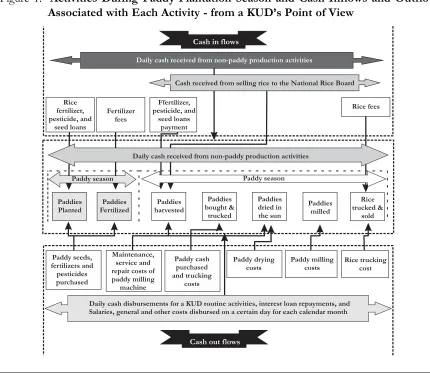
Figure 1. Activities During Paddy Plantation Season and Cash Inflows and Outflows
The Simulation Models
Mathematical model representations are used to visualize relationships of parameters and variables of real systems of cash flows of a KUD.
Cash Flow Models
This section will be divided into four main subsections. The first subsection will present and describe the model of cash in-flows during the paddy season. The next sub-section will introduce and outline the model of cash outflows of a KUD during the paddy season. Third, the model of cash inflows dur-ing the paddy harvest season will be pre-sented. Finally, the discussion will be con-cluded by the introduction and description of the model used to calculate cash outflows during the paddy harvest season. The expla-nations can be seen clearly from Figure 1 above.
Cash inflows during the paddy season
During the paddy season, a KUD’s cash inflows are mainly associated with the rou-tine activities. The daily cash inflows may be generated from cash sales and repayment of credit sales of the mini supermarket owned by a KUD. Besides this source of cash, dur-ing this season a KUD may also receive loans from the People’s Bank of Indonesia to pro-vide paddy seeds, fertilizers, and pesticides. In addition, the bank may also provide loans (rice loans) to a KUD to purchase members’ or farmers’ paddies when the paddy harvest season is due. The fertilizer distributor may pay fees to a KUD resulting from fertilizer sold. Thus, the cumulative cash inflows on a
certain day (day t) during paddy season can
be represented in the following equation.
where,
t = 1, 2,..., n
n = Poisson (PSm)
The cumulative cash inflows of a KUD
on day t (PFtps)during the paddy season (n) is
the summation of available cash on hand at
the beginning of that day (Cj), daily or
rou-tine cash received from cash sales and repay-ments of credit sales of mini market
com-modities (CIj), agricultural input loans
(fer-tilizer, pesticide and paddy seed loans) (FLj),
rice loan (RLj), and fertilizer fees (FFj). The
length of the paddy season (n) or paddy age
is a random number following a Poisson
dis-tribution [Poisson (PSm)] given the mean
(PSm) of a number of days of previous paddy
seasons.
Cash outflows during the paddy season
As a formal organization, a KUD em-ploys several people to handle daily opera-tions. The people who work in a KUD in-clude voluntary workers and paid workers. A manager, a secretary, a bookkeeper, some office workers, and an office guard are paid monthly. There are some other costs that are incurred monthly, associated with a KUD’s routine operations such as general costs (elec-tricity, telephone, water bills) and other monthly costs. Daily cash disbursement may also be incurred in a daily KUD’s operation. There are also some cash disbursements to purchase paddy seeds, fertilizers, and
pesti-cides. The cumulative cash outflows on day t
during the paddy season can be calculated by the following equation.
The cumulative cash outflows on day t,
dis-bursement (COj), fertilizers, paddy seeds,
pes-ticides and transport costs (FBj), salaries paid
monthly (Sj), general costs (GCj), and other
costs (OCj).
Cash inflows during the paddy harvest season
Figure 1 shows that as well as cash re-ceived from daily operations (from the mini supermarket and other non-agricultural ac-tivities), from the first day of the paddy har-vest season, a KUD will have additional cash inflows. These cash inflows may come from members’ fertilizer credit payments, rice sold to DOLOG, rice bran sold to customers such as poultry, cattle and pig farmers, and rice fees paid by private paddy wholesalers who have used a KUD’s stamp duty to sell their rice to DOLOG. The cumulative cash inflows
on day t during paddy harvest season can be
seen in the following mathematical equation.
where
t = n + 1, N + 2, ..., n + k
k: the terminating day of the paddy planta-tion season is determined when all pur-chased paddies are dried, milled, and sold by a KUD
A KUD’s cumulative cash inflow on day
t during paddy harvest season (PFtph) is a sum
of the net cash flows carried forward from
the paddy season (Cj), rice loans (RLj), cash
inflows from routine operations (CIj), cash
received from rice sold to DOLOG (RSj), cash
received from rice bran sold (BSj), cash
re-ceived from fertilizer credit repayments (FPj),
and rice fees paid by the private paddy
whole-salers (RFj).
Cash outflows during the paddy harvest season
As well as routine daily and monthly cash disbursements incurred during the paddy season, there are also several cash outflows during the paddy harvest season. These ad-ditional costs are cash disbursements for buy-ing and truckbuy-ing paddies, drybuy-ing paddies, and milling paddies. Cumulative cash outflows on
day t during the paddy harvest season can be
modeled as follows:
The cumulative cash outflows on day t
during the paddy harvest season (PUtps) is a
sum of daily cash disbursed to fund routine
activities (COj), salaries (Sj), general costs
(GCj), other costs (OCj) monthly paid, paddy
transport costs (PTCCj), cash disbursed to
buy paddies (PBCj), paddy drying costs
(PDCj), paddy milling costs (PMCj), cash
dis-bursed to service or repair the break down
of paddy milling machines (MSRj), rice
trans-port costs (RTCCj), and interest payments
(IPj).
How to Build the Simulation
Development Environment (IDE) that en-ables a programmer to write (code), execute and debug applications without leaving the Delphi environment. Delphi comes with ap-proximately 75 built-in components that are known as the Visual Component Library (VCL). These components are created by Delphi, and thus, they are native Object-Pas-cal compiled libraries. These VCLs enable applications to be distributed and executed/ run without any additional libraries or files. As mentioned earlier, in order to built a pro-gram or an application, a propro-grammer has just to drop several components on a form (a ba-sic skeleton of an application or a program),
set appropriate properties of components at a design time or set properties programmati-cally at a run time, and link or glue them to-gether to respond to event handler(s). As an analogy, to build a car, employees just have to assemble a car frame, machine, body, wheels, and interiors, to paint, test and run. The VCLs that come with Delphi are enough to build almost any type of application.
Data to run and validate the simulation model
Historical data used to run and validate the simulation results were collected using investigator-administrated questionnaires
Figure 2. Relationships between The Data Structure used to Hold Parameters and
Vari-ables, and Visual Interface of the Simulation Model
Cash
Paddy Plantation Produc tionPaddy Miscellaneous
from twenty KUDs that were selected by us-ing a stratified random samplus-ing. Based on practicality, funds and time limit consider-ations, the sampled KUDs were among those located in Lombok Island. Two types of data were collected during the research, primary and secondary data.
The primary data includes: the amount of fertilizer, pesticide and paddy seed loan given by the Government; the cash balance at the beginning of paddy plantation season; the first date of paddies planted in a KUD loca-tion; the quantity and types of fertilizers, pesticides and paddies bought by a KUD; prices of fertilizer, pesticides, paddy seed, paddy, rice, and rice bran per unit; the num-ber of memnum-bers; paddy field areas owned by a KUD’s members; the amount of rice loan lent by the Government; loan interest rate; lending interest rate; the number of paid workers; the amount of salaries, general costs, and other costs monthly paid; Paddies resulting from paddy fields owned by a KUD’s member; paddy to rice conversion rate; paddy to rice bran conversion rate; daily cash re-ceived and disbursed respectively from and for businesses other than agricultural activi-ties; storage, drying floors, milling machines, paddy and rice transport capacities; the days of fertilizer, pesticides and paddy seed loan, and rice loan liquidated; daily paddies directly bought from paddy fields by a KUD; drying and milling costs per unit paddies; fertilizer and rice fees; frequency of milling machine breakdowns; service and repair costs of mill-ing machines; days of drymill-ing paddies; and fre-quency of monthly morning rain.
The secondary data includes: fertilizer, pes-ticide and paddy seed loan lent by each KUD in the region; the quantity of fertilizers, pes-ticides, and paddy seeds supplied by each KUD to its members; loan and lending in-terest rates; the quantity of paddies directly bought by each KUD from its members; and the quantity of rice sent and sold to DOLOG. From DOLOG, data may comprise of the quantity of rice bought from KUDs and non-KUDs; the price of rice; and the days of pay-ing rice to the KUDs. Data gathered from the Department of Agriculture may include: the uses of each type of fertilizers and pesticides for wet and dry paddy fields; the age of sev-eral types of paddy varieties; paddy results from several types of paddy varieties per hectare of paddy field; paddy to rice and paddy to rice bran conversion rates; paddy field areas in each sampled KUD location; and places in which unsuccessful paddy sea-sons occurred, and the causes of the bad paddy season. Published or unpublished printed-materials from previous studies may provide qualitative data that are underlying assumptions, rules and other non-numeric data.
How to validate the simulation model
Several stochastic variables are used in the simulation model with assumptions fol-lowing certain distributions. As such, the Kolmogorov-Smirnov Goodness Fit
(Two-Sample) Test (D) was used to test the
as-sumption is true (not rejected) if the
calcu-lated D is less than the critical value of D(Law
and Kelton 1991). Since the final result of the actual system for each sampled KUD does not exist, the sub-models of the simulation model were compared against the sub-sys-tems of the actual system (Law and Kelton 1991; Pidd 1993; Knepell and Arangno 1993; Paul and Balmer 1993; Kleijnen 1995a; Taber and Timpone 1996). The linear regression test (focusing on the intercept, the slope and the
R square), t-test and correlation test was used
to validate those sub-models and sub-sys-tems. The sub-models and the sub-systems that were validated are the quantity of pad-dies harvested daily, the frequency of monthly morning rain, and the amount of rice fees. The validations for each sampled KUD were conducted by 25, 50 and 100 replications with 95 percent of confidence levels respec-tively.
The sub-models’ (modules’) results, that can be validated, are the quantity of paddies harvested daily, the frequency of monthly morning rain, and the rice fees. The test used to validate these modules is linear regression, from which the fit between results of the sub-actual system and results of the sub-simula-tion model can be identified. The sub-simu-lation model is a complete resemblance of the sub- actual system under study if the in-tercept of the regression model is zero, the slope is one, and the R square is one (Cohen and Cyert 1961; Kleijnen and Groenendaal
1992; Kleijnen 1995a; Kleijnen 1995b). This requirement is too idealistic to achieve, so it is suggested that the sub-simulation model is still acceptable if there is strong evidence that the results of sub-simulation model and the
results of sub- actual system are positively
cor-related (Kleijnen and Groenendaal 1992; Kleijnen 1995a; Kleijnen 1995b). The corre-lation tests are considered to be less strin-gent. A more rigorous requirement for deter-mining the fit between the sub-simulation model and the sub-actual system is if the mean and variance of results of the simu-lation model are equal to those of the
sub-actual system (Kleijnen et al. 1998). The t
statistic (t-test) will be used to identify the
similarity of the mean and variance of the sub- simulation model’ and sub- actual sys-tem’ results. All these tests are based on the 95 percent confidence level.
Results and Discussions
In this article, only some results of the validation will be shown, and some of them can be seen as follow.
Daily Cash Inflows and Outflows
Test
The summary of Kolmogorov-D and P,
and the D critical table value based on
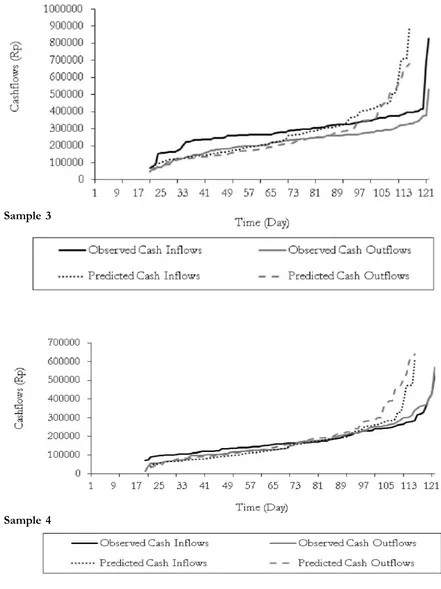
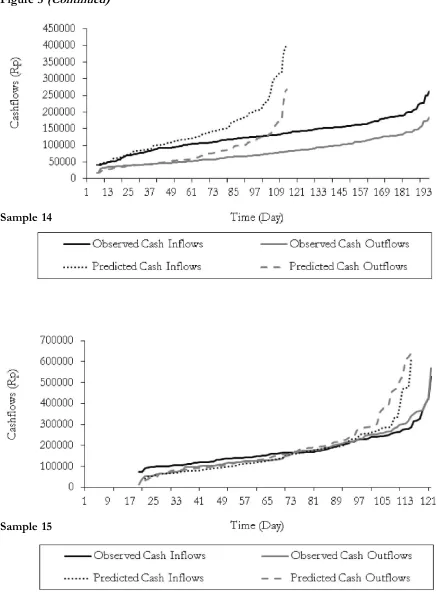
Figure 3. The List of Line Plots of the Sorted Actual Cash Flows and the Sorted Theo-retical Cash Flows Generated by The Simulation Model for Each Sampled KUD
Figure 3 (Continued)
Sample 14
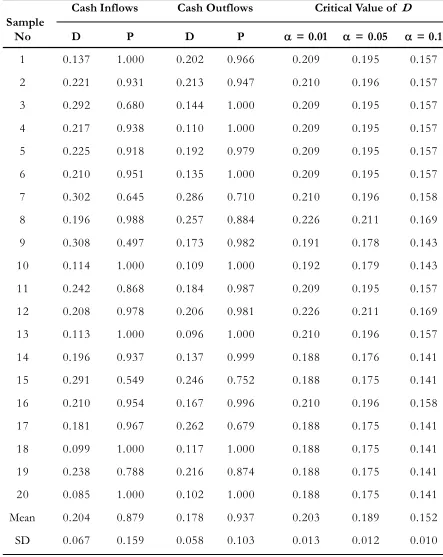
Table 1.The Kolmogorov-Smirnov Goodness of Fit Test Results of Comparing The Ac-tual Distribution Against The Theoretical Distribution of Cash Inflows and Out-flows by Sampled KUD
Cash Inflows Cash Outflows Critical Value of D
Sample
No D P D P = 0.01 = 0.05 = 0.1
1 0.137 1.000 0.202 0.966 0.209 0.195 0.157
2 0.221 0.931 0.213 0.947 0.210 0.196 0.157
3 0.292 0.680 0.144 1.000 0.209 0.195 0.157
4 0.217 0.938 0.110 1.000 0.209 0.195 0.157
5 0.225 0.918 0.192 0.979 0.209 0.195 0.157
6 0.210 0.951 0.135 1.000 0.209 0.195 0.157
7 0.302 0.645 0.286 0.710 0.210 0.196 0.158
8 0.196 0.988 0.257 0.884 0.226 0.211 0.169
9 0.308 0.497 0.173 0.982 0.191 0.178 0.143
10 0.114 1.000 0.109 1.000 0.192 0.179 0.143
11 0.242 0.868 0.184 0.987 0.209 0.195 0.157
12 0.208 0.978 0.206 0.981 0.226 0.211 0.169
13 0.113 1.000 0.096 1.000 0.210 0.196 0.157
14 0.196 0.937 0.137 0.999 0.188 0.176 0.141
15 0.291 0.549 0.246 0.752 0.188 0.175 0.141
16 0.210 0.954 0.167 0.996 0.210 0.196 0.158
17 0.181 0.967 0.262 0.679 0.188 0.175 0.141
18 0.099 1.000 0.117 1.000 0.188 0.175 0.141
19 0.238 0.788 0.216 0.874 0.188 0.175 0.141
20 0.085 1.000 0.102 1.000 0.188 0.175 0.141
Mean 0.204 0.879 0.178 0.937 0.203 0.189 0.152
As seen from Table 1, on average the
theoretical distribution (LogNormal) of daily
cash inflows and outflows, that was gener-ated by the simulation model based on the given mean and standard deviation derived from historical data of 20 sampled KUDs, has a similar shape to the actual distribution. Based on the criteria discussed in Section
5.5.2, the theoretical distribution (LogNormal)
assumption used to generate the daily cash inflows does not fit the actual distribution.
This is because the calculated D (0.204) is
not smaller than the critical value of D (0.203)
at the 99 percent significance level. The ac-tual distribution of cash inflows of Sample 3 is more likely following a normal distribution because it has routine and relatively constant daily cash inflows from its non-agricultural activities such building materials, and poul-try. Similarly, Sample 7 and 9 have routine and relatively constant daily cash inflows re-sulting from their handcraft businesses. In contrast, Sample 15 and 19 have irregular, unstable and small daily cash inflows because they do not have substantial non-agricultural businesses. Their non-agricultural businesses mainly provide salt for drying-fish processes in their location (close to dried-fish indus-tries). Also there is a large difference between
the mean calculated D and the mean critical
D at both 5 percent and 10 percent
signifi-cant levels. Although the mean calculated D
of daily cash inflows is greater than its mean
critical D value, the mean probability of the
simulation model generating daily cash in-flows following the theoretical distribution is about 87.90 percent at 1 percent significant level.
On the other hand, on average the mean
calculated D (0.178) of daily cash outflows
is much less than the mean critical D value
(0.203) at the 99 percent confidence level,
and less than the mean critical D value (0.189)
at the 95 percent confidence level. However, at the 90 percent confidence level, the mean
calculated D is greater than the mean critical
D (0.152). The probability that the estimated
daily cash outflows, that are randomly gener-ated by the simulation model following
LogNormal distribution, is 93.70 percent at 1 percent and 5 percent significant levels.
Also, it can be seen from Table 1 that only one sampled KUD (Sample 9) had the
probability (p) less than 50 percent, of a daily
cash inflows stream following the LogNormal
distribution. This mean that daily cash inflows for this particular sampled KUD, which is generated by the simulation model, is more likely not to be following the assumed
LogNormal distribution. The historical data shows that the daily cash inflows of this KUD have less variability over the season with the mean of 144,630.52 and the standard devia-tion of 22,217.77. As well as being paddy growers, farmers who are members of this particular KUD (Sample 9) are active in hand crafting (i.e., wood craft and hand made fab-ric/batik). Due to continuous demand for handicrafts from tourists, farmers have con-tinuously purchased materials from the KUD. This results in less fluctuation in the KUD’s cash inflows.
The Test of the Quantity of
Paddies Harvested Daily
Three important factors (the intercept,
slope and R square) have to be determined
The outputs of the simulation model were analyzed on the basis of two scenarios, the proportion of paddies purchased each day in the range of 25 percent to 100 percent and using a fixed value of 100 percent. For both scenarios, the simulation model was run based on 25, 50 and 100 replications. Al-though the simulation model allowed for the negative cash balance/availability, the sampled KUDs were not able to purchase the
entire paddies expected to be sold by farm-ers. In Scenario 1 (the range 25 to 100% of paddies purchased each day), the total quan-tity of paddies that could be purchased by the KUD ranged from 9.19 percent to 62.07 percent (25 replications), 9.23 percent to 62.67 percent (50 replications) and 9.10 per-cent to 62.45 perper-cent (100 replications). Meanwhile, the results of Scenario 2 (100% of paddies purchased each day) indicated that
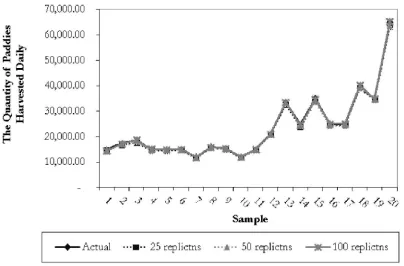
Figure 4.The Line Plots of The Quantity of Paddies Harvested Daily of the Sub- Actual
System and the Sub-Simulation Model
Table 2. The Results of Regression and Correlation Tests of the Quantity of Paddies
Harvested Daily of the Sub- Actual System and the Sub-Simulation Model
Replications Intercept Slope R2 Correlation Coefficient
25 -72.584 0.977 0.9996 0.9998
50 25.263 0.9773 0.9998 0.9999
8.97 percent to 97.88 percent (25 replica-tions), 9.15 percent to 97.34 percent (50 rep-lications) and 8.93 percent to 97.02 percent (100 replications) of the total quantity of paddies could be purchased by the KUDs. On average, the total quantity of paddies pur-chased by the KUDs was greater than that of the current practice. Based on the report of the Department of Cooperatives and the finding of research conducted by Ellis (1993b), KUDs were only able to purchase paddies of about 4 percent to 10 percent of the total paddies harvested, which is less than the results of the simulation model. This study identified that the limitations of the paddy storage building, paddy drying floor, and paddy milling machine capacities may con-tribute to the inability of the KUDs to pur-chase more paddies from their members. Thus, there are two methods that could be adopted
to resolve these limitations. First, the KUDs
could borrow at a low interest rate provided by the Indonesian Government to fund their new investment in paddy storage buildings, expanding the paddy drying floor and paddy milling machines. If this approach is chosen, a careful feasibility study needs to be carried out.
Second, the limitations may be removed by renting the facilities owned by private paddy wholesalers or other parties. Although the second approach is cheaper, theoretically this approach is not preferable because this mechanism could lead to collusion between the two parties, the KUDs and private paddy wholesalers, to exploit farmers by buying their produce at the price that is below the floor price. However, this issue is beyond this par-ticular research.
Concluding Remarks
The results of the Kolmogorov-Smirnov Goodness of Fit tests indicated that on aver-age, based on 0.01 level of significance, the
calculated D value (0.204) of daily cash
in-flow streams was marginally over the critical
D value (0.203). If a strict rule is
imple-mented, the assumption of the LogNormal
distribution underlying the randomly gener-ated cash inflow stream is not valid. This
condition resulted from the calculated D value
of one sampled KUD being very high and the probability of the cash inflow stream fol-lowing the assumed distribution was lower than 0.5. After tracing back the historical data, it was found that this KUD had less variance on its daily cash inflow stream due to routine transactions of selling materials for hand-crafts.
Based on the Kolmogorov-Smirnov
Goodness of Fit tests, the LogNormal
distri-bution assumption underlying the generation of daily cash outflow, general cost, other cost and paddy milling machine repair cost streams was valid as indicated by their
calcu-lated D values being lower than those of the
critical D values. Therefore, in general, the
assumptions employed in generating daily cash inflow and outflow, general cost, other cost and paddy milling machine repair cost stream were valid.
in-tercept of the regression line was greater than
zero, the t-test result indicated that there was
no significant difference between the simu-lation-predicted quantities of paddies pur-chased each day and the actual system. Simi-lar techniques were used to indicate that the monthly morning rain frequency and the rice fees generated by the simulation model were valid representatives of those of the actual system. Thus, on the basis of the results of these tests, the valid sub-models of the simu-lation model may contribute to the valid simulation model as a whole.
The results of confidence interval analy-sis indicated that several KUDs required ad-ditional borrowings, and other KUDs might
need to reduce their borrowing. The shifting from Scenario 1 to Scenario 2 was only sig-nificant to increase the earnings before tax (EBT) for the KUDs that were not con-strained by the limitations of their paddy stor-age building, paddy-drying floor and paddy milling machine capacities.
Although the simulation model is pow-erful enough as a decision support tool for the management of KUDs, it should not be used by management to predict the paddy yield, but it should be used cautiously to as-sist them to determine the amount of cash required for purchasing paddies based on vari-ous scenarios.
References
Bassett, G. 1992. Operation Management for Service Industries: Competing in the Service Era (Vol. 261). Westport, Connecticut: Quorum Books.
Baumol, W. J. 1952. The transactions demand for cash: an inventory theoretic approach. Quarterly Journal of Economics LXVI (1):545 - 556.
Bergh, W-M. Van Den, and Hallerbach. 1991. A stochastic cash model with deterministic elements. Paper
read at Modelling for Financial Decisions, 20-21 April 1989, at Catania.
Boonma, C.. 1988. Measures for the improvement of agricultural financing for small farmers in Thai-land. Paper read at Improved Agricultural Credit for Small Farms in Asia, 12-16 April, at Korea. Calvert, C. 1995. Delphi Programming Unleashed. Indianapolis: SAMS Publishing.
Chand, S. and Th. Morton. 1982. A perfect planning horizon procedure for a deterministic cash balance problem. Management Science 28 (6): 652 - 669.
Chen, H-H. 1988. Measures for the improvement of agricultural financing for small farmers in Taiwan.
Paper read at Improved Agricultural Credit for Small Farms in Asia, 12 – 16 April, at Korea. Cohen, K. J., and R. M. Cyert. 1961. Computer models in dynamic economics. The Quarterly Journal of
Economics LXXV: 112 - 127.
Constantinides, G. M. 1976. Stochastic cash management with mixed and proportional transaction costs.
Management Science 22 (12): 1320 - 1331.
Demetrakakes, P., 1998. Farmer’s market. Food Processing 59 (8): 20 - 24.
Fukui, J., and Y. Hirose. 1993. Poor harvest a natural disaster, but rice shortage is man-made. Tokyo Business Today (December): 28-32.
Golub, B., M. Holmer, R. McKendall, L. Pohlman, and S. A. Zenios. 1995. A stochastic programming model for money management. European Journal of Operational Research 85: 282-296.
Greenberg, I. 1996. At Sara Lee company, Delphi 2.0 delivers a knockout punch. Infoworld 18 (12): 75. Harijono, T. 1998. Derita petani Jabar belum Berakhir [The Farmers’ Suffering in Western Java Was Not
Ended Yet]. Kompas (3 February).
Homonoff, R., and D. W. Mullins, Jr. 1975. Cash Management: An Inventory Control Limit Approach. Lexing-ton: Lexington Books.
Ida, L.. 1996. Opini: mengembangkan koperasi: Antara pengusaha besar dan intervensi pemerintah [Opinion: Developing Cooperatives: Between Big Companies and the Government Intervention]. Republika
(12 July).
International Monetary Funds (IMF). 1998. Mitigating the social costs of the Asian crisis. Finance and Development (September): 18 - 21.
Johnson, S. P., and K. R. Crawford. 1993. Cash management in rural America. Journal of Cash Management
(Jan/Feb): 26-32.
Jones, C. 1995. Rice price stabilisation in Indonesia: An economic assessment of the changes in risk bearing. Bulletin of Indonesia Economic Studies 31 (1): 109 - 128.
Kim, Y-C. 1988. Small farm credit program and agricultural development in Korea. Paper read at Im-proved Agricultural Credit for Small Farms in Asia, at Korea.
Kleijnen, J. P. C., and W. Van Groenendaal. 1992. Simulation: A Statistical Perspective. Chichester: John Wiley & Sons.
Kleijnen, J. P. C. 1995a. Statistical validation of simulation models. European Journal of Operational Research
87 (1): 21-34.
Kleijnen, J. P. C. 1995b. Verification and validation of simulation models. European Journal of Operational Research 82 (1): 145-162.
Knepell, P. L., and D. C. Arangno. 1993. Simulation Validation: A Confidence Assessment Methodology. Los Alamitos: IEEE Computer Society Press.
Knoeber, C. R. 1997. Explaining state bans on corporate farming. Economic Enquiry XXXV (January): 151 - 166.
Krisnamurthi, B. 1996. Opini: Koperasi pedesaan dalam kondisi yang berubah [Opinion: The Village Cooperatives in the Changing Condition]. Republika (12 July).
Kroeker, C. J. 1996. The cooperative movement in Nicaragua: Empowerment and accompaniment of severely disadvantaged peasants. Journal of Social Issues 52 (1): 123 - 138.
Kumar, B. L. 1990. Gambhira co-operative farming society: A successful experiment in collective efforts.
Indian Journal of Agricultural Economics 45 (3): 362-366.
Langdon, I. A. 1991. Role of Co-Operatives in Promoting Agricultural Production. Queensland: Gold Coast University College of Graffith University.
Langdon, I. A. 1994. External equity need not compromise farmer control or co-operative principles.
Law, A. M., and W. D. Kelton. 1991. Simulation Modeling and Analysis. New York: McGraw-Hill, Inc. Levy, A., M. Justman, and E. Hochman. 1989. The implication of financial cooperative in Israel’s
semi-cooperative village. Journal of Development Economics 30: 25-46.
Madura, J. 1987. Improving cash management with simulation. Journal of Cash Management (Jan./Feb.): 47 - 48.
Mensching, J., S. Garstka, and T. Morton. 1978. Protective planning-horizon procedures for a determin-istic cash balance problem. Operation Research 26 (4): 637 - 652.
Miller, M. H., and D. Orr. 1966. A model of the demand for money by firns. Quarterly Journal of Economics
LXXX: 413 - 435.
Neave, E. H. 1970. The stochastic cash balance with mixed costs for increase and decrease. Management Science 16 (7): 472 - 490.
Oehler, S.. 1996. Largest U.S. AG co-op markets to and for producers. Agri Marketing 34 (6): H - M. Pacheco, X., and S. Teixeira. 1995. Delphi Developer’s Guide. Indianapolis: SAMS Publishing.
Pambudy, N. M. 1998b. Sektor pangan, andalan yang nyaris salah urus [The Food Crop Sector, the mainstay that was almost missed managing]. Kompas 21 (December).
Pambudy, N. M. 1998c. Sektor pertanian sebagai penyelamat [The agriculture sector is as a rescuer].Kompas
18 (May).
Paul, R. J., and D. W. Balmer. 1993. Simulation Modelling. Lund: Chartwell-Bratt. Pidd, M. 1993. Computer Simulation in Management Science. Chichester. John Wiley & Sons.
Pusat Penelitian dan Pengembangan Pedesaan [P3P], [The Center of Research and Rural Development]. 1997. Kaji Tindak Pengembangan Koperasi Mandiri Inti Dalam Wilayah Pertumbuhan Agribisnis di Propinsi Nusa Tenggara Barat [The Follow-up Action of Developing the Self-financing Cooperatives within the Agribusiness Growth Areas in the West Nusa Tenggara Province]. Mataram: Universitas Mataram.
Ramli, A. R. 1988. Measures or schemes for the improvement of agricultural financing for small farmers.
Paper read at Improved Agricultural Credit for Small Farms in Asia, 12 - 16 April, at Korea. Rasmussen, A. E. 1983. Financial Management in Co-operative Enterprises. Saskatchewan: Co-operative College
of Canada.
SAH., NAL., MAR., and SUP. 1999. Pembelian gabah di Sumatera kacau [The purchase of paddies in Sumatera was not well managed]. Kompas 3 (March).
Santoso, B. 1993. Budget variance and working capital analyses of the provision of fertilizers and pesti-cides, and the purchase of rice by agricultural cooperatives [The KUDs]: A case study of the West Lombok regency. Master Thesis. The School of Accounting, The Faculty of Business and Manage-ment, University of South Australia, Adelaide.
Sidhu, J. S., and R. S. Sidhu. 1990. Case studies of successful and unsuccessful primary co-operative service society and milk producers co-operative society in Punjab. Indian Journal of Agricultural Economics 45 (3): 367-373.
Stone, B. K., and T. W. Miller. 1987. Daily cash forecasting with multiplicative models of cash flow patterns. Financial Management (Winter): 45 - 65.
Suganda, H., 1998. Petani hanya kebagian “daki” [Farmers only got “grime”]. Kompas 18 (May).
Taber, C. S., and R. J. Timpone. 1996. Computational Modeling. Thousand Oaks: Sage Publications.
Thompson, R. 1986. Understanding cash flow: A system dynamics analysis. Journal of Small Business Man-agement 24 (2): 23 - 30.
Timmer, C. P. 1996. Does BULOG stabilise rice prices in Indonesia? Should it try? Bulletin of Indonesian Economic Studies 32 (2): 45 - 74.
Timmer, C. P. 1997. Building efficiency in agricultural marketing: The long-run role of BULOG in the Indonesian food economy. Journal of International Development 9 (1): 133 - 145.
Tobin, J. 1956. The interest-elasticity of transactions demand for cash. The Review of Economics and Statistics
XXXVIII (3): 214 - 247.
World Bank. 1998a. Indonesia at a Glance. New York: The World Bank.
World Bank. 1998b. World Development Indicators 1998 CD-ROM. New York: The World Bank.
Wozniewicz, A. J., N. Shammas, and T. Campbell. 1995. Teach Yourself Delphi in 21 Days. Indianapolis: SAMS Publishing.
YAS. 1998. Krisis moneter ciptakan peluang agrobisnis [The Indonesian economic crisis created an op-portunity for agribusiness]. Kompas 2 (February).