OXIDATION KINETICS AND QUANTIFICATION METHOD OF CHOLESTEROL USING
CHOLESTEROL OXIDASE ENZYME CATALYST
Iip Izul Falah
1.*, Ritmaleni
2, and M. Utoro Yahya
11
Department of Chemistry, Faculty of Mathematics and Natural Sciences, Universitas Gadjah Mada, Bulaksumur, Yogyakarta
2
Faculty of Pharmacy, Universitas Gadjah Mada, Bulaksumur, Yogyakarta
Received January 29, 2010; Accepted February 24, 2010
ABSTRACT
In view of health, cholesterol is believed as one of many sources can raise several diseases. Hence, both of research in quantification and developing simple, rapid and accurate analysis method of cholesterol in a sample is very important. Aim of this research was to investigate cholesterol oxidation kinetics and its quantification method based on oxidation of cholesterol and formation complex compound of hexathiocyanato ferat(III), {Fe(SCN)6}
-3 . The kinetics analysis and quantification, involved cholesterol oxidation in 0.1 M and pH 7.0 phosphate buffer solution to produce cholest-4-en-3-one and hydrogen peroxide, in the presence of cholesterol oxidase enzyme. The formed hydrogen peroxide was used to oxidize iron(II) ion, which was reacted furthermore with thiocyanate ion to raise the red-brown complex compound. Results of the study showed that the complex was stable at 10-120 min since the reaction was started, with maximum wavelength of 530-540 nm. While the kinetics analysis gave first order oxidation reaction with a reaction rate constant, kapp= 5.22 x 10
-2
min-1. Based on this kinetics data, cholesterol analysis method could be developed i.e. by oxidizing cholesterol within 1.5 h using cholesterol oxidase as a catalyst, and then reacted with Fe2+, in a solution containing thiocyanate ion. Absorbencies of solutions of the complex compound, measured at wavelength of 535 nm, were linearly proportional to their cholesterol concentrations, in the range of 50-450 ppm.
Keywords:cholesterol, quantification, kinetics, hexathiocyanato ferat(III)
INTRODUCTION
In view of health, cholesterol is believed as one of many sources can raise several diseases, and has close correlation to the occurrence of coronary heart disease. To overcome the risk of cholesterol to coronary artery and other diseases; screening, treatment, and monitoring of cholesterol have increased [1]. In cholesterol screening, inaccurate finger-stick method can be resulted due to insufficient operator training and inadequate quality control procedure [2]. Hence, both of research in quantification and developing simple, rapid and accurate analysis method of cholesterol in a sample is very important for two major reasons. The first is health concern about the role of excess plasma cholesterol on heart and artery related disease. The second reason deals with nutritional labeling of food, which is obligatory due to legal regulations in many countries [3-4]. Up to now this work still gives attention to be studied [3,5-11]. Cholesterol is commonly found as the component in cell membrane. Biologically it is an important precursor for bile acid, provitamin D and several steroidal hormones [6,8]. A lot of researchers believe that most of the cholesterol comes from animal fats found in foods, hence, cholesterol analysis methods have been developed for foods from animal such as
meat and meat products, egg yolk, milk, and fish [3-5,7-8,10]. However, cholesterol can also to be found in vegetable oil [6].
Earlier cholesterol analysis methods were based on gravimetric and chemical reaction, which was followed by spectrometric detection. Although recently, chromatographic methods for food cholesterol analysis have been developed [3,5,7-8,11], enzymatic methods which have appeared since long time ago [12-13] are still used and developed for simple cholesterol analysis [14-22].
In enzymatic cholesterol analysis using spectrophotometric detection, Raheb et al. [14] measured H2O2 (generated by the oxidation of
cholesterol) by the oxidative coupling with o-dianisidine; Bhatia et al. [16] used 4-aminophenazonean phenol as chromogenic system; Goodhue et al. [12] used 4-aminoantipyrine and coupling with 1,7-dihydroxy-naphthalene; Allain et al. [13] and Zang et al. [23] used 4-aminoantipyrine and phenol; while Kayamori et al. [19] detected NADH at 340 nm.
complex formation of hexathiocyanato ferat(III), {Fe(SCN)6}-3. As described by Goodhue et al. [12], Allain
et al. [13], and other references [14-15,17,19], when cholesterol is oxidized by O2 in 0.1 M and pH 7.0
phosphate buffer solution, in the presence of cholesterol oxidase; cholest-4-en-3-one and H2O2 will be produced.
In this study, the formed hydrogen peroxide was used to convert iron(II) to iron(III), whereas the last ion was detected as {Fe(SCN)6}
-3
. The conversion of iron(II) to iron(III) ions, using H2O2, has been investigated by
Bagheri et al. [24]. While quantification of iron(III) or thiocyanate ion by spectrophotometric method via detection of {Fe(SCN)6}
-3
, have been done by Riganakos and Velsistas [25], Basavaiah and Swamy [26], and Deglampietro et al. [27], whereas Beer’s law was obeyed in the range of ppm.
Catalytic properties of cholesterol oxidase in the cholesterol oxidation reaction, in an aqueous medium, can be well described by the Michaelis-Menten equation. However, the kinetics parameters depend not only on the organic solvent concentration, but also on the buffer origin and substrate solution preparation [28]. Optimum temperature and pH were found to be 40-45 °C and 7.0, respectively [29]. In enzymatic assay of cholesterol by reaction rate measurements, it was found that at temperature of 310 K and pH of 7.4, initial reaction rate in the oxidation of free cholesterol was directly related to the cholesterol concentration [30]. In the present work, the oxidation reaction was studied by combined the reaction with oxidation of iodide, hence, the product can be detected as a blue colour compound, in the presence of amylum. Oxidation of iodide by hydrogen peroxide, in a solution containing molybdate has been studied by Copper and Koubek [30]. This reaction is very fast compared with reaction rate of cholesterol oxidation. Hence, when these two oxidations were combined, reaction kinetics of cholesterol oxidation could be studied.
EXPERIMENTAL SECTION
Materials
Cholesterol and cholesterol oxidase was from Sigma; Triton X-100, H2O2, HCl, Fe(NO3)3∙9H2O,
Fe(SO4)2(NH4)2∙6H2O, KSCN, KH2PO4, KOH, HONH3Cl,
KI, ammonium molybdate, starch, and iso-propanol were from E Merk. Aquadest was from Physical Chemistry Laboratory, Gadjah Mada University.
Instrumentation
Spectrophotometer UV-vis (Milton Roy model UVD) equipped with 1x1x4 cm cuvet was used for detection of absorbance of {Fe(SCN)6}
-3
. pH meter (Fisher model 230
A) was used to measure pH of phosphate buffer. All glasses used in this study were pyrex quality.
Procedure
This work was started by investigating of complex stability of {Fe(SCN)6}
-3
, followed by wavelength scanning of the complex to confirm the wavelength for maximum absorbance. Further, the kinetics study of cholesterol oxidation was conducted after linearity of the complex was known. Finally, the decent of cholesterol analysis method was shown by linearity determination of absorbance versus cholesterol concentration.
Determination of complex stability
Into 10 mL volumetric flask, 0.5 mL of 2 x 10⁻³M Fe3+ solution was inserted. Then, 10 drops of 4 M HNO3 and 5.0 mL of 1 x 10
-2
M CSN– were added. Finally, the mixture was diluted until total volume reach 10.0 mL. As soon as possible, solution was vigorously shaked, and every 10 min its absorbance was detected at 495 nm [25] for 2 h total detection time.
Determination of wavelength at maximum absorbance
Solution from “Determination of complex stability” was used for this purpose. The absorbance was continuously scanned at 400-600 nm.
Determination of linearity of the complex
Into 10 mL volumetric flask, 0.5 mL of 2 x 10⁻³M Fe3+ solution was inserted. Then, 10 drops of 4 M HNO3 and 5.0 mL of 1 x 10
-2
M CSN– were added, finally, aquadest was added to reach 10.0 mL of total volume. As soon as possible, the mixture was shaked and its absorbance was detected at 535 nm. This experiment was repeated using various volume of Fe3+.
Detection of cholesterol oxidation kinetics
Determination of linearity of cholesterol analysis Ferro solution was made in 100 mL Erlenmeyer flask by mixing 25 mL of 0.2 M Fe2+ solution, 25 mL of 4 M HCl solution, and 50 mL of 1 M SCN– solution. Before used, this mixture was titrated by 20% HONH3Cl
until red colour was exactly disappearing. In a 20 mL reaction tube, 4 mL of 0.1 M and pH 7 phosphate buffer, 0.5 mL of 50 ppm cholesterol solution, and 0.5 mL cholesterol oxidase solution, were mixed. After cholesterol was oxidized for 1.5 h, 5.0 mL of ferro solution was added, and absorbance of the solution was detected at 535 nm. The work was repeated using 100-500 ppm of cholesterol solution.
RESULT AND DISCUSSION
In the development of an analysis method via detection a compound as a reaction product, as it has been shown by formation of {Fe(SCN)6}
-3
in this study, the compound must be stable in the period of detection. The application of {Fe(SCN)6}
-3
in quantification of iron or thiocyanate ions has been shown by several researchers [24-26]. As initial result of this work, Fig. 1 showed that when absorbance was measured at 495 nm, the complex was stable since it was reacted until 120 min of reaction time (until the measurement was stop). However, when this experiment was repeated using Fe3+ from the product of oxidation of Fe2+ by H2O2, at initial
measurement, the absorbance was not stable until 10 min, and then it was stable until 120 min of detection time.
Absorbance of the complex is influenced by the solvent; hence, the wavelength of maximum absorbance in this study could be different with the wavelength used by Riganakos and Veltsistas [25]. Result of scanning of the complex at 400-600 nm showed that the wavelength for maximum absorbance of this work was around 530-540 nm (Fig. 2). Based on this result, wavelength of 535 nm was used for further determination of absorbance of {Fe(SCN)6}
-3
.
Oxidation reaction of cholesterol using cholesterol oxidase as catalyst has been described by many researchers [12-15,17,19], and its kinetics of enzymatic reaction has been investigated by Aleksandrovskii [28] and, Vasudevan and Zhou [29]. Beside linearity, kinetics data is important in building an analysis method. For this reason, linearity of Fe3+ concentration versus absorbance was investigated, and the result is shown in Fig. 3. Linearity of Fe3+ concentration detected as {Fe(SCN)6}
-3
versus its absorbance at wavelength 535 nm was excellent (r2 = 0.9991) at concentration of Fe3+until 9 x 10⁻⁴M. This result was comparable with the result of Riganakos and Veltsistas [25], Basavaiah and Swamy [26], and Deglampietro et al. [27].
Fig 1. Absorbance of {Fe(SCN)6} -3
as the reaction product between Fe3+ and SCN–, detected at 495 nm and various of reaction time
Fig 2. Absorbance of {Fe(SCN)6} -3
at various of wavelength
Fig 3. Absorbance of {Fe(SCN)6}-3 at various
concentration of Fe3+, detected at 535 nm
For cholesterol oxidation kinetics study, the experiment could not be conducted based on formation of {Fe(SCN)6}
-3
Fig 4. Kinetics of cholesterol oxidation using cholesterol oxidase as a catalyst. The reaction was combined with oxidation of iodide ion to form iodine, and detected as iodine-amylum complex at wavelength of 545 nm
Fig 5. Kinetics data process using pseudo first order reaction, at a = 0.5595 and delay time 5.81 min
in the presence of molybdate ion (MoO4
2-), and the product was detected as blue colour of iodine-amylum complex, which spectrophotometricaly it could be followed at wavelength of 545 nm. According to Wong and Zhang [31], reaction between H2O2 and I– is first
order to both of reactants, with reaction rate constant, k = 60 M-1.h-1, however, when molybdate ion is used as catalyst, it changes to be rate = kcat[MoO4
2-, using molybdate ion as the catalyst, will be very fast compared with oxidation of cholesterol. When concentration of reactant as mentioned in the procedure was used, the disappear of H2O2 would be around 0.01 second, hence, the rate of
reaction between H2O2 and I –
would not disturb investigation of cholesterol oxidation kinetics, when both of reactions was combined.
Result of kinetics investigation (Fig. 4) showed that at initial period of the reaction time (until around 12 min; until y at Fig. 4), the reaction rate was slower compared with further reaction rate. Possibly, it was due to the solution was still not homogeneous and the enzyme-substrate complex concentration was still increased to reach equilibrium. According to Aleksandrovskii [28] and,
Vasudevan and Zhou [29], this reaction well described by Michaelis-Menten concept where the reaction rate
equation can be presented as
d[Ps]/dt = (Vmax.[S])/(KM+[S]). [Ps] is product of the
reaction, t is reaction time, Vmax is maximum reaction
rate, [S] is substrate concentration, and KM is
Michaelis-Menten constant. However, considering relatively slow of the oxidation reaction (see Fig. 4), it was convinced that concentration of enzyme-substrat complex, after the equilibrium was reached, was relatively low. Hence, it could be concluded that KM>>[S], which resulting KM+[S]≈KM, and then the
reaction rate equation became simpler i.e., d[Ps]/dt = (Vmax.[S])/KM. This condition was comparable
with result of Vasudevan and Zhou [20]. From this result, it could be derived first order equation which can be presented as ln(a/(a-x)) = kappt, where a is initial
cholesterol concentration, when the product is detected spectrophotometricaly, a is proportional to maximum absorbance at unlimited time; and x is the cholesterol concentration which has been oxidized, when the product is detected spectrophotometricaly, x is proportional to the absorbance related to the reaction time; kapp is appearance reaction rate constant , kapp= Vmax/KM, andt is reaction time. Due to both ofa
and x proportional to their absorbance (A = εbC; or C = A/εb), then a/(a-x) could be replaced with maximum absorbance divided by maximum absorbance minus absorbance at related reaction time. Characteristic of this first order equation is that intercept = 0. However, in processing the data with first order reaction, careful treatment must be done. In simplifying of Michaelis-Menten becomes first order reaction means that period of formation of enzyme-substrate complex is omitted, and it needs time to reach homogeneous mixture at the initial period of the reaction; hence, in processing the data of this kinetics experiment with first order reaction, initial time must be shifted to the right (x in Fig. 4), and this was at 5.81 min.
By using correction of initial reaction time with 5.81 min, and value of a was determined by iterative technique, it was resulted the best value of a = 0.5595; and then from continuous data in Fig. 4, it was selected several reaction times as discontinuous data to be processed as pseudo first order reaction. The result was shown in Fig. 5, which it gave reaction rate constant, kapp = 5.22 x 10
-2
min-1. This result was excellent due to the intercept was very close to zero. The appearance of very small numerical value for the intercept was due to the little scattering of the data, and it was in the range of standard deviation.
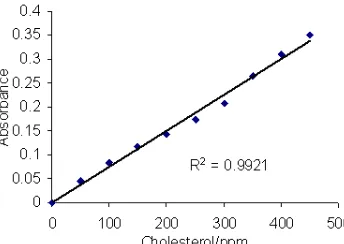
Fig 6. Absorbance of {Fe(SCN)6} -3
as the reaction product of cholesterol, oxygen, Fe2+, and SCN–, in the presence of cholesterol oxidase, detected at 535 nm and various of cholesterol concentration
acid could only be used for developing {Fe(SCN)6} -3
from Fe3+. It could not be used when it was designed that the appearance of Fe3+ only came from the reaction between Fe2+ and H2O2. HNO3 would oxidize Fe
2+
, hence, this acid was replaced by hydrochloric acid. Secondly, although Fe(SO4)2(NH4)2∙6H2O is relatively
stable, it always contains small amount of Fe3+, hence, solution of this compound must be reduced by HONH3Cl
just before Fe2+ reacted with solution containing H2O2.
Further, from kinetics study (kapp= 5.22 x 10⁻² min-1), it
could be calculated; when oxidation time was lasted for 1.5 h, nearly 100% of cholesterol had been oxidized. Based on these considerations, the procedure of cholesterol analysis was built, and result of the analysis using cholesterol standard showed that absorbencies of the solutions were linearly proportional to their cholesterol concentrations, in the range of 50 - 450 ppm, with r2 = 0.9921 (Fig. 6). Although this result is much higher compare to the method of HPLC-APCI-MS of Palmgren et al. [9] which showed linearity in the range of 0.2 - 3.5 ppm, this method is comparable with HPLC-UV method resulted by Hwang et al. [3] where the linearity in the range of 4-4000 ppm, and the method of spectrophotometry of Allain et al. [13] with the linearity in the range up to 6000 ppm. This method is also applicable to serum blood sample due to this sample normally contains cholesterol in the range of 160-250 mg/dL, and the method only needs 0.5 mL sample volume.
CONCLUSION
Kinetics of cholesterol oxidation could be determined involving reaction between formed H2O2and
I–, using molybdate as catalyst, with the result of oxidation reaction constant of kapp = 5.22 x 10
-2
min-1. Based on this result, cholesterol analysis method could be developed by oxidizing cholesterol within 1.5 h, using cholesterol oxidase as the catalyst. The product then
reacted with Fe2+, in a solution containing thiocyanate ion. Absorbance of the complex compound versus cholesterol concentration, measured at wavelength of 535 nm was linear at cholesterol concentration of 50-450 ppm.
ACKNOWLEDGEMENT
Acknowledgement is directed to Indonesia Government, which supported this work via Directorate of Higher Education, Department of National Education.
REFERENCES
1. Glasziou, P.P., Irwig, L., Heritier, S., Simes, R.J., and Tonkin, A., 2008, Ann. Intern. Med., 148, 9, 656-661.
2. Naughton, M.J., Luepker, R.V., and Stricland, D., 1990,J. Am. Med. Assoc.,263, 9, 1213-1217. 3. Hwang, B-S., Wang, J-T., and Choong, Y-M., 2003,
J. Food Compos. Anal., 16, 2, 169-178.
4. Hurst, W.J., Aleo, M.D., and Martin Jr., R.A., 1983, J. Dairy Sci., 66, 2192-2194.
5. Daneshfar, A., Khezeli, T., and Lotfi, H.J., 2009,J. Chromatogr. B, 877, 4, 456-460.
6. Okpuzor, J., Okochi, V.I., Ogbunugafor, H.A., Ogbonnia, S., Fagbayi, T., and Obidiegwu, C., 2009,Pak. J. Nutr., 8, 1, 57-62.
7. Dinh, T.T.N., Blanton Jr., J.R., Brooks, J.C., Miller, M.F., and Thompson, L.D., 2008,J. Food Compos. Anal., 21, 4, 306-314.
8. Osman, H., and Chin, Y.K., 2006, Malay. J. Anal. Sci., 10, 2, 205-210.
9. Palmgren, J.J., Toyras, A., Mauriala, T., Monkkonen, J., and Auriola, S., 2005, J. Chromatogr. B, 821, 2, 144-152.
10. Xu, X.H., Li, R.K., Chen, J., Chen, P., Ling, X.Y., and Rao, P.F., 2002, J. Chromatogr. B, 768, 2, 369-373.
11. Sion, B., Grizard, G., and Boucher, D., 2001, J. Chromatogr. A,935, 1-2, 259-265.
12. Goodhue, C.T., Risley, H.A., and Snoke, R.E., 1975, Method and Composition for Blood Serum Cholesterol Analysis,US Patent, No. 3,884,764. 13. Allain, C.C., Poon, L.S., Chan, C.S.G., Richmond,
W., and Fu, P.C., 1974, Clin. Chem., 20, 4, 470-475.
14. Raheb, J., Lashgarian, H.E., Memari, B., Hajipour, M.J., and Haghbeen, K., 2009,Inter. J. Biotechnol. Biochem., December 01, 2009, Accessed February 19, 2010, http://www.thefreelibrary.com/Identification, 15. Anonym, 2009, A Fast Enzymatic Assay for
ref. TB018812F, Accessed February 19, 2010, http://www.analox.com/tbcho018812f.htm.
16. Bhatia, D., Suman, and Pundir, C.S., 2005, Ind. J. Biotechnol., 4, 471-475.
17. Kouassi, G.K., Irudayaraj, J., and McCarty, G., 2005, J. Nanobiotechnol., 3,1.
18. Moreau, R.A., Powell, M.J., and Kevin, B., 2003,J. Agric. Food Chem., 51, 23, 6663-6667.
19. Kayamori, Y., Hatsuyama, H., Tsujioka, T., Nasu, M., and Katayama, Y., 1999, Clin. Chem., 45, 12, 2158-2163.
20. Vasudevan, P.T., and Zhou, T., 1997, Biotechnol. Bioeng., 53, 4, 391-396.
21. Schmarr, H-G., Gross, H.B., and Shibamoto, T., 1996,J. Agric. Food Chem., 44, 2, 512-517.
22. Olafsdottir, E., and Gudmundsson, T.V., 1993, Upsala J. Med. Sci., 98, 401-404.
23. Zang, L-Y., Cosma, G., Gardner, H., Shi, X., Castranova, V., and Valiyathan, V., 2000, Am. J. Physiol., 279, 4, 954-960.
24. Bagheri, H., Gholami, A., and Najafi, A., 2000, Anal. Chim. Acta, 424, 2, 233-242.
25. Riganakos, K.A., and Veltsistas, P.G., 2003, Food Chem., 82, 4, 637-643.
26. Basavaiah, K., and Swamy, J.M., 2001,II Farmaco, 56, 8, 578-585.
27. Deglampietro, P., Peheim, E., Drew, D., Graf, H., and Colombo, J.P., 1987, J. Clin. Chem. Clin. Biochem., 25, 711-717.
28. Alekssandrovskii, I., 1987, Biokhimiia, 52, 10, 1696-1703.
29. Vasudevan, P.T., and Zhou, T., 1996, App. Biochem. Biotechnol., 60, 1, 63-72.
30. Copper, C.L., and Koubek, E., 1999, Inorg. Chim. Acta, 288, 2, 229-232.