Total Quality Management (TQM) Tools
Total quality management (TQM) tools help organizations to identify, analyze and assess qualitative and quantitative data that is relevant to their business. These tools can identify procedures, ideas, statistics, cause and effect concerns and other issues relevant to their organizations. Each of which can be examined
and used to enhance the effectiveness, efficiency, standardization and overall quality of procedures, products or work environment, in accordance with ISO 9000 standards (SQ, 2004).
According to Quality America, Inc. (ReVelle, 2003) the number of TQM tools is close to 100 and come in various forms, such as brainstorming, focus groups, check lists, charts and graphs, diagrams and other analysis tools. In a different vein, manuals and standards are TQM tools as well, as they give direction and best practice guidelines to you and/or your staff.
TQM tools illustrate and aid in the assimilation of complicated information such as:
• identification of your target audience
• positive and negative forces affecting business
• assessment of customer needs • competition analysis • market analysis • brainstorming ideas • productivity changes • various statistics • staff duties and work flow
analysis
• statement of purpose
• financial analysis • model creation • business structure • logistics analysis
The list goes on, though essentially TQM tools can be used in any situation, for any number of reasons, and can be extremely effective if used properly.
TQM Tools
Pie Charts and Bar Graphs
• Used to identify and compare data units as they relate to one issue or the whole, such as budgets, vault space available, extent of fonds, etc.
Histograms
• To illustrate and examine various data element in order to make decisions regarding them. • Effective when comparing statistical, survey, or questionnaire results.
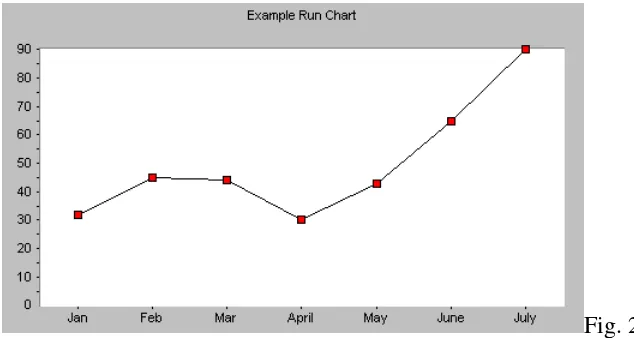
Fig.1 Run Chart
• Follows a process over a specific period of time, such as accrual rates, to track high and low points in its run, and ultimately identify trends, shifts and patterns.
Fig. 2
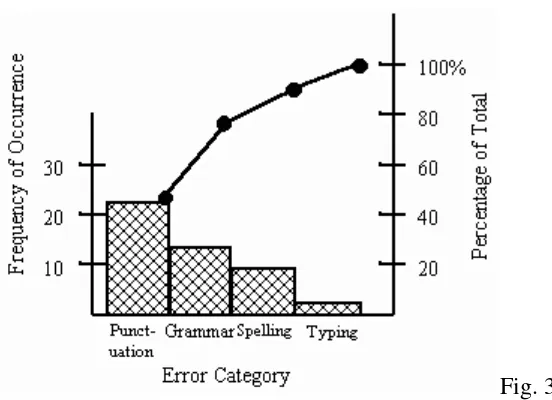
Pareto Charts / Analysis (designed by Vilfredo Pareto)
• Identify groupings of qualitative data, such as most frequent complaint, most commonly purchased preservation aid, etc. in order to measure which have priority.
• Can be scheduled over select periods of time to track changes. They can also be created in retrospect, as a before and after analysis of a process change.
Fig. 3
Force Field Analysis
• To identify driving and restraining forces occurring in a chosen process in order to understand why that particular process functions as it does. For example, identifying the driving and restraining forces of catering predominantly to genealogists.
• To identify restraining forces that need to be eradicated, or driving forces that need to be improved, in order to function at a higher level of efficiency.
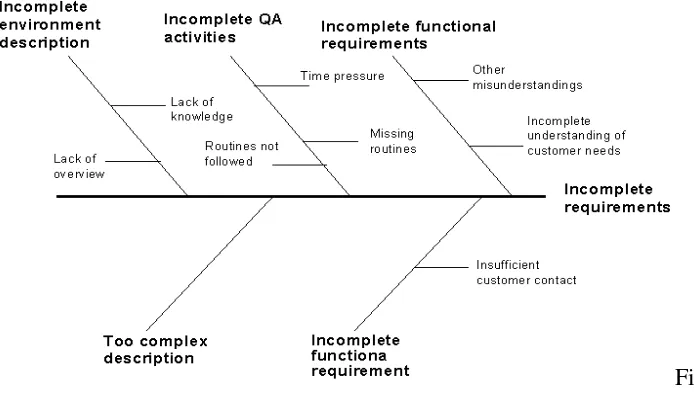
Cause and Effect, Ishikawa or Fishbone Diagrams (designed by Kauro Ishikawa)
• Illustrates multiple levels of potential causes (inputs), and ultimate effects (outputs), of problems or issues that may arise in the course of business.
Fig. 4 Focus Groups
• Useful for marketing or advertising organizations to test products on the general public. • Consist of various people from the general public who use and discuss your product,
providing impartial feedback to help you determine whether your product needs improvement or if it should be introduced onto the market.
Brainstorming and Affinity Diagrams
• Teams using creative thinking to identify various aspects surrounding an issue.
• An affinity diagram, which can be created using anything from enabling software to post-it notes organized on a wall, is a tool to organize brainstorming ideas.
Tree Diagram
Fig. 5
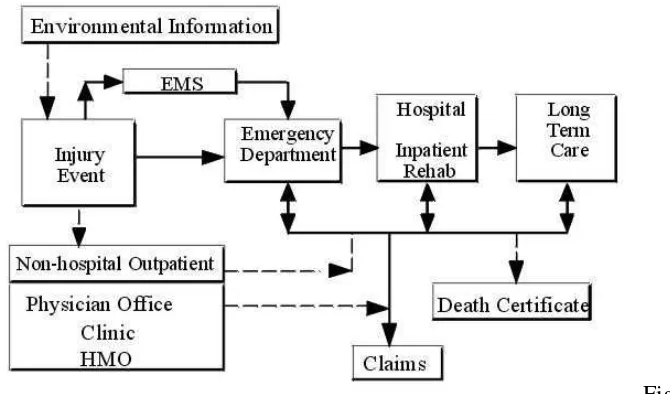
Flowcharts and Modelling Diagrams
• Assist in the definition and analysis of each step in a process by illustrating it in a clear and comprehensive manner.
• Identify areas where workflow may be blocked, or diverted, and where workflow is fluid. • Identify where steps need to be added or removed to improve efficiency and create
standardized workflow.
Fig. 6 Scatter Diagram
• To illustrate and validate hunches
• To discover cause and effect relationships, as well as bonds and correlations, between two variables
Fig. 7
Relations Diagram
• To understand the relationships between various factors, issues, events, etc. so as to understand their importance in the overall organizational view.
PDCA
• The Plan-Do-Check-Act style of management where each project or procedure is planned according to needs and outcome, it is then tested, examined for efficiency and effectiveness, and then acted upon if anything in the process needs to be altered.
• This is a cyclical style to be iterated until the process is perfected.
References
Gunther, J., Hawkins, F. (1999). Making TQM work: Quality tools for human service organizations. New York: Springer Publishing Company.
Narasimhan, T., Trotter, E. (1999). The application of TQM tools in a strategic business plan.
Center for Quality of Management Journal, 8 (3). Retrieved September 16, 2004, from http://cqmextra.cqm.org/cqmjournal.nsf/reprints/rp10700
*Pollock, R. (October 23, 2003). Online Resources About: Quality Management & Performance Excellence. Retrieved September 16, 2004, from
http://www.gslis.utexas.edu/~rpollock/tqm.html Bibliographic resource site for TQM, tools, ISO 9000 and related organizations available on the Internet.
ReVelle, J. (2003). TQM tools & tool kits. Retrieved September 16, 2004, from http://www.qualityamerica.com/knowledgecente/articles/revelletqmtools.htm
*Simply Quality (2004). What are ISO 9000 and ISO 9001? Retrieve September 17, 2004, from http://www.isoeasy.org/ Easy navigation and understanding of the ISO 9000 and 9001 standards on Total Quality Management.
*SkyMark. (2004). Classic Tools. Retrieved September 17, 2004 from
http://www.skymark.com/resources/tools/management_tools.asp Encyclopaedic reference site for various quality control charts and TQM tools, with descriptions and examples of each. *Sytsma, S., Manley, K. (June 9, 1999). The Quality Tools Cookbook. Retrieved September 15,
2004 from http://www.sytsma.com/tqmtools/tqmtoolmenu.html Encyclopaedic reference site for commonly used TQM tools, describing use and creation of the specific tool.
Figure References
Fig. 1 SkyMark. (2004). Retrieved September 16, 2004, from http://www.skymark.com/resources/tools/histograms.asp Fig. 2 SkyMark (2004). Retrieved September 16, 2004, from
http://www.skymark.com/resources/tools/run_charts.asp Fig. 3 Systma, S. (1999). Retrieved September 16, 2004, from
http://www.sytsma.com/tqmtools/pareto2.gif
Fig. 4 International Software Consulting Network. (2004). Retrieved September 16, 2004, from http://www.iscn.at/select_newspaper/measurement/telenor_fig4.gif
Fig. 5 Yeadon Energy Systems. (2004). Retrieved September 16, 2004, from http://www.yeadoninc.com/diagram.gif
Fig. 6 National Highway Traffic Safety Administration. (2004). Retrieved September 16, 2004, from http://www.nhtsa.dot.gov/people/perform/trafrecords/pages/codes/flowchart.jpg Fig. 7 Quality Assurance Project. (2004). Retrieved September 16, 2004, from
http://www.qaproject.org/images/scatterdiagram.jpg