1 Introduction
The knowledge of the climate of a region and its climatic
conditions is a primordial task that allows predictions of
climatic parameters in the future. Thus, more than fifty cli
-matic parameters
1are vital to sustainable climate
observa-tions. Some of these parameters include sunshine duration,
humidity, wind speed, atmospheric pressure, air and water
temperature, precipitation, etc. Air temperature, sunshine
duration, and relative humidity are among the most im
-portant and influential climatic parameters. For example,
knowledge of the change in the air temperature is of
ut-most importance in agriculture because extreme changes
in the air temperature can damage plants and animals.
2Air temperature is also involved in the evapotranspiration
process inherent in the management of water resources.
Moreover, knowledge of sunshine duration on the Earth’s
surface is of major importance not only from the clima
-tological point of view but also for agrometeorological or
biological purposes, engineering, architecture of the heat
gains of buildings, as well as for other applied
environmen-tal science studies.
3Humidity, in turn, plays a very impor
-tant role in the formation of various weather phenomena,
such as rain, floods, and thunderstorms. Aside from its in
-fluence on crop quality, humidity also plays a vital role in
the drying process of certain agricultural products such as
tobacco.
4Moreover, estimation of relative humidity has an
important role in preventing and extinguishing forest fires.
5Unfortunately, the measurement of these climatic param
-eters most often requires the existence of a network of
meteorological stations and very high-performance meas
-uring equipment. However, this is not the case for many
countries because of the costs, maintenance, and
calibra-tion requirements of the measuring equipment.
6To
over-come this imponderability, the development of alternative
methods for predicting climate parameters is a widely ex
-plored area of research. This path is imposed for several
reasons: economic considerations and reduction of time
constraints. Artificial intelligence techniques, such as Artifi
-cial Neural Networks (ANN), Genetic Algorithms (GA), and
Fuzzy Theory are alternative methods increasingly used in
meteorological events.
7During the last two decades, several authors have
devel-oped ANN models for predicting climatic factors in many
countries. In a previous study,
Jang et al.
8proposed a
mod-el using multilayer feed-forward (MLF) neural networks to
estimate air temperatures in Southern Québec (Canada).
Levenberg-Marquardt back-propagation (LM-BP) was used
to train the networks. In a work conducted by
Chronopo-ulos et al.,
9artificial neural network (ANN) models were
developed to estimate air temperature values in the south
of Greece. ANN model was found to have better
perfor-mance than the MLR model.
Bilgili and Sahin
10used an
ar-tificial neural network that was applied to predict the
long-term monthly temperature and rainfall based on the use
of the meteorological data measured by the Turkish State
Meteorological Service between the years 1975 and 2006.
Recently, in a study developed by
Kisi and Shiri,
11the
capa-bilities of Adaptive Neuro-Fuzzy Inference System (ANFIS)
and Artificial Neural Networks (ANNs) were evaluated in
predicting long-term monthly air temperature values at 30
weather stations of Iran. Other ANN models for forecasting
air temperature have been developed in Morocco,
7Tur-key,
12Japan,
13Saudi Arabia,
14Spain,
15and Iran.
16In
addi-tion, the ANN technique has been used to predict global
solar radiation and relative humidity.
17–19Prediction of Climatic Parameters from
Physicochemical Parameters using Artificial
Neural Networks: Case Study of Ain Defla
(Algeria)
https://doi.org/10.15255/KUI.2019.004
KUI-19/2019
Original scientific paper paper
Received January 26, 2019
Accepted April 7, 2019
L. Gheraba, L. Khaouane,
*O. Benkortbi, S. Hanini,
and M. Hamadache
Creative Commons Attribution 4.0 This work is licensed under a International LicenseLaboratoire de Biomatériaux et Phénomènes de Transport (LBMPT), Université de Médéa,
Pôle urbain, 26 000, MEDEA, Algeria
Abstract
The knowledge of the climate of a region is a primordial task in that it allows predictions of climatic parameters in the future. In
this study, monthly maximum and minimum air temperature (
T
air,min,
T
air,max), relative humidity (RH), and sunshine duration (SD)
were modelled by multiple linear regression (MLR), and multilayer perceptron methods (MLP). For the four climatic parameters,
the internal and external validations of MLP-ANN model showed high
R
2and
Q
2values in the range 0.81–0.98. The agreement
between calculated and experimental values confirmed the ability of ANN-based equation to predict these parameters quickly
and at lower cost.
Keywords
Climatic parameters, neural network, modelling, physicochemical parameters
*
Corresponding author: Latifa Khaouane, Doctor
Email: [email protected]
As data on climatic factors are desirable for many areas of
research and applications in various fields, the objective
of this study is to predict the maximum and minimum air
temperature, sunshine duration, and relative humidity us
-ing ten physicochemical parameters of the water of Ghrib
dam. The present work is the first study in Algeria where
a multiple linear regression (MLR) and artificial neural net
-works ANN approach is proposed for the estimation of the
four climatic factors mentioned previously. Data collected
in 2003–2015 were used for the training and test phase,
while the data of 2016 were used to test the predictive
power of the MLP-ANN model. The performance and ro
-bustness of MLR and ANN models have been interpreted
based on some statistical criteria.
2 Materials and methods
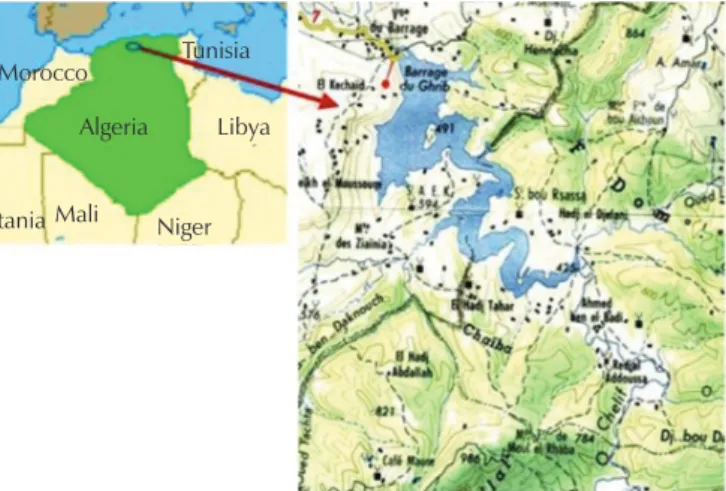
2.1 Study area and climatic data
The study was carried out in a region of Ain Defla, located
150
km west of the capital Algiers (Fig.
1). This vast stretch
of fertile land is used for agricultural purposes. The study
area is located at a longitude of 02° 33’14.00”E, at latitude
of 36° 07’52.90”N, and over 500 m elevation.
The observed monthly independent variables were obtained
from the National Agency of Hydraulic Resources (NAHR).
They were measured between the years of 2003 and 2016.
The database contained four dependant variables obtained
from National Office of Meteorology of Algeria (minimum
air temperature (T
air,min⁄
°C), maximum air temperature
(T
air,max
⁄ °C), relative humidity (RH ⁄
%), and sunshine duration
(SD
⁄
h) in addition to twelve independent variables: year
(Y), month (M), water temperature (T
water), oxygen saturation(O
2sat) chemical oxygen demand (COD), pH, electrical con-ductivity (EC), ammonium ion (NH4
+), nitrate ion (NO
3−),
turbidity (Turb), organic matter (OM), and dry residue (DR)
chosen as explanatory variables (or independent variables).
The minimum and maximum values of the selected input
parameters (independent variables) and output parameters
(dependent variables) are presented in Table 1.
2.2 Model development
The purpose of this study is to build models, which are
statistically robust both internally as well as externally. The
data set was divided into training and test sets. The
train-ing set was dedicated to develop the models, while the
test set, which included data that had not been used for
the development of the models, was left for testing the
optimality and the generalization ability of the developed
models.
20For models development, two statistical meth
-Table 1
–
Minimum and maximum values of the input and output data
Symbol
Minimum
Maximum
Inputs
water temperature
⁄
°C
T
water8.2
35.5
oxygen saturation ⁄ %
O
2sat31.5
135.5
chemical oxygen demand ⁄ mg
l
−1COD
5
148
pH value of hydrogen
pH
6.8
8.4
electrical conductivity ⁄
µS
cm
−1EC
1125
4083
ammonium ion ⁄ mg
l
−1NH
4+0
0.84
nitrate ion ⁄ mg
l
−1NO
3−0
31
turbidity ⁄ NTU
Turb
0.53
11
organic matter ⁄ mg
l
−1OM
2
18
dry residue ⁄ mg
l
−1DR
411
2996
year
Y
1
13
month
M
1
12
Outputs
minimum air temperature ⁄ °C
T
air,min−3.6
22.3
maximum air temperature ⁄
°C
T
air,max5.7
39.7
relative humidity ⁄ %
RH
38
89
sunshine duration ⁄ h
SD
91
379
Algeria
Mali
Niger
Libya
Morocco
Tunisia
tania
ods were used: (1) multiple linear regression (MLR), and (2)
artificial neural network (ANN).
2.3 Multiple linear regressions (MLR)
When the number of influencing variables is small, and
when they are not collinear and have a comprehensible
effect on the behaviour of the system or the observed de
-pendent size, the MLR- models can describe quite well the
complex nonlinear processes.
21MLRs consist of a quantita
-tive relationship between a group of independent variables
(X) and a dependent variable Y,
as shown in Eq.
(1):
0 1 N k k k
Y A
A X
==
+
∑
(1)
where Y is the dependent climatic variable; X
krepresents
independent climatic variables; A
krepresents the
coef-ficients of those variables, and
A
0is the intercept of the
equation. The quality of the model was determined by ex
-amining the regression statistical parameters (see validation
section). MLR calculations were performed using XLSTAT
2018 software.
2.4 Artificial neural network (ANN)
Artificial neural networks (ANNs) are biologically inspired
intelligent techniques. Various models of neural networks
are available, each with its specific properties and benefits
for particular applications. One of the most successful and
most popular is the multilayered perceptron artificial neu
-ral networks (MLP-ANN).
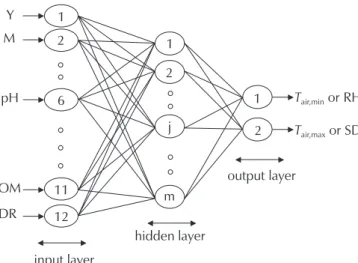
20MLP-ANN structure consists of
one input layer (it corresponds to the twelve independent
climatic variables), one intermediate or hidden layer, and
output layer corresponding to the four dependent climatic
variables (Fig.
2). Each layer can have a number of neu
-rons, which are connected linearly by weights to the neu
-rons in the neighbouring layers. In this study, MLP-ANN
calculations were performed by the STATISTICA software
(STATISTICA 10.0, Tulsa, StatSoft Inc., OK, USA).
2.5 Validation of models
Recent studies
20,23have indicated that validation is an
im-portant and necessary step to test the performance and
robustness of models. There are several validation
ap-proaches, including internal validation and external vali
-dation. Furthermore, external validation is a significant and
necessary validation method used to determine both the
generalizability and the true predictive ability of the mod
-els. The most important statistical parameters used in our
study to check the performance of the model are the root
mean square error (RMSE), the determination coefficient
(R
2), the cross validated correlation coefficient (
Q
2), and
the r
m2metrics (
) values for the training and test set.
For large deviations between the predicted and observed
response values, satisfactory
Q
2values may be obtained
if the molecules exhibit a considerably broad range of
response data. However, the r
m2metrics prevent this
er-ror and reflect model predictability in a better way.
24The
equations of these statistical parameters are available in the
literature.
233 Results and discussion
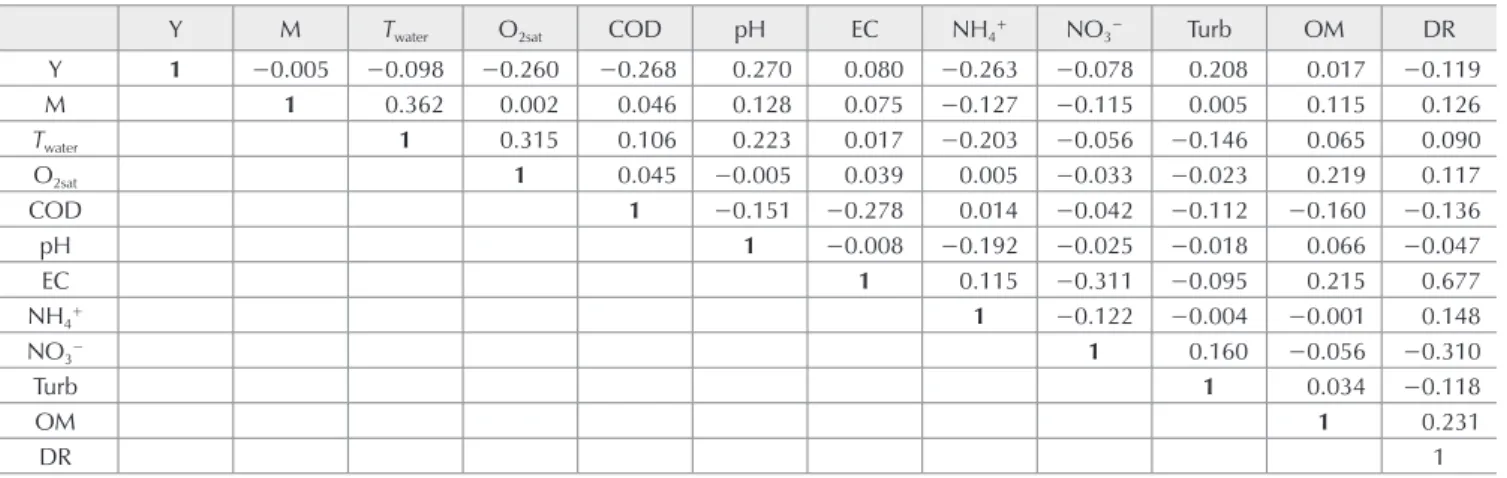
3.1 VIF and correlation analysis
In any multiple linear regression analysis, there must be
ensured that there is no multicollinearity between the used
independent variables (input variables). The variance infla
-tion factor (VIF) is used to check this multicollinearity. If VIF
falls into the range of 1–5, the variables are not correlated
with each other and the related model is acceptable.
22In
addition, the value of the correlation coefficient of each
pair of independent variables gives us information on their
degree of independence. The value of the VIF and the cor
-relation coefficients were calculated by XLSTAT software.
As may be seen from Table
2, all the variables have VIF
values of <2.994, indicating that the obtained model has
statistical significance. In addition, as indicated by Table
S2a to S2d (in supplementary files), the higher value of the
correlation coefficient of each pair of independent varia
-bles were equal to 0.682, which means that the varia-bles
were independent.
Y
M
1
1
1
2
2
2
6
11
12
m
j
pH
OM
input layer
hidden layer
output layer
T
air,minor RH
T
air,maxor SD
DR
Fig. 2
–
MLP-ANN architecture
Table 2
–
VIF analysis of independent variables
Independent
variables
T
air,max⁄ °C
T
air,min⁄ °C
RH ⁄ %
SD ⁄ h
Y
1.506
1.506
1.503
1.501
M
1.230
1.229
1.232
1.233
T
water1.450
1.454
1.449
1.451
O
2sat1.281
1.282
1.277
1.280
COD
1.246
1.245
1.238
1.237
pH
1.194
1.193
1.195
1.179
EC
2.992
2.940
2.993
2.994
NH
4+1.205
1.205
1.204
1.202
NO
3−1.227
1.219
1.228
1.227
Turb
1.132
1.134
1.133
1.132
OM
1.153
1.148
1.156
1.150
DR
2.930
2.881
2.932
2.942
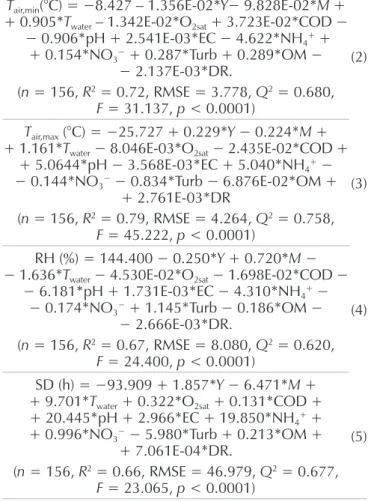
3.2 Results of MLR models
The MLR models obtained for the prediction of
T
air,min,
Tair,max
, RH, and SD are represented by the following equa
-tions (2 to 5) with the reported statistical parameters:
T
air,min(°C) = −8.427 – 1.356E-02*Y
− 9.828E-02*
M +
+ 0.905*T
water– 1.342E-02*O
2sat + 3.723E-02*COD −− 0.906*pH + 2.541E-03*EC − 4.622*NH4
++
+ 0.154*NO
3−+ 0.287*Turb + 0.289*OM −
− 2.137E-03*DR.
(n = 156, R
2= 0.72, RMSE = 3.778,
Q
2= 0.680,
F = 31.137, p < 0.0001)
(2)
T
air,max(°C) =
−25.727 + 0.229*
Y
− 0.224*
M +
+ 1.161*T
water − 8.046E-03*O2sat − 2.435E-02*COD ++ 5.0644*pH − 3.568E-03*EC + 5.040*NH
4+−
− 0.144*NO3
−− 0.834*Turb − 6.876E-02*OM +
+ 2.761E-03*DR
(n = 156, R
2= 0.79, RMSE = 4.264,
Q
2= 0.758,
F = 45.222, p < 0.0001)
(3)
RH (%) = 144.400 − 0.250*
Y + 0.720*M
−
− 1.636*
T
water − 4.530E-02*O2sat − 1.698E-02*COD −− 6.181*pH + 1.731E-03*EC − 4.310*NH4
+−
− 0.174*NO3
−+ 1.145*Turb − 0.186*OM −
− 2.666E-03*DR.
(n = 156, R
2= 0.67, RMSE = 8.080,
Q
2= 0.620,
F = 24.400, p < 0.0001)
(4)
SD (h) = −93.909 + 1.857*
Y
− 6.471*
M +
+ 9.701*T
water+ 0.322*O
2sat+ 0.131*COD +
+ 20.445*pH + 2.966*EC + 19.850*NH
4++
+ 0.996*NO
3−− 5.980*Turb + 0.213*OM +
+ 7.061E-04*DR.
(n = 156, R
2= 0.66, RMSE = 46.979,
Q
2= 0.677,
F = 23.065, p < 0.0001)
(5)
According to the MLR models, the predicted minimum air
temperature, maximum air temperature, relative humidity,
and sunshine duration are listed in Table S1
(Supplemen-tary file). As may be seen in Table
S1, the predicted values
for T
air,min,
Tair,max
, RH, and SD are satisfactory. The large
F
ratio (31.137; 45.222; 24.400, and 23.065) indicates that
equations (2 to 5) are sufficient to predict the four depend
-ent variables.
3.3 Results of MLP-ANN models
To obtain an optimal architecture of the network, one must
proceed essentially with an optimization of the elements
of the network. In addition, the database distribution, the
activation functions (for hidden neurons and output
neu-rons), the number of neurons in the hidden layer, and the
learning algorithms were optimized after several trials. The
optimal performance of the model was evaluated in terms
of RMSE.
25The monthly values between the years 2003
and 2015 of climatic data and physicochemical parame
-ters of Ghrib dam water (Y, M, T
water, O
2sat, COD, pH, EC,
NH
4+, NO
3−, Turb, OM, and DR) were used to train and
test the network. A total of 156 data samples were used.
The results of the optimization of the MLP-ANN model are
presented in Table
S3 in the supplementary file. The pre
-dictive results of the MLP-ANN models obtained are pre
-sented in Table
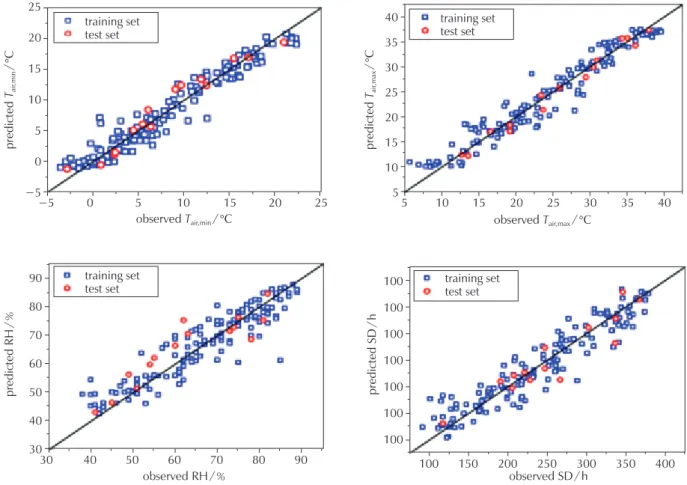
S1 (see Supplementary file). Fig.
3 shows
the regression line of the model equation,
i.e., predicted
against experimental values of
T
air,min,
Tair,max
, RH, and SD
for the training and validation set highlighted by different
symbols. Fig.
3 indicates that experimental values are in
good agreement with predicted values of T
air,min, Tair,max
, RH,
and SD. Furthermore, the main performance parameters of
the MLP-ANN models are presented in Table
3. As shown
in Table 3, all the values of the statistical parameters [R
2,
Q
2LOO
(LOO: Leave-one-out) and RMSE] of the training set
are acceptable. For the test set, the criteria of statistical ac
-ceptability are satisfactory, which proves that these models
have a good predictive power. Therefore, these results
re-veal that the MLP-ANN model not only performed well in
model development, but also had an excellent prediction.
According to the recommendation of Tropsha et al.
26and
Golbraikh et al.,
27if the difference between R
2and Q
2LOOdoes not exceed 0.3, there is no overfitting in the model.
In the present work, these two parameters have identical
values (0.94), indicating no overfitting in the MLP-ANN
models. In addition, PRESS is a good estimate of the real
prediction error of the model.
28To be a reasonable QSAR
model, PRESS/SSY should be smaller than 0.4, and a value
of this ratio smaller than 0.1 indicates an excellent model.
As part of this study, the PRESS/SSY ratio for
T
air,min, Tair,max,
RH, and SD was 0.062, 0.059, 0.145, and 0.114 , respec
-tively, proving that the developed model predicted better
than chance.
Moreover, Fig.
4 illustrates the comparison between the
observed and estimated four monthly mean climatic pa
-rameters (T
air,min,
Tair,max
, RH, and SD) using the two
MLP-ANN models. It was found that both neural network
mod-els reproduced the four climatic parameters very well over
several years.
To compare both the performance and the quality of pre
-diction of the two models used in this work (MLR and
MLP-Table 3
–
Statistical parameters and their values in MLP-ANN models
Internal validation
External validation
n
R
2RMSE
Q
2LOO
N
R
2RMSE
Q
2predT
air,min141 0.94
1.73
0.94
15 0.95
1.55
0.94
0.92
0.04
T
air,max141 0.94
2.20
0.94
15 0.98
1.21
0.98
0.93
0.02
RH
141 0.85
5.15
0.85
15 0.82
6.03
0.81
0.69
0.17
SD
141 0.89
26.32
0.89
15 0.87
24.37
0.88
0.81
0.03
Threshold
value
0.60
0.50
0.60
0.60
0.50
< 0.2
observed
T
air,min⁄
°
C
observed RH ⁄
%
observed SD ⁄ h
observed
T
air,max⁄
°
C
training set
training set
training set
training set
test set
test set
test set
test set
predicted
T
air,min⁄
°
C
predicted RH ⁄
%
predicted SD ⁄ h
predicted
T
air,max⁄
°
C
−5
30
30
40
50
60
70
80
90
−5
0
5
10
15
20
25
0
40
5
50
5
5
10
60
10
10
15
20
25
30
35
40
15
70
15
20
80
20
25
90
100
150
200
250
300
350
400
25
30
35
40
100
100
100
100
100
100
100
Fig. 3
–
Plot of predicted values of
T
air, min,
T
air, max, RH, and SD from the MLP-ANN model
vs.
observed values for the training, and test sets
t
⁄ months
t
⁄ months
t
⁄ months
t
⁄ months
T
air,min⁄
°
C
RH ⁄
%
SD ⁄ h
T
air,max⁄
°
C
0
0
0
0
−5
0
0
5
10
10
15
20
20
30
25
100
500
400
300
200
100
0
90
80
70
60
50
40
30
40
50
50
50
50
100
100
100
100
150
150
150
150
exp
exp
exp
exp
cal
cal
cal
cal
Fig. 4
–
Comparison between the observed and estimated monthly mean climatic parameters (
T
air, min,
T
air, max, RH, and SD) using the
ANN), a statistical comparison of the two models is given
in Table
4. The correlation coefficients with values >
0.68
indicated that the predicted values were acceptable.
How-ever, the prediction determined by the MLP-ANN model
was considerably better than those given by the MLR mod
-el. Therefore, a substantial improvement of the statistical
parameters for the MLP-ANN model can be noted. Thus,
it can be concluded that the MLP-ANN model has better
predictive power than the MLR model. This means that the
model obtained with an MLP-ANN allows to a large ex
-tent the establishment of a nonlinear relationship between
output variables (T
air,min, T
air,max, RH, and SD) and the input
variables (Y,
M, T
water, O
2 sat, COD, pH, EC, NH
4+, NO
3−,
Turb, OM, and DR).
Table 4
–
Comparison of statistical data obtained by the two
models
Models
n
R
2RMSE
Q
2or
Q
2 LOOT
air,minMLP-ANN
156
0.96
1.72
0.94
MLR
0.72
3.78
0.68
T
air,maxMLP-ANN
MLR
156
0.98
0.79
2.12
4.26
0.94
0.76
RH
MLP-ANN
156
0.99
5.25
0.85
MLR
0.67
8.08
0.62
SD
MLP-ANN
156
0.98
26.14
0.89
MLR
0.67
46.98
0.68
3.4 Application of artificial neural
network-based equation
Two architectures of the MLP-ANN network were ob
-tained. For
T
air,minand Tair,max, the network has twelve inputs
(x
i,i = 1 to 12), one output (Z = T
air,minor Z = T
air,max), and
four neurons in the hidden layer. The two transfer func
-tions used in this study are hyperbolic tangent and logistic
function. Their mathematical definitions are given in Eqs.
(6) and (7):
( )
e e
xx xxf x
e e
−−−
=
+
(6)
1
( )
1
xf x
e
−=
+
(7)
Each of these twelve neurons in input layer receives one
input (X
i,i = 1 to 12)) and broadcasts such signal to each
one of the hidden layer’s neurons. Each hidden neuron
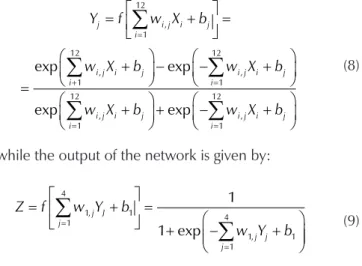
computes its transfer function and sends its result (Y
j,j = 1
to 4) to the output layer’s neuron, which finally produces
the response of the network (Z). The output signal of each
hidden neuron (Y
j) is calculated as:
12 12 , , 12 1 1 , 12 12 1 , , 1 1
exp
exp
exp
exp
i j i j i j i j i i j i j i j i i j i j i j i j i iw X b
w X b
Y f
w X b
w X b
w X b
+ = = = =
+
−
−
+
=
+
=
+
+
−
+
∑
∑
∑
∑
∑
12 12 , , 12 1 1 , 12 12 1 , , 1 1exp
exp
exp
exp
i j i j i j i j i i j i j i j i i j i j i j i j i iw X b
w X b
Y f
w X b
w X b
w X b
+ = = = =
+
−
−
+
=
+
=
+
+
−
+
∑
∑
∑
∑
∑
(8)
while the output of the network is given by:
4 1, 1 4 1 1, 1 11
1 exp
j J j j j jZ f
w Y b
w Y b
= =
=
+
=
+
−
+
∑
∑
(9)
For RH and SD, the network has twelve inputs (
x
i,i = 1 to
12), one output (Z =
RH or
Z = SD) and seven neurons
in the hidden layer. The two transfer functions used in this
study are hyperbolic tangent and identity function. The
output signal of each hidden neuron (Y
j) is calculated as:
12 12 , , 12 1 1 , 12 12 1 , , 1 1
exp
exp
exp
exp
i j i j i j i j i i j i j i j i i j i j i j i j i iw X b
w X b
Y f
w X b
w X b
w X b
+ = = = =
+
−
−
+
=
+
=
+
+
−
+
∑
∑
∑
∑
∑
12 12 , , 12 1 1 , 12 12 1 , , 1 1exp
exp
exp
exp
i j i j i j i j i i j i j i j i i j i j i j i j i iw X b
w X b
Y f
w X b
w X b
w X b
+ = = = =
+
−
−
+
=
+
=
+
+
−
+
∑
∑
∑
∑
∑
(10)
while the output of the network is given by:
7 7 1, 1 1, 1 1 j J 1 j J j j
Z f
w Y b
w Y b
= =
=
+
=
+
∑
∑
(11)
In Eqs. (9 and 11),
w
i,jare the weights of the connections
between the input and hidden neurons, X
iare the input
variables, and b
jis the bias on hidden neuron j
. Similarly,
w
1,jrepresents the weights of the connections between the
hidden and the output neuron, and b
1is the bias on the
output neuron.
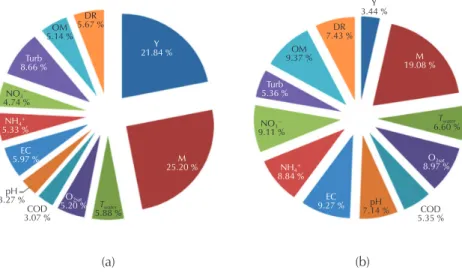
The contribution of the input variables on the output was
determined by a sensitivity analysis using the “Weight”
method and thus for each neural network (NN1and NN2).
This method, proposed by
Garson
29then taken by
Goh,
30provides a quantification of the relative importance of the
inputs on the output of neural network. The contribution
results are shown in Fig.
5. For NN1, the most important
variables that may influence air temperature (
T
air,minand
Tair,max
) are year and month with a contribution of 47
%. For
NN2, the month has the largest contribution of 19 %, and
the other inputs have a close importance on the outputs
(relative humidity and sunshine duration).
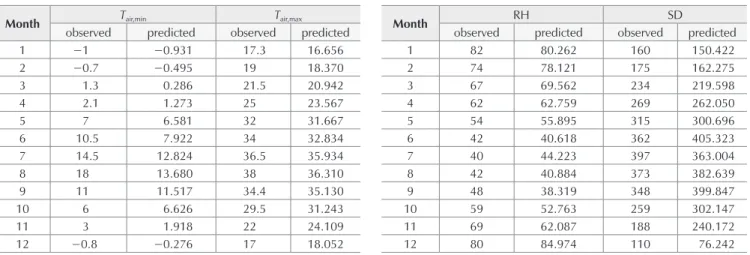
The two MLP-ANN models were tested to predict the cli
-matic parameters (T
air,min,
Tair,max
, RH, and SD) during the
year 2016. This prediction was made using the mathemat
-ical formulas (Eqs.
9 and 11). With these formulas, the four
climatic parameters were calculated and carried out for
comparison with experimental values (Table
S4 in
Supple-mentary file). The results are shown in Fig.
6. It has been
found that the monthly-predicted values of these climatic
parameters are close to the measured values.
4 Conclusion
In this study, two statistical approaches (MLR and
MLP-ANN) were developed based on twelve independent
vari-ables (year, month, water temperature, oxygen saturation,
chemical oxygen demand, pH, electrical conductivity, am
-monium ion, nitrate ion, turbidity, organic matter, and dry
residue) to predict successively the maximum and mini
-mum air temperature, the relative humidity, and sunshine
duration in the area of Ain Defla of Algeria. The models
were trained, and tested using a sample of 156 data of
cli-matic and physicochemical parameters of Ghrib dam water
(Ain Defla), measured monthly over a period of 13
years,
from 2003 and 2015. The monthly data for the year 2016
Y 21.84 % Y 3.44 % DR 5.67 % OM 5.14 % Turb 8.66 % NO3− 4.74 % NO3− 9.11 % NH4+ 5.33 % NH4+ 8.84 % EC 5.97 % EC 9.27 % pH 3.27 % pH 7.14 % O2sat 5.20 % O2sat 8.97 % M 25.20 % COD 3.07 % 5.35 %COD Twater 5.88 %
(a)
(b)
Twater 6.60 % DR 7.43 % M 19.08 % OM 9.37 % Turb 5.36 %Fig. 5
–
Relative importance of different inputs: (a) NN1, (b) NN2
−5
0
5
10
15
20
500
400
300
200
100
0
90
80
70
60
50
40
30
20
10
25
15
20
30
35
40
exp
exp
exp
exp
cal
cal
cal
cal
0
1
2 3 4 5 6 7 8 9 10 11 12
0
1
2 3 4 5 6 7 8 9 10 11 12
0
1
2 3 4 5 6 7 8 9 10 11 12
0
1
2 3 4 5 6 7 8 9 10 11 12
t
⁄ months
t
⁄ months
t
⁄ months
t
⁄ months
T
air,min⁄
°
C
RH ⁄
%
T
air,max⁄
°
C
SD ⁄ h
were used to test the predictive power of the MLP-ANN
model. The variation inflation factor (VIF) and correlation
analysis showed the rightness of the choice of the twelve
variables. The predicted values obtained with the MLR and
MLP-ANN models were compared to each other and with
the experimental data. However, this comparison showed
a higher predictive capability of the MLP-ANN. The built
MLP-ANN model was subjected to internal and external
validation. It showed good R
2and Q
2LOO values for thetraining set, good values of R
2and Q
2pred
for the test set. In
addition, the robustness and predictive power of the
mod-el were verified by
. Moreover, the estimation of
the 4 parameters (T
air,min, Tair,max
, RH, and SD) based on the
developed mathematical equation using the weights of the
network gave very good results when applied to the year
2016. Thus, compared to the methods used by the mete
-orological services for the estimation of the maximum and
minimum air temperature, relative humidity and sunshine
duration, it is obvious that the MLP-ANN model is faster
and cheaper. Therefore, this model has great economic
benefits for a developing country like Algeria.
ACKNOWLEDGEMENTS
The authors wish to thank the National Agency of Hydrau
-lic Resources (NAHR) and the National Office of Meteorol
-ogy (ONM) for the data made available to us.
List of abbreviations
ANFIS – Adaptive Neuro-Fuzzy Inference System
ANN
– Artificial Neural Network
BFGS
– Broyden–Fletcher–Goldfarb–Shanno
COD
– Chemical Oxygen Demand
DR
– Dry Residue
EC
– Electrical Conductivity
GA
– Genetic Algorithms
LM-BP – Levenberg-Marquardt Back-Propagation
M
– Month
MLF
– Multi-Layer Feed-forward
MLP
– Multi-Layer Perceptron
MLR
– Multiple Linear Regressions
NAHR – National Agency of Hydraulic Resources
NOM
– National Office of Meteorology
OM
– Organic Matter
RH
– Relative Humidity
RMSE – Root Mean Square Error
SD
– Sunshine Duration
Turb
– Turbidity
VIF
– Variation Inflation Factor
WMO
– World Meteorological Organization
Y
– Year
References
Literatura
1.
WMO: World Meteorological Organization Global Climate
Observing System. www.wmo.int/pages/prog/gcos/index.
php?name=EssentialClimateVariables
.
2.
M. Afzali, A. Afzali, G. Zahedi
, The Potential of Artificial Neu
-ral Network Technique in Daily and Monthly Ambient Air
Temperature Prediction, Int. J. Environ. Sci. Dev.
3
(2012)
33–38, doi:
https://doi.org/10.7763/IJESD.2012.V3.183
.
3.
A. P. Matzarakis, V. D. Katsoulis
, Sunshine duration hours
over the Greek region, Theor. Appl. Climatol.
83
(2006)
107–120, doi:
https://doi.org/10.1007/s00704-005-0158-8
.
4.
V. Martinez-Martinez, C. Baladrón, J. Gomez-Gil, G.
Ruiz-Ruiz, L. M. Navas-Gracia, J. M. Aguiar, B. Carro
, Temperature
and Relative Humidity Estimation and Prediction in the To
-bacco Drying Process Using Artificial Neural Networks, Sen
-sors.
12
(2012) 14004–14021, doi:
https://doi.org/10.3390/
s121014004.
5.
A. Yasar, E. Simsek, M. Bilgili, A. Yucel, I. Ilhan
, Estimation
of relative humidity based on artificial neural network ap
-proach in the Aegean Region of Turkey, Meteorol. Atmos.
Phys.
115
(2012) 81–87, doi:
https://doi.org/10.1007/
s00703-011-0168-2.
6.
J. Almorox,C. Hontoria
, Global solar radiation estimation
using sunshine duration in Spain, Energ. Convers. Manage.
45
(2004) 1529–1535, doi:
https://doi.org/10.1016/j.encon
-man.2003.08.022.
7.
M. Ben El Houari, O. Zegaoui, A. Abdallaoui
, Development
of an Artificial Neural Network model to predict the monthly
air temperature in the region of Meknes (Morocco), Int. Res.
J. Comput. Sci. (IRJCS)
2
(2015) 18–27,
http://www.irjcs.
com/volume-2-issue-11
.
8.
J. D. Jang,A. A. Viau, F. Anctil
, Neural network estimation of
air temperatures from AVHRR data, Int. J. Remote Sens.
25
(2004) 4541–4554, doi:
https://doi.org/10.1080/01431160
310001657533.
9.
K. I. Chronopoulos, I. X. Tsiros, I. F. Dimopoulos, N. Alvertos
,
An application of artificial neural network models to esti
-mate air temperature data in areas with sparse network of
meteorological stations, J. Environ. Sci. Health. Part A Tox
-ic/Hazard. Subst. Environ. Eng.
43
(2008) 1752–1757, doi:
https://doi.org/10.1080/10934520802507621
.
10.
M. Bilgili, B. Sahin
, Prediction of long-term monthly temper
-ature and rainfall in Turkey, Energy Sources, Part A.
32
(2010)
60–71, doi:
https://doi.org/10.1080/15567030802467522
.
11.
O. Kisi, J. Shiri,
Prediction of long-term monthly air temper
-ature using geographical inputs, Int. J. Climatol.
34
(2014)
179–186, doi:
https://doi.org/10.1002/joc.3676
.
12.
M. Cobaner, H. Citakoglu, O. Kisi, T. Haktanir
, Estimation of
mean monthly air temperatures in Turkey, Comput. Electron.
Agric.
109
(2014) 71–79, doi:
https://doi.org/10.1016/j.
compag.2014.09.007.
13.
K. Yamamoto, T. Togami, N. Yamaguchi, S. Ninomiya
,
Ma-chine Learning-Based Calibration of Low-Cost Air Tempera
-ture Sensors Using Environmental Data, Sensors.
17
(2017)
1290, doi:
https://doi.org/10.3390/s17061290
.
14.
I. Tasadduq, S. Rehman, K. Bubshait
, Application of neural
networks for the prediction of hourly mean surface temper
-atures in Saudi Arabia, Renew. Energ.
25
(2002) 545–554,
doi:
https://doi.org/10.1016/S0960-1481(01)00082-9
.
15.
F
. Almonacid, P. Pérez-Higueras, P. Rodrigo, L. Hontoria
,
Generation of ambient temperature hourly time series for
some Spanish locations by artificial neural networks, Renew.
Energ.
51
(2013)285–291, doi:
https://doi.org/10.1016/j.
renene.2012.09.022.
16.
M. T. Dastorani, S. Poormohammadi
, Mapping of climatic
parameters under climate change impacts in Iran, Hydrolog.
Sci. J.
61
(2016) 2552–2566, doi:
https://doi.org/10.1080/02
626667.2015.1131898.
17.
H. M. Kandirmaz, K. Kaba, M. Avci
, Estimation of Monthly
Sunshine Duration in Turkey Using Artificial Neural Net
-works. Int. J. Photoenergy, Volume 2014, Article ID 680596,
9 pages, doi:
https://doi.org/10.1155/2014/680596
.
18.
M. A. Behrang, E. Assareh, A. Ghanbarzadeh, A. R.
Noghre-habadi
, The potential of different artificial neural network
(ANN) techniques in daily global solar radiation modeling
based on meteorological data, Sol. Energy.
84
(2010) 1468–
1480, doi:
https://doi.org/10.1016/j.solener.2010.05.009
.
19.
A. Rahimikhoob
, Estimating global solar radiation using artifi
-cial neural network and air temperature data in a semi-arid
environment. Renew. Energy.
35
(2010) 2131–2135, doi:
https://doi.org/10.1016/j.renene.2010.01.029
.
20.
S. Bitam, M. Hamadache, S. Hanini
, Prediction of therapeu
-tic potency of tacrine derivatives as BuChE inhibitors from
quantitative structure–activity relationship modelling. SAR,
QSAR. Environ. Res.
29
(2018) 213–230, doi:
https://doi.or
g/10.1080/1062936X.2018.1423640
.
21.
M. Curlin, A. Bevetek, Z. Lezajic, B. Deveric Mestrovic, Z.
Kur-tanjek,
Modelling of Activated Sludge Wastewater Treatment
Process in Municipal Plant in Velika Gorica, Kem. Ind.
57
(2008) 59–67,
https://hrcak.srce.hr/19772
.
22.
M. Hamadache, L. Khaouane, O. Benkortbi, C. Si Moussa, S.
Hanini, A. Amrane
, Prediction of Acute Herbicide Toxicity in
Rats from Quantitative Structure–Activity Relationship Mod
-eling, Environ. Eng. Sci.
31
(2014) 243–252, doi:
https://doi.
org/10.1089/ees.2013.0466
.
23.
M. Hamadache, S. Hanini, O. Benkortbi, A. Amrane, L.
Khaouane, C. Si Moussa
, Artificial neural network-based
equation to predict the toxicity of herbicides on rats, Che
-mometr. Intell. Lab.
154
(2016a) 7–15, doi:
https://doi.
org/10.1016/j.chemolab.2016.03.007
.
24.
K. Roy, P. Ambure, S. Kar, P. K. Ojha,
Is it possible to improve
the quality of predictions from an “intelligent” use of mul
-tiple QSAR/QSPR/QSTR models?, J. Chemom. (2018), doi:
https://doi.org/10.1002/cem.2992
.
25.
M. Hamadache, O. Benkortbi, S. Hanini, A. Amrane, L.
Khaouane, C. Si Moussa
, A Quantitative Structure Activity
Relationship for acute oral toxicity of pesticides on rats: Val
-idation, domain of application and prediction, J. Hazard.
Mater.
303
(2016b) 28–40, doi:
https://doi.org/10.1016/j.
jhazmat.2015.09.021
.
26.
A. Tropsha, P. Gramatica, V. K. Gombar
, The importance of
being earnest: validation is the absolute essential for
success-ful application and interpretation of QSPR models, QSAR.
Comb. Sci.
22
(2003) 69–77, doi:
https://doi.org/10.1002/
qsar.200390007
.
27.
A. Golbraikh, M. Shen, Z. Y. Xiao, Y. D. Xiao, K. H. Lee
,
A.
Tropsha
, Rational selection of training and test sets for
the development of validated QSAR models, J. Comput.
Aided. Mol. Des.
17
(2003) 241–253, doi:
https://doi.
org/10.1023/A:1025386326946
.
28.
M. Hamadache, O. Benkortbi, S. Hanini, A. Amrane
, QSAR
modeling in ecotoxicological risk assessment: application
to the prediction of acute contact toxicity of pesticides on
bees (
Apis mellifera
L.), Environ. Sci. Pollut. Res.
25
(2017)
896–907, doi:
https://doi.org/10.1007/s11356-017-0498-9
.
29.
G. D. Garson
, Interpreting neural network connection
weights, Art. Intell. Expert.
6
(1991) 47–51,
http://dl.acm.
org/citation.cfm?id=129449.129452
.
30.
A. T. C. Goh
, Back-propagation neural networks for mode
-ling complex systems, Art Intell Eng.
9
(1995) 143–151, doi:
https://doi.org/10.1016/0954-1810(94)00011-S
.
SAŽETAK
Predviđanje klimatskih parametara iz fizikalno-kemijskih parametara
pomoću umjetnih neuronskih mreža: studija slučaja Ain Defla (Alžir)
Lamia Gheraba, Latifa Khaouane,
*Othmane Benkortbi,
Salah Hanini i Mabrouk Hamadache
Poznavanje klime neke regije osnovni je zadatak jer omogućuje predviđanje klimatskih parametara
u budućnosti. U ovom su istraživanju maksimalna i minimalna mjesečna temperatura zraka (
T
air, min,
T
air, max), relativna vlažnost (RH) i trajanje sunčeve svjetlosti (SD) modelirani višestrukom linearnom
regresijom (MLR) i višeslojnim perceptronskim metodama (MLP). Za četiri klimatska parametra
interna i eksterna validacija modela MLP-ANN pokazala je visoke vrijednosti
R
2i
Q
2u području
0,81 – 0,98. Usklađenost izračunatih i eksperimentalnih vrijednosti potvrdilo je da jednadžba
temeljena na ANN-u brzo i uz niže troškove predviđa te parametre.
Ključne riječi
Klimatski parametri, neuronska mreža, modeliranje, fizikalno-kemijski parametri
Izvorni znanstveni rad
Prispjelo 26. siječnja 2019.
Prihvaćeno 7. travnja 2019.
Laboratoire de Biomatériaux et Phénomènes de
Transport (LBMPT), Université de Médéa
Pôle urbain, 26 000
MEDEA, Alžir
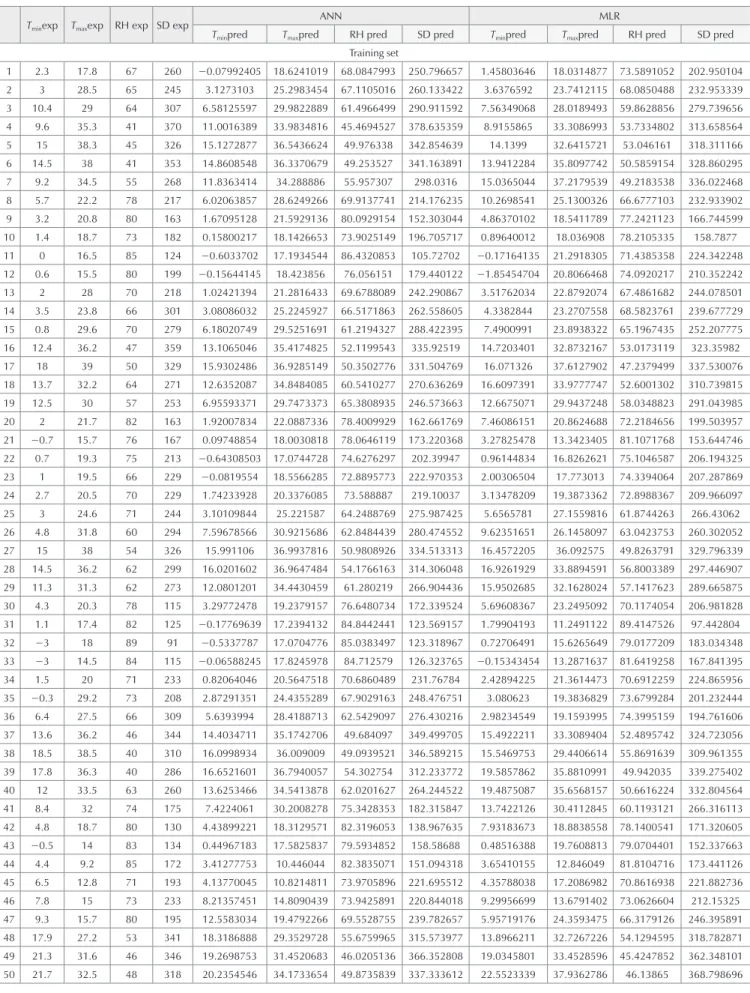
Supplementary file
Table S1
–
Dataset and Corresponding Observed Values in Addition to Multiple Linear Regression and Artificial Neural Network pre
-dicted values of the maximum and minimum air temperature, the relative humidity and sunshine duration.
Tminexp Tmaxexp RH exp SD exp ANN MLR
Tminpred Tmaxpred RH pred SD pred Tminpred Tmaxpred RH pred SD pred
Training set 1 2.3 17.8 67 260 −0.07992405 18.6241019 68.0847993 250.796657 1.45803646 18.0314877 73.5891052 202.950104 2 3 28.5 65 245 3.1273103 25.2983454 67.1105016 260.133422 3.6376592 23.7412115 68.0850488 232.953339 3 10.4 29 64 307 6.58125597 29.9822889 61.4966499 290.911592 7.56349068 28.0189493 59.8628856 279.739656 4 9.6 35.3 41 370 11.0016389 33.9834816 45.4694527 378.635359 8.9155865 33.3086993 53.7334802 313.658564 5 15 38.3 45 326 15.1272877 36.5436624 49.976338 342.854639 14.1399 32.6415721 53.046161 318.311166 6 14.5 38 41 353 14.8608548 36.3370679 49.253527 341.163891 13.9412284 35.8097742 50.5859154 328.860295 7 9.2 34.5 55 268 11.8363414 34.288886 55.957307 298.0316 15.0365044 37.2179539 49.2183538 336.022468 8 5.7 22.2 78 217 6.02063857 28.6249266 69.9137741 214.176235 10.2698541 25.1300326 66.6777103 232.933902 9 3.2 20.8 80 163 1.67095128 21.5929136 80.0929154 152.303044 4.86370102 18.5411789 77.2421123 166.744599 10 1.4 18.7 73 182 0.15800217 18.1426653 73.9025149 196.705717 0.89640012 18.036908 78.2105335 158.7877 11 0 16.5 85 124 −0.6033702 17.1934544 86.4320853 105.72702 −0.17164135 21.2918305 71.4385358 224.342248 12 0.6 15.5 80 199 −0.15644145 18.423856 76.056151 179.440122 −1.85454704 20.8066468 74.0920217 210.352242 13 2 28 70 218 1.02421394 21.2816433 69.6788089 242.290867 3.51762034 22.8792074 67.4861682 244.078501 14 3.5 23.8 66 301 3.08086032 25.2245927 66.5171863 262.558605 4.3382844 23.2707558 68.5823761 239.677729 15 0.8 29.6 70 279 6.18020749 29.5251691 61.2194327 288.422395 7.4900991 23.8938322 65.1967435 252.207775 16 12.4 36.2 47 359 13.1065046 35.4174825 52.1199543 335.92519 14.7203401 32.8732167 53.0173119 323.35982 17 18 39 50 329 15.9302486 36.9285149 50.3502776 331.504769 16.071326 37.6127902 47.2379499 337.530076 18 13.7 32.2 64 271 12.6352087 34.8484085 60.5410277 270.636269 16.6097391 33.9777747 52.6001302 310.739815 19 12.5 30 57 253 6.95593371 29.7473373 65.3808935 246.573663 12.6675071 29.9437248 58.0348823 291.043985 20 2 21.7 82 163 1.92007834 22.0887336 78.4009929 162.661769 7.46086151 20.8624688 72.2184656 199.503957 21 −0.7 15.7 76 167 0.09748854 18.0030818 78.0646119 173.220368 3.27825478 13.3423405 81.1071768 153.644746 22 0.7 19.3 75 213 −0.64308503 17.0744728 74.6276297 202.39947 0.96144834 16.8262621 75.1046587 206.194325 23 1 19.5 66 229 −0.0819554 18.5566285 72.8895773 222.970353 2.00306504 17.773013 74.3394064 207.287869 24 2.7 20.5 70 229 1.74233928 20.3376085 73.588887 219.10037 3.13478209 19.3873362 72.8988367 209.966097 25 3 24.6 71 244 3.10109844 25.221587 64.2488769 275.987425 5.6565781 27.1559816 61.8744263 266.43062 26 4.8 31.8 60 294 7.59678566 30.9215686 62.8484439 280.474552 9.62351651 26.1458097 63.0423753 260.302052 27 15 38 54 326 15.991106 36.9937816 50.9808926 334.513313 16.4572205 36.092575 49.8263791 329.796339 28 14.5 36.2 62 299 16.0201602 36.9647484 54.1766163 314.306048 16.9261929 33.8894591 56.8003389 297.446907 29 11.3 31.3 62 273 12.0801201 34.4430459 61.280219 266.904436 15.9502685 32.1628024 57.1417623 289.665875 30 4.3 20.3 78 115 3.29772478 19.2379157 76.6480734 172.339524 5.69608367 23.2495092 70.1174054 206.981828 31 1.1 17.4 82 125 −0.17769639 17.2394132 84.8442441 123.569157 1.79904193 11.2491122 89.4147526 97.442804 32 −3 18 89 91 −0.5337787 17.0704776 85.0383497 123.318967 0.72706491 15.6265649 79.0177209 183.034348 33 −3 14.5 84 115 −0.06588245 17.8245978 84.712579 126.323765 −0.15343454 13.2871637 81.6419258 167.841395 34 1.5 20 71 233 0.82064046 20.5647518 70.6860489 231.76784 2.42894225 21.3614473 70.6912259 224.865956 35 −0.3 29.2 73 208 2.87291351 24.4355289 67.9029163 248.476751 3.080623 19.3836829 73.6799284 201.232444 36 6.4 27.5 66 309 5.6393994 28.4188713 62.5429097 276.430216 2.98234549 19.1593995 74.3995159 194.761606 37 13.6 36.2 46 344 14.4034711 35.1742706 49.684097 349.499705 15.4922211 33.3089404 52.4895742 324.723056 38 18.5 38.5 40 310 16.0998934 36.009009 49.0939521 346.589215 15.5469753 29.4406614 55.8691639 309.961355 39 17.8 36.3 40 286 16.6521601 36.7940057 54.302754 312.233772 19.5857862 35.8810991 49.942035 339.275402 40 12 33.5 63 260 13.6253466 34.5413878 62.0201627 264.244522 19.4875087 35.6568157 50.6616224 332.804564 41 8.4 32 74 175 7.4224061 30.2008278 75.3428353 182.315847 13.7422126 30.4112845 60.1193121 266.316113 42 4.8 18.7 80 130 4.43899221 18.3129571 82.3196053 138.967635 7.93183673 18.8838558 78.1400541 171.320605 43 −0.5 14 83 134 0.44967183 17.5825837 79.5934852 158.58688 0.48516388 19.7608813 79.0704401 152.337663 44 4.4 9.2 85 172 3.41277753 10.446044 82.3835071 151.094318 3.65410155 12.846049 81.8104716 173.441126 45 6.5 12.8 71 193 4.13770045 10.8214811 73.9705896 221.695512 4.35788038 17.2086982 70.8616938 221.882736 46 7.8 15 73 233 8.21357451 14.8090439 73.9425891 220.844018 9.29956699 13.6791402 73.0626604 212.15325 47 9.3 15.7 80 195 12.5583034 19.4792266 69.5528755 239.782657 5.95719176 24.3593475 66.3179126 246.395891 48 17.9 27.2 53 341 18.3186888 29.3529728 55.6759965 315.573977 13.8966211 32.7267226 54.1294595 318.782871 49 21.3 31.6 46 346 19.2698753 31.4520683 46.0205136 366.352808 19.0345801 33.4528596 45.4247852 362.348101 50 21.7 32.5 48 318 20.2354546 34.1733654 49.8735839 337.333612 22.5523339 37.9362786 46.13865 368.798696
Tminexp Tmaxexp RH exp SD exp
ANN MLR
Tminpred Tmaxpred RH pred SD pred Tminpred Tmaxpred RH pred SD pred
Training set 51 17.6 27.3 54 264 17.0957762 26.3586172 54.7419607 303.606096 15.6819141 28.5768035 58.8813524 291.944215 52 15.3 23.4 60 207 13.4680725 19.9650189 68.6272453 222.393262 10.2872854 26.5477816 67.6246168 232.086611 53 6.8 13.1 81 215 7.5085698 13.0292696 78.61773 160.623398 8.56255889 19.1269416 75.4904842 186.802039 54 4.6 8.6 87 117 3.95556605 10.1000683 83.9126323 126.963939 6.59022245 12.3161805 80.9082702 151.667877 55 2.1 8.2 75 217 3.33171075 10.1685965 78.1551313 176.347754 1.93385652 15.3879555 76.668061 195.64141 56 7 5.7 83 141 4.35814834 10.9701526 86.1100756 124.557448 −0.71230002 8.84645545 90.0711445 125.218532 57 6.7 13.4 75 178 5.50446069 12.6891022 77.6816084 186.476342 4.7493208 18.7692353 74.1892472 198.975305 58 8.8 16.7 71 221 10.0440993 16.3792675 74.8133632 215.736514 10.2822911 21.0705261 68.1844804 250.731454 59 15.9 25.4 52 334 14.0034086 21.4946019 63.6423117 274.333296 8.1518625 25.3942616 63.7923092 262.040154 60 19.2 28.9 85 341 19.1341643 30.9833214 61.106578 283.297677 15.8623344 32.3641802 54.9258962 322.216382 61 22.3 33.1 48 351 19.018291 30.6207086 53.8039459 319.417233 11.8511825 28.845228 61.1249083 279.841466 62 19.7 30.3 53 337 19.0851197 30.639113 52.280733 322.619878 14.8563064 26.2217832 60.7888118 285.214128 63 15.6 25.2 62 268 16.6812961 25.3875589 59.721405 275.480745 12.0445498 24.2001463 64.5944945 250.74012 64 13.5 21.8 71 262 12.872061 19.181751 68.0211077 230.919593 12.2416237 20.2433314 70.752811 235.739948 65 0.7 13.1 79 168 7.10046794 12.6499754 75.9763297 174.567679 5.83698627 15.3238651 76.5127969 180.983704 66 3.9 8.4 88 122 3.8989374 10.0462681 87.7250832 103.87515 2.3891941 4.06239748 93.1226136 91.2255471 67 2.2 6.9 86 117 3.69216989 10.4444677 86.6294575 142.821456 4.51002921 12.9336904 79.3793332 183.690145 68 3 8.3 84 127 4.41104779 11.0146496 82.9243572 157.17035 2.43861198 10.6412031 81.7687395 159.95821 69 7.3 14.7 73 248 6.1989923 12.5268987 78.1600858 193.947302 4.89744235 13.5098893 77.6732757 182.638441 70 11.6 19.9 63 245 11.1875567 17.7844729 65.7601284 252.278715 12.4279335 19.8293106 68.8906722 240.967013 71 15.8 24.4 63 265 15.5748453 24.0179042 63.1739596 279.520191 15.0657589 25.0819618 58.0305054 293.720353 72 18.4 28.9 51 277 17.1041603 26.6995271 52.8229376 327.990171 7.23542439 25.0281193 65.7680871 246.955396 73 22.2 32.7 43 374 20.0133328 33.1670987 44.6245128 374.511005 16.0470613 30.3494583 52.7347345 319.278838 74 19 30.3 56 374 20.2170972 33.4724557 49.0417711 340.592314 17.8228264 36.2030308 49.9095847 342.987086 75 16.7 25.7 65 277 17.8836676 27.8238389 63.8395615 266.490258 13.983529 30.8437741 59.0552573 278.77614 76 16.1 24.6 58 270 13.6986119 20.257649 66.6785603 233.10156 12.8160581 27.1000913 62.6898823 253.080231 77 9.8 17.1 68 218 8.61239327 14.0696064 75.5061513 180.720043 4.55894552 19.8220257 75.8634662 180.627482 78 5.2 9.6 87 127 4.97359012 10.8410104 83.5713614 130.531678 5.55598166 13.1575623 82.2033274 140.928916 79 5.8 12.7 71 222 3.34659165 10.2312865 69.2149737 235.657663 0.99581166 13.869749 80.552125 184.29873 80 6 11.2 86 128 5.31759993 11.7891562 79.3842447 180.077416 9.06845706 22.1140028 67.7162001 251.963806 81 4.8 11.2 79 204 5.51072916 11.9264514 76.60878 189.588074 0.35923311 11.2624051 83.3153818 161.935969 82 8.6 14.8 84 165 8.9761395 15.2126986 76.6397274 201.808211 4.74669303 15.6447944 75.8878157 201.176742 83 12.4 21.2 62 301 14.5104784 22.33133 59.2298719 298.135878 11.7179356 28.7338362 57.8056742 300.727802 84 16.7 27.5 60 348 18.0495791 28.5959593 55.7591911 313.184052 12.8841433 24.5332418 64.4373232 266.563755 85 21.8 32.5 42 379 19.9459107 32.8727295 43.824148 375.634666 17.4053016 33.482106 51.8106914 329.168551 86 17.5 26.8 62 261 17.5809198 27.1530002 59.0114991 279.118343 12.9525126 30.0579223 60.1633845 280.781104 87 6.8 12.9 78 187 7.70635976 13.1993127 78.9582631 158.100559 5.52309618 14.9783811 80.6547075 162.760189 88 4.2 9.4 82 167 4.99291565 11.0976025 77.3898042 172.57878 0.90177143 16.7958995 80.8830736 151.310055 89 5.1 11.3 80 221 3.33544858 10.1731304 74.5426984 223.728917 3.00007398 11.8759698 79.8388324 191.852783 90 5.6 12.4 75 213 4.34485447 10.9652893 75.4514484 217.866062 3.25376207 12.7775433 79.1776611 195.275278 91 9.2 17.6 60 261 9.15841308 15.8267606 69.7055708 239.636921 3.34490079 20.9715967 72.6133841 216.522678 92 11.1 20.1 73 209 13.5985372 20.9095018 67.1494704 255.223874 10.1494006 19.8085768 69.1680369 243.577288 93 16 26.5 61 355 17.2739789 27.7952991 52.7325162 331.238964 10.2131428 28.6248154 59.9938059 282.512498 94 21.2 32.8 51 340 20.7214589 34.9230492 52.3633918 326.388711 24.4073945 39.7817506 40.6234963 406.165019 95 21.7 32.7 49 355 19.2718427 31.0907365 47.1878875 351.717662 17.4699066 29.5817434 55.1480365 310.146768 96 12.5 19.5 78 193 13.9043604 20.5713347 72.5594378 197.829596 8.68413766 23.6791885 70.7268798 217.078311 97 5.9 11.4 82 175 7.10031287 14.4701922 74.1646209 190.901666 −0.69463766 15.5602268 85.9996364 111.256678 98 3.4 7.9 87 111 3.91588452 10.1284803 84.7820622 121.259789 5.65716978 12.4327741 79.0975646 150.975546 99 −0.7 14.3 89 106 −0.26019086 14.7735121 85.952283 140.513925 3.31396397 11.5423859 81.6120174 182.441584 100 −1.1 15 79 207 0.02797174 16.904271 82.3735655 165.323483 2.1127718 11.3975153 82.7190554 166.245499 101 0 23 70 251 0.67614855 21.7867063 74.9962276 213.311608 5.12359359 21.4552791 69.1653978 242.661696 102 6.3 32.9 58 323 6.78549225 31.7715341 55.3867283 316.928992 10.7575586 27.7164295 59.5829073 287.714195
Table S1
–
(continued)
Tminexp Tmaxexp RH exp SD exp
ANN MLR
Tminpred Tmaxpred RH pred SD pred Tminpred Tmaxpred RH pred SD pred
Training set 103 17 39.3 40 364 15.4281909 37.2649268 45.1280753 366.975387 15.0232819 33.2680767 53.271971 322.925099 104 17 35.8 51 339 17.2475858 37.4207373 49.3230675 337.452464 18.3166094 38.6395514 46.9947702 351.05335 105 10.7 34 75 234 12.2390823 35.5546677 60.3211908 271.16473 12.493252 36.1615653 52.8383298 313.710236 106 7.7 30 66 288 6.72002137 29.7118227 70.2522771 211.035258 9.02300055 29.6077624 63.703089 247.648776 107 2.8 22.8 65 191 1.86948633 23.5915152 71.9185548 201.653135 3.75509329 22.9344488 74.1510557 184.317222 108 0 19.5 76 165 −0.30522501 17.1730876 78.9613013 157.844457 1.12300462 19.3617486 78.2856214 149.568948 109 −2 23 82 117 −0.88463422 18.2277495 79.099419 182.93522 0.11156752 14.1547417 80.1138896 181.752409 110 −1.6 22.8 75 176 −0.16161791 20.4723802 76.7675951 196.224397 0.57421927 13.7384136 80.3473508 182.879144 111 4.3 28.4 73 199 1.56173943 24.5863006 73.5211079 213.49421 2.76123178 18.6225182 74.5070505 208.05559 112 2.7 29.1 65 268 4.84806511 29.7411679 60.9139704 287.835512 6.99415872 24.4784795 65.4477613 247.244665 113 11.1 32.2 56 359 9.88063053 34.359913 55.7311276 312.507359 9.58520146 31.1984724 57.0743895 293.076449 114 16.9 37.2 43 375 15.3116316 36.7832783 46.1352435 363.006892 13.8576363 34.6777503 52.821084 322.449629 115 15 37.2 51 333 13.4029563 36.3542391 54.6976566 305.833144 8.05107456 33.7544183 56.2361231 284.631556 116 10.8 32 61 274 11.3288042 34.8676567 57.8497498 286.842282 13.8843275 33.2441442 55.4030443 298.86876 117 4.3 31 64 217 4.9254704 29.195453 71.327714 203.795605 2.29387747 28.3184403 67.1606844 213.855101 118 3.5 18.8 84 101 1.53712955 22.8998198 75.8602709 176.584066 4.00609097 23.9795977 70.9362237 203.878846 119 −2.2 22.8 70 144 −0.68786502 17.8570513 80.3348926 149.206549 −4.10948828 20.6915919 78.6177682 143.880538 120 −3.6 18.5 78 147 −1.03242289 17.8359098 81.7077467 165.933618 8.39282541 24.115282 64.8540124 274.582926 121 −0.8 13.4 81 163 −0.8434711 18.4642231 77.9654614 188.116974 −2.10579388 18.8209468 75.2202454 197.758767 122 −2.5 18.5 75 218 0.47501185 22.1814303 73.1265253 210.351445 4.33332433 29.7444634 60.4455768 280.809563 123 6.5 26 67 263 2.57498086 26.4753933 66.6470542 249.696673 7.14050245 25.6821387 67.6808493 240.409768 124 8 28.4 69 252 4.77905387 29.6782665 68.2605628 239.115933 9.35395304 27.943119 64.6169838 274.505953 125 8.3 33.6 61 332 9.68422284 34.2262874 56.456514 305.315508 7.94602616 26.7534001 65.552593 249.475169 126 15.4 38.5 53 363 15.3283183 37.3059725 45.9473554 362.611789 12.9823667 33.7477028 55.0647943 312.007204 127 15.5 36.9 49 342 15.9368946 37.5359345 50.4541357 329.552061 12.1494336 39.4555084 51.9708511 318.871707 128 11.6 33.5 61 284 11.5881501 35.1208471 56.97223 289.590994 13.6782866 29.5889946 60.4240835 279.424726 129 8.6 27.3 69 260 7.35202559 26.1727005 66.9755869 228.406642 10.1164027 26.7064718 66.9537037 231.893022 130 4.5 20.7 81 132 3.41869509 18.8924218 84.7208435 122.326357 7.2896414 15.7802486 81.8952119 151.670238 131 1 18.1 84 156 0.18367127 16.6510621 83.2252404 133.403381 3.32073968 17.8027426 80.6067538 157.009136 132 −1.6 14.6 77 222 −1.16843045 17.369403 80.7013875 173.465383 1.97516633 18.0031329 76.5642088 209.478361 133 −0.7 13.1 84 164 −0.81525828 18.5574481 82.9199321 154.234634 1.22181314 13.653398 80.7904769 177.555304 134 −0.3 21 75 200 −0.20539098 20.3856616 76.6265324 197.100489 0.36166746 15.8039705 78.1887643 188.424186 135 0.5 26.1 77 199 2.07440801 25.5908028 75.2602935 176.682092 3.29855039 25.4592941 70.4466472 220.718915 136 14.6 37.7 50 327 13.6334865 36.5551466 49.9781049 338.512905 14.8948418 35.9666136 56.3431147 302.624198 137 14.8 39.5 42 345 15.3927077 37.3323755 42.3474421 382.975914 13.7855941 33.8121863 55.4358262 306.879217 138 14.6 39.7 38 310 14.8621209 37.0506501 49.2249149 338.342555 13.5492642 38.1913106 50.707435 327.013401 139 3 30.5 63 232 6.54915077 31.0582001 69.0665644 217.537845 11.3221202 30.183888 60.9578803 269.233767 140 0.8 23.2 82 134 1.78744242 24.0604065 77.5987297 166.398082 7.27193199 21.6141218 72.7867645 201.197798 141 1.6 21.2 82 159 −0.23311484 19.0878054 79.6966141 163.874003 1.82109446 14.3528491 85.1009106 132.742092 Test set 142 0.8 19.2 73 222 −0.61323884 17.163936 71.3630417 224.977267 0.25826393 17.6130262 74.5943978 198.546325 143 2.3 23.7 62 266 1.10155616 21.4484684 75.2285449 212.996501 4.23870004 22.0692113 68.5410075 231.46811 144 15.4 38 41 346 16.7874737 37.4159247 42.9666575 378.567703 13.1952291 35.9681638 52.5083512 309.67513 145 9 36.2 49 302 11.7209698 34.3184441 56.2058447 311.403076 10.0637264 31.8960142 55.5307802 302.470466 146 6 29.5 60 247 8.39658053 27.9577834 66.3006452 234.024407 12.4474725 29.9005189 57.9083021 287.598492 147 6.3 13.6 74 221 5.63577868 12.2521823 72.8003342 226.697341 4.00026029 15.9135058 74.1345809 204.983339 148 20.9 31 51 337 19.3787151 31.3287071 51.1698787 328.424713 16.6046872 27.8747173 60.5739152 277.884643 149 12.4 19.2 78 207 12.3379295 18.3788692 68.4781949 220.702143 9.91956989 26.2147784 63.9527091 249.85861 150 5.4 12.7 75 228 6.06251545 12.4180468 76.1694186 212.210811 3.70613193 13.6415086 78.3731296 199.666086 151 17 25.9 63 190 16.9134137 25.8294499 70.5162544 209.645999 12.1349747 27.7140355 64.1408989 248.984814 152 2.4 23.4 81 205 1.45716262 24.3743348 75.1786873 197.583567 3.27313275 25.68649 65.7176389 237.30733 153 11.8 35.1 45 367 13.3638938 35.8383468 46.2695892 364.040719 12.5448662 30.131692 59.9517253 285.730908