Oikos 119: 1020–1028, 2010 doi: 10.1111/j.1600-0706.2009.18169.x © 2009 h e Authors. Journal compilation © 2010 Oikos Subject Editor: Wim van der Putten. Accepted 5 October 2009
Carbon and nutrient limitation of soil microorganisms and microbial
grazers in a tropical montane rain forest
Valentyna Krashevska, Mark Maraun, Liliane Ruess and Stefan Scheu
V. Krashevska ([email protected]), M. Maraun, L. Ruess and S. Scheu, J. F. Blumenbach Inst. of Zoology and Anthropology, Animal Ecology, Georg-August-Univ. of Goettingen, Berliner Str. 28, DE–37073 Goettingen, Germany. Present address for LR: Dept of Ecology, Inst. of Biology, Humboldt-Univ. Berlin, Invalidenstraße 42, DE–10115 Berlin, Germany.
We investigated the role of carbon, nitrogen and phosphorus as limiting factors of microorganisms and microbial grazers (testate amoebae) in a montane tropical rain forest in southern Ecuador. Carbon (as glucose), nitrogen (as NH4NO3) and phosphorus (as NaH2PO4) were added separately and in combination bimonthly to experimental plots for 20 months. By adding glucose and nutrients we expected to increase the growth of microorganisms as the major food resource of testate amoebae. h e response of microorganisms to experimental treatments was determined by analysing microbial bio-mass (SIR), fungal biobio-mass and microbial community composition as measured by phospholipid fatty acids (PLFAs). We hypothesized that the response of testate amoebae is closely linked to that of microorganisms. Carbon addition strongly increased ergosterol concentration and, less pronounced, the amount of linoleic acid as fungal biomarker, suggesting that saprotrophic fungi are limited by carbon. Microbial biomass and ergosterol concentrations reached a maximum in the combined treatment with C, N and P indicating that both N and P also were in short supply. In contrast to saprotrophic fungi and microorganisms in total, testate amoebae suff ered from the addition of C and reached maximum density by the addition of N. h e results indicate that saprotrophic fungi in tropical montane rain forests are mainly limited by carbon whereas gram positive and negative bacteria benefi t from increased availability of P. Testate amoebae suff ered from increased dominance of saprotrophic fungi in glucose treatments but benefi ted from increased supply of N. h e results show that tes-tate amoebae of tropical montane rain forests are controlled by bottom–up forces relying on specifi c food resources rather than the amount of bacterial biomass with saprotrophic fungi functioning as major antagonists. Compared to temperate systems microbial food webs in tropical forests therefore may be much more complex than previously assumed with trophic links being rather specifi c and antagonistic interactions overriding trophic interactions.
Tropical montane rain forests are among the most diverse ecosystems of the world (Myers et al. 2000). h is has been documented in rain forests of southern Ecuador for plants (Spermatophyta, Pteridophyta, Bryophyta, Lichens) and a number of animal taxa (Mammalia, Aves, Lepidoptera; Liede-Schumann and Breckle 2007). However, compared to aboveground biota, belowground communities received little attention; only mites (Illig et al. 2007) and testate amoebae (Krashevska et al. 2007) have been investigated in some detail.
Testate amoebae reach high diversity and density in tropi-cal montane ecosystems (Krashevska et al. 2007). h ey are trophically diverse with species consuming organic matter (Schönborn 1982), microorganisms and also other soil ani-mals (Laminger 1978, Yeates and Foissner 1995). Protist activity modifi es microbial activity and thereby alters nutri-ent fl uxes in the soil system (Griffi ths 1994, Coûteaux and Darbyshire 1998). Despite their importance for decompo-sition processes and nutrient mineralization, factors that
regulate their density and diversity are little understood espe-cially in tropical ecosystems. Commonly, the distribution of testate amoebae is explained by abiotic factors, in particular humidity and acidity (Geltzer et al. 1985). However, the availability and quality of resources, i.e. bottom–up forces, likely also control the density and species composition of testate amoebae, but this has not been investigated yet.
the eff ects of carbon and nutrients on density and commu-nity structure of soil mesofauna (Collembola, Gamasida and Oribatida) and microfauna (Nematoda, amoebae and fl agellates) and reported that the response of mesofauna, microfauna and microorganisms diff ered from each other suggesting diff erential limitation of soil biota.
Most lowland tropical forests grow on highly weathered soils that are relatively rich in nitrogen (Martinelli et al. 1999) but have been depleted with time of rock-derived nutrients (Walker and Syers 1976, Wardle et al. 2004). Previous stud-ies (Vitousek 1984) suggest that phosphorus limits plant growth in tropical rain forests more often than nitrogen. However, rather than by a single factor Kaspari et al. (2008) suggest tropical forests to be limited by multiple nutrients. Unfortunately, there virtually is no information on limiting factors of soil microorganisms and other soil biota of tropi-cal montane rain forests. h erefore, it remains unclear if soil microorganisms are limited primarily by carbon as is the case in temperate forest soils (Demoling et al. 2007). Studies on the eff ect of resources on the density, diversity and species composition of testate amoebae in tropical ecosystems are lacking entirely, which probably is due to diffi culties in iden-tifying them to species level. Generally, there is little infor-mation on food resources of testate amoebae.
By adding carbon (as glucose), nitrogen and phosphorus (as minerals) separately and in combination to the soil of a tropical montane rain forest in southern Ecuador we inves-tigated the response of microorganisms and microbial graz-ers to increased supply of resources and investigated which element is the most limiting. We followed the response of testate amoebae to experimental treatments and, for relat-ing changes in their density and community structure to microbial food resources, we investigated microbial biomass, fungal biomass and microbial community composition assessed by phospholipid fatty acids (PLFAs). We expected the response of testate amoebae to be closely linked to that of microorganisms. More specifi cally we expected (1) bacte-ria and fungi, as well as bactebacte-rial and fungal feeding testate amoebae to be primarily limited by carbon, (2) phosphorus to function as second limiting element for microorganisms and testate amoebae, and (3) nitrogen to be generally of little importance.
Methods
Study site
h e tropical montane rain forest studied is located in south-ern Ecuador in the upper valley of the Rio San Francisco between the provincial capitals Loja and Zamora at the border of the Podocarpus National Park within the Reserva Biológica San Francisco“ (3˚58⬘S, 79˚5W). More details on the region and study site are presented in Beck and Müller-Hohenstein (2001) and Beck et al. (2008). h e experi-ment was set up in the upper region of a small catchexperi-ment (Quebrada 1, Q1) at 1922 m a.s.l. h e climate is warm humid with an annual precipitation of about 2000 mm and an average annual temperature of 15.7°C (Moser et al. 2008). Precipitation is particularly high from April to July and less from September to December. h e thickness of
organic layers is about 30 cm. Soil pH ranges between 3.8 and 4.5. h e mean C-to-N ratio of the litter layer averages 28–30 (Wilcke et al. 2002, Leuschner et al. 2007).
Experimental design and sampling
h e experiment was set up in February 2004 and fi nished in October 2005. Experimental plots were established by dig-ging plastic tubes of 35 cm ø and a height of 40 cm ca 10 cm into the organic layers of the soil. Cane sugar (C6H12O6) for carbon (C), ammonium nitrate (NH4NO3) for nitro-gen (N) and sodium dihydronitro-genphosphate (NaH2PO4) for phosphorus (P) were added together with water (0.5 l) to the experimental plots separately and in combination in a complete three factorial design resulting in eight treatments (control, C, N, P, CN, CP, NP, CNP). Each treatment was replicated four times and treatments were arranged in four blocks (randomized complete block design).
h e amount of nutrients added was equivalent to about fi ve times the input of these elements in the litter entering the system per year. h e amount of leaf litter at a similar site in close vicinity is 862 g m–2 year–1 (Röderstein et al. 2005).
Assuming that about 50% of the litter consists of carbon, 1% of nitrogen and 0.1% of phosphorus we added 88.4 g cane sugar, 2.0 g NH4NO3 and 0.272 g NaH2PO4 per plot every second month. Control plots received the same amount of water without nutrients.
After 20 months and 10 fertilizer applications samples (L/F ⫽ litter/fermentation layer material) were taken from each plot to a depth of 5 cm using a corer (ø5 cm). h ree corers were taken per plot and pooled. h e material consisted of decomposing leaves, seeds, fl owers, twigs, fi ne roots and some larger woody material. h e samples were transferred to the laboratory at the nearby research station. Subsamples for the extraction of testate amoebae (ca 100 g) were air dried prior to transport to Germany. Subsamples (ca 100 g) for analysis of microbial biomass, ergosterol content and PLFAs were placed in plastic bags, stored in a refrigerator (5°C) for a maximum of two days and trans-ported in cooling boxes to Germany where they were processed immediately. Short storage of soil in the refrig-erator hardly aff ects microbial biomass and PLFA patterns (Zelles et al. 1991, Bååth et al. 2004).
Microbial basal respiration and microbial biomass
Soil respiration and microbial biomass were determined by measuring O2 consumption using an automated respirom-eter system (Scheu 1992). Microbial basal respiration of fi eld moist samples was measured at 22°C and calculated as mean O2 consumption during hours 10–20 after attachment to the respirometer. Microbial biomass C (Cmic; μg g–1 dry wt)
was assessed by measuring the maximum initial respira-tory response (MIRR, μl O2 g–1 h–1) after glucose addition
at 22°C and calculated as 38 ⫻ MIRR (SIR-method; Anderson and Domsch 1978, Beck et al. 1997). Glucose (80 mg g–1 litter dry wt) was added as an aqueous solution
MIRR. Microbial specifi c respiration (metabolic quotient; qO2) was calculated as μl O2 mg–1C
mic h–1.
Ergosterol content
Ergosterol content was determined according to the method described in Djajakirana et al. (1996). Ergosterol concen-trations were measured by reversed-phase high performance liquid chromatography (HPLC) using the following set up: main column 10 cm, pre-column 0.5 cm (Spherisorb ODS II, 5 μm diameter), mobile phase 100% methanol, fl ow rate 1.0 ml h⫺1 and detection at 282 nm.
PLFAs
Lipid extraction was performed on 2 g of litter according to Frostegård et al. (1993). Lipid fractionation was per-formed with silica acid columns (0.5 g silicic acid, 3 ml). Fatty acid methyl esters (FAMEs) were identifi ed by chro-matographic retention time comparison with a standard mixture composed of 37 diff erent FAMEs that ranged from C11 to C24. h e analysis was performed by gas chroma-tography using an Auto System XL equipped with a HP-5 capillary column (50 m ⫻ 0.2 mm inner ø fi lm thickness 0.33 μm). h e temperature program started with 70°C (hold time 2 min) and increased with 30°C per min to 160°C, and then with 3°C per min to 280°C and held for 15 min. h e injection temperature was 260°C and helium was used as carrier gas.
h e sum of all identifi ed PLFAs was taken to represent the total amount of PLFAs. Individual PLFAs were calcu-lated as percentage of total PLFAs (relative nmol g⫺1 dry
litter material). h e ω notation was used to classify fatty acids, where unsaturated acids are ascribed according to the number of carbon atoms from the terminal methyl group (ω end) to the nearest double bond, i.e. ω9, ω6, ω3 (IUPAC-IUB 1978). h e fatty acids i15:0, a15:0, 15:0, i16:0, 16:1ω7, 17:0, i17:0, cy17:0, 18:1ω7 and cy19:0 were assumed to represent bacteria (Zelles 1999); 16:1ω5c was used as an indicator for arbuscular mycorrhizal fungi (AMF) (Olsson et al. 1995). In addition to ergosterol, the concentration of the fungal specifi c fatty acid 18:2ω6,9 was used as a fungal marker (Frostegård and Bååth 1996). h e sum of 16:1ω7, cy17:0 and cy19:0 was used as marker for gram negative bacteria and the sum of i15:0, a15:0, i16:0 and i17:0 as marker for gram positive bacteria (Zelles et al. 1995, Zelles 1997). h e sum of 20:2 and 20:4ω6 was taken as animal marker (Salomonová et al. 2003, Chamberlain et al. 2005), and 20:5ω3 as marker for algae (Dunstan et al. 1994, Boschker et al. 2005). h e ratio of fungal-to-bacterial PLFAs was calculated to estimate the relative abundance of these two microbial groups.
Extraction and analysis of testate amoebae
h e samples were rewetted for 24 h with sterile tap water (250 ml per 5 g litter) to detach the tests from the air-dry litter. h e next day the samples were fi ltered through a 500 μm sieve to separate coarse organic particles. Testate amoe-bae were subsequently collected from the fi ltrate on a 250 μm mesh, and small forms were recovered by a fi nal fi lter
step using a 25 μm sieve. Microscopic slides were prepared and tests were identifi ed and counted at 200⫻ and 400⫻ magnifi cation with an upright Leitz Ortholux II and a Nikon Inverted Microscope. Additionally, we used an envi-ronmental scanning electron microscope to verify species identifi cation. h e details of the identifi cation and taxo-nomic references are presented in Krashevska et al. (2007). h e number of tests was expressed per gram of air dry litter material. h e classifi cation of species is based on morpho-logical characters (morphospecies). No comprehensive phyl-ogeny of testate amoebae is currently available and therefore we adopted a species level approach in this study. Full names of species are listed in alphabetical order in Supplementary material Appendix 1.
Statistical analysis
Data on microbial basal respiration, microbial biomass, total PLFA and ergosterol concentrations were analyzed by three-factor randomized complete block analysis of variance (ANOVA) with the fi xed factors carbon (with and without), nitrogen (with and without) and phosphorus (with and without) using SAS 9.13 (SAS Inst.). Prior to the analyses the data were inspected for homogeneity of variances (Lev-ene test). Ergosterol data were log-transformed to improve homoscedasticity. Data on density of testate amoebae were log(x⫹1) transformed.
PLFA patterns (contribution of individual PLFAs to total PLFAs expressed as percentages of total) were analysed by discriminant function analysis (DFA) using eight treatments (control, C, N, P, CN, CP, NP, CNP) as independent vari-ables. PLFA data were arcsin square-root transformed prior to the analysis. Squared Mahalanobis distances between group centroids (treatments) and the reliability of sample classifi ca-tion were determined. Two signifi cant canonical roots were derived and graphically presented in two-dimensional space. DFA was carried out with STATISTICA 7.0 for Windows (StatSoft, Tulsa, USA).
To evaluate which of the testate amoebae species reacted to carbon and nutrient additions the multivariate dataset consisting of 104 species of testate amoebae was reduced to four dimensions using non-metric multidimensional scaling (NMDS) in STATISTICA. Stress values in NMDS indi-cated that four dimensions represented most of the variation in the data. h e four dimensions were analysed by discrimi-nant function analysis (DFA) to identify treatment eff ects. Subsequently, DFA with all 104 testate amoebae species was carried out to evaluate which of them contributed to the treatment eff ects. As indicated by Pearson correlation 46 taxa were signifi cantly aff ected by carbon and/or nutrient addi-tions. To evaluate which of the factors aff ected testate amoeba species MANOVA with these species was carried out, and for the main factors that were signifi cant in the MANOVA (see results section) protected ANOVAs were carried out to investigate the eff ects of treatments on the respective species (Scheiner and Gurevich 2001). In total, 24 species signifi -cantly responded to at least one of the treatment factors or their interactions.
between C, N and P), however, P only or together with C or N did not aff ect microbial biomass.
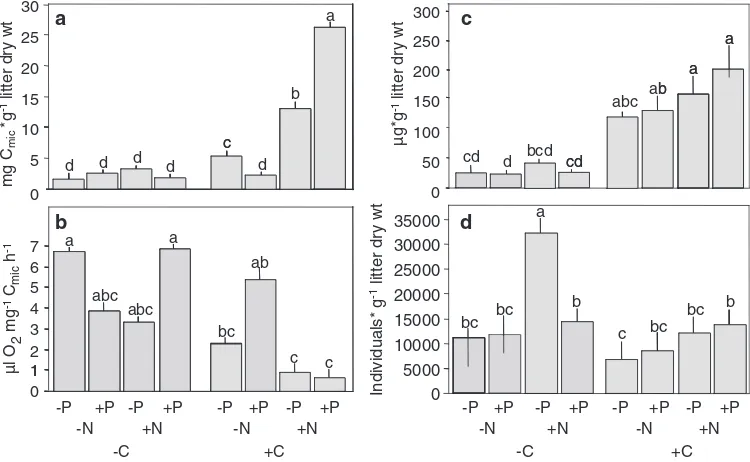
Generally, both the addition of C (–55%) and N (–36%) signifi cantly and strongly reduced the respiratory quotient (qO2; F1,24 ⫽ 19.1, p ⬍ 0.001 and F1,24 ⫽ 6.2, p ⫽ 0.02, respectively; Fig. 1b), however, the eff ect depended on each other (F1,24⫽ 4.6, p ⫽ 0.04 for the interaction between C and N). h e respiratory quotient was modifi ed by the addi-tion of P (F1,24⫽ 13.9, p ⫽ 0.001 for the interaction between C, N and P); it was most strongly reduced in the CNP treat-ment (–90%) but remained unaff ected by the addition of P and CP.
As indicated by ergosterol concentrations, fungal bio-mass was at a minimum in the treatment with P only and at a maximum in the CNP treatment (Fig. 1c). Generally, it increased by a factor of 5.2 after addition of C (F1,24⫽ 122.0, p ⬍ 0.001) and increased after addition of N (⫹40%; F1,24
⫽ 7.0, p ⫽ 0.014).
PLFAs
In total, 24 PLFAs with a chain length up to C24 were detected. h e average amount of PLFAs was at a minimum in treatments with P (158 ⫾ 44.1 nmol g–1 litter dry wt)
and at maximum in the treatments with CNP (1091 ⫾ 230 nmol g–1 litter dry wt) with an overall average of 465 ⫾ 125
nmol g–1 litter dry wt. Discriminant function analysis (DFA)
of all PLFAs (Wilks’ λ ⬍ 0.001, F140,43 ⫽ 2.9, p ⬍ 0.001) separated the treatments with C from those without along Root1, and treatments with N from those without along Root2 (Fig. 2, Table 1). Both the eff ect of C (Wilks’ λ⫽ 0.1588, F6,19⫽ 16.2, p ⬍0.001) and N (Wilks’ λ⫽ 0.3653, F6,19 ⫽ 5.5, p ⫽ 0.002) were signifi cant but depended on as dummy variables) to environmental conditions, to relate
abundance patterns of testate amoebae species to environ-mental factors and to test for trends in ecological preferences of particular species. Only species occurring in at least three independent samples were included in CCA. Environmen-tal variables included Cmic, ergosterol concentration, fungal PLFA marker, AMF marker, gram negative bacteria marker, gram positive bacteria marker, animal marker and algae marker. Treatments (control, C, N, P, CN CP, NP, CNP) were included as passive variables. Monte-Carlo tests (999 permutations) were performed to evaluate the signifi cance of individual axes (Ter Braak 1996).
Results
Response of microorganisms
Microbial basal respiration (BR) was at a minimum in treat-ments with P (23.3 ⫾ 7.1 µl O2 g–1 litter dry wt) and at
maximum in the treatments with CNP (41.0 ⫾ 15.2 µl O2 g–1 litter dry wt), with an average of 27.8 ⫾ 6.9 µl O
2
g–1 litter dry wt. h e addition of C signifi cantly increased
BR (⫹31%; F1,24 ⫽ 6.0, p ⫽ 0.022). Microbial biomass (Cmic) was on average 7.0 ⫾ 0.6 mg g–1 litter dry wt,
but strongly depended on nutrient addition (Fig. 1a). h e addition of C increased Cmic more than fi ve fold (5.16; F1,24 ⫽ 495.7, p ⬍ 0.001). Further, Cmic increased by the
addition of N, however, by a factor of 3.6 only (F1,24⫽ 208.2, p ⬍ 0.001). Addition of N and C increased Cmic further
(F1,24 ⫽ 151.3, p ⬍ 0.001 for the interaction of N and C). Also, the addition of P modifi ed the response to C and N addition (F1,24 ⫽ 114.9, p ⬍ 0.001 for the interaction
treatments with C (6920 ⫾ 1480 ind. g⫺1; Fig. 1d). Generally,
there was an overall negative eff ect of the addition of C (F1,24 ⫽ 57.5, p ⬍ 0.0001) with the density being reduced by 38% (Fig. 1d). In contrast, the addition of N generally increased the density of testate amoebae on average by 90% (F1,24 ⫽ 92.6, p ⬍ 0.0001). However, the benefi cial eff ects of N only occurred in treatments without C and/or P addition (F1,24 ⫽ 30.3, p ⬍ 0.0001 for the interaction between C, N and P).
A total of 104 species/subspecies were identifi ed (Supple-mentary material Appendix 1), of these 21 have not been found in Ecuador before. Species number was at a maximum in the CNP treatment (26.0 ⫾ 12.6) and at a minimum in the CP treatment (19.0 ⫾ 2.6). Generally, the addition of C negatively aff ected the diversity of testate amoebae reducing the number of species on average by 21% (F1,24⫽ 4.2, p ⫽ 0.048).
MANOVA suggests that the community structure of testate amoebae signifi cantly responded to the addition of C (Wilks’ λ ⫽ 0.395, F4,21 ⫽ 8.0, p ⬍ 0.001), N (Wilks’ λ ⫽ 0.564, F4,21 ⫽ 4.0, p ⫽ 0.01) and P (Wilks’ λ ⫽ 0.499, F4,21 ⫽ 5.2, p ⫽ 0.004), however, the eff ects depended on each other (Wilks’ λ ⫽ 0.233, F4,21 ⫽ 17.19, p ⬍ 0.001 for the interaction between C, N and P). Indi-vidual ANOVAs indicated that the density of 15 species was signifi cantly aff ected by the three factor interaction between C, N and P, fi ve species by the two-factor interac-tion between N and P, two species by N addiinterac-tion only and one by C addition only (Fig. 3).
Relationships between microorganisms and testate amoebae
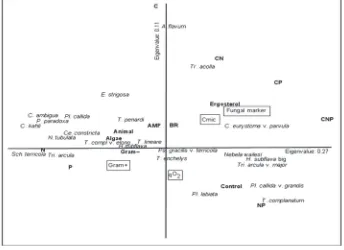
In the forward selection procedure of the CCA, four of the ten quantitative variables were signifi cant when tested as fi rst variable in the model (p ⬍ 0.05; Fig. 3). Together the variables explained 61% of the variation in species data. h e trace was signifi cant (F ⫽ 1.9, p ⫽ 0.001). Axes 1 and 2 explained 27% and 11% of the total variation of the data, respectively.
Including the explanatory variables one after the other using forward selection, fungal markers accounted for most of the variation of the data (15% of total; F ⫽ 3.9, p ⫽ 0.002). h e second environmental variable with sig-nifi cant explanatory power was qO2 (additional 9% of total; F ⫽ 2.40, p ⫽ 0.02), the third was Cmic (additional 8% of
total; F ⫽ 2.4, p ⫽ 0.005) and the fourth was gram positive bacteria (additional 5 % of total; F ⫽ 1.8, p ⫽ 0.04).
CCA ordination separated treatments with from those without C. CCA indicated close intercorrelation of micro-bial parameters (ergosterol, fungi marker, Cmic and BR), virtually all were associated with C treatments. In contrast, gram negative and positive bacteria and qO2, animal and algae marker were negatively correlated with C treatments. Generally, few species grouped with C treatments(Archerella fl avum, Tracheleuglypha acolla, Cyclopyxis eurystoma v. par-vula); most species either clustered with the N and P only treatments (e.g. Schwabia terricola, Nebela tubulata, Trigo-nopyxis arcula) and only one with NP treatment (Trinema complanatum). Plagiopyxis labiata and Pl. callida v. grandis clustered with the control, being negatively aff ected by the addition of any nutrient.
each other (Wilks’ λ ⫽ 0.4352, F6,19 ⫽ 4.1, p ⫽ 0.008 for the interaction between C and N). Separate ANOVAs of individual or grouped fatty acids (Methods) indicated that these diff erences were mainly due to gram positive bacteria, which were signifi cantly decreased by C (–19%; F1,24⫽ 20.7, p ⫽ 0.0001), and fungi, which were signifi cantly increased by C (⫹20%; F1,24 ⫽ 9.3, p ⫽ 0.006).
Further, separate ANOVAs indicated that the addition of N signifi cantly decreased the biomass of AMF (–12%; F1,24 ⫽ 5.4, p ⫽ 0.03). Addition of N and C decreased the concentration of gram negative bacteria in each of the treat-ments (F1,24 ⫽ 6.9, p ⫽ 0.01 for the interaction between N and C) and decreased the concentration of the animal marker fatty acid (F1,24 ⫽ 7.5, p ⫽ 0.01). Gram positive and negative bacteria reached a maximum in treatments with P only (53.3 ⫾ 3.8 and 27.2 ⫾ 3.1 nmol g⫺1,
respec-tively), and a minimum in C (35.9 ⫾ 4.8 and 22.1 ⫾ 2.1 nmol g⫺1, respectively) and CP treatments (36.9 ⫾ 6.5
and 21.9 ⫾ 3.1 nmol g⫺1, respectively). As a consequence
of increased fungal biomass and decreased biomass of gram negative and positive bacteria the fungal-to-bacterial PLFA ratio signifi cantly increased by addition of C (⫹80%;
F1,24 ⫽ 14.4, p ⬍ 0.001).
Density and diversity of testate amoebae
Density of testate amoebae was at a maximum in treatments with N (32 345 ⫾ 887 ind. g⫺1) and at a minimum in the
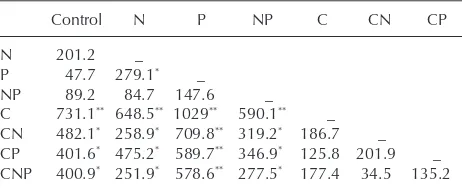
Table 1. Squared Mahalanobis distances between group centroids and reliability of discrimination based on data of PLFA dominance structure of eight treatments (control, C, N, P, CN CP, NP, CNP). *p < 0.05, **p < 0.005
Control N P NP C CN CP
N 201.2 _
P 47.7 279.1* _
NP 89.2 84.7 147.6 _
C 731.1** 648.5** 1029** 590.1** _
CN 482.1* 258.9* 709.8** 319.2* 186.7 _
CP 401.6* 475.2* 589.7** 346.9* 125.8 201.9 _
CNP 400.9* 251.9* 578.6** 277.5* 177.4 34.5 135.2
Carbon limitation of microorganisms was expected as soil microorganisms are generally assumed to be primarily limited by carbon (Brooks et al. 2004, Demoling et al. 2007, Buckeridge and Grogan 2008). However, additional sup-ply of N in the CN but in particular in the CNP treatment further increased microbial biomass suggesting that in the studied tropical montane rain forest microbial biomass is not only limited by C but also by N. Vance and Chapin (2001) also found microorganisms to respond most to the combined addition of C and N and Joergensen and Scheu (1999) found microbial biomass in litter to be at a maximum after addition of C, N and P. Further, in soils from southern Sweden separate addition of C, N and P had little eff ect but adding them together increased microbial biomass considerably (Demoling et al. 2007), indicating that each of these elements limited microbial growth. Supporting our conclusion on the combined limitation by C and N in the studied tropical montane rain forest, low metabolic quo-tients in treatments with C and N indicate that microorgan-isms effi ciently used the additional carbon for growth and spend less energy for respiration.
Fungal biomass measured as ergosterol content mainly increased in treatments with C and less in those with N addi-tion. Ergosterol is the dominating sterol in cell membranes of ascomycetes and basidomycetes. Arbuscular mycorrhizal fungi (AMF) usually contain other sterols (Olsson et al. 2003); although minor amounts of ergosterol may be pres-ent in some AMF species (Frey et al. 1994). In the studied forest the community of mycorrhizal fungi virtually exclu-sively consists of AMF (Kottke et al. 2004) as is typical for tropical forest ecosystems (Smith and Read 1997). Ectomy-corrhiza therefore contribute little to the observed changes
Discussion
h e main hypothesis of this study was that testate amoe-bae in soils of tropical montane rain forests are bottom–up regulated. To test this hypothesis, we added carbon and nutrients (N, P) to the soil and investigated the response of microorganisms and testate amoebae to the additional resource supply. We assumed that microorganisms will ben-efi t from the additional resources and that this will propa-gate into the next trophic level, i.e. protists represented by testate amoebae, since microorganisms are the major food resources for testate amoebae.
Response of microorganisms
In agreement with our expectation, microbial biomass in fact increased in plots supplemented with glucose and nutrients, especially in treatments with carbon and nitrogen (CN) and carbon, nitrogen and phosphorous (CNP). Our results are similar to those of Scheu and Schaefer (1998) from a tem-perate beechwood on limestone in Germany where microbial biomass in litter was at a maximum after addition of carbon, nitrogen and phosphorous. However, microbial biomass in our CP treatment was low, and the high metabolic quotient suggests that microorganisms in this treatment suff ered from stress (Blagodatskaya and Anderson 1999). Potentially, myc-orrhizal and saprotrophic microorganisms competed for P with the intensity of competitive interactions being increased by the addition of glucose resulting in increased respiratory activity. h e assumption that mycorrhizal and saprotrophic fungi interacted antagonistically is further supported by ergosterol and PLFA data.
tropical montane rain forest diff er markedly from those in temperate forests. A marked diff erence between the studied tropical forest and the temperate forest studied by Scheu and Schaefer (1998) and Maraun et al. (2001) is soil pH. Low soil pH at the studied tropical rain forest likely favoured the dominance of fungi over bacteria (Bååth and Anderson 2003, Krashevska et al. 2008). As discussed above, increased microbial biomass by the addition of C likely was due to increased fungal biomass, with bacteria even suff ering from additional C due to suppression by saprotrophic fungi. Since testate amoebae predominantly feed on bacteria detrimental eff ects of the addition of C likely resulted from increased dominance of fungi, with fungi being low quality or unavail-able prey; predator–prey relationships may even be reversed with fungi preying on testate amoebae (Pussard et al. 1994). According to Pussard et al. (1994) gram negative bacteria are more palatable to protozoa than gram positive bacte-ria, mycobacteria and actinomycetes. Our data support this assumption as the density of testate amoebae correlated with PLFA markers of gram negative bacteria.
In contrast to our hypothesis that N is generally of little importance, the addition of N strongly increased the density of testate amoebae, and the concentration of animal (includ-ing testate amoebae) and algae PLFA markers. h e correla-tion between algae and animal markers in CCA likely refl ects trophic links, e.g. testate amoebae feeding on algae.
Some species were only found in the control, some only in N or C treatments suggesting diff erential response to changes in the amount and quality of food resources at the species level. Species specifi c responses are also indicated by close correlations of species with certain PLFA markers; e.g. Trinema lineare, T. complanatum v. elongata closely correlated with PLFA markers of gram negative bacteria suggesting that they predominantly feed on these bacteria which is consis-tent with previous fi ndings (Coûteaux and Pussard 1983). Association of C. eurystoma v. parvula with fungal markers suggests that this species may feed on fungi. Negative cor-relation of most other testate amoebae with fungal mark-ers indicates, however, that most testate amoebae species are detrimentally aff ected by increasing fungal abundance. Fur-ther, close association between certain testate amoebae spe-cies point to predator–prey relationships, e.g. Hyalosphenia subfl ava and T. enchelys are likely to prey on T. lineare and Pseudodiffl ugia gracilis v. terricola which is consistent with earlier suggestions (Schönborn 1965, Laminger 1978).
h e increase in density of testate amoebae in the N addition treatment was mainly due to humus and detritus feeders, such as Centropyxis constricta, Cyclopyxis kahli, Cy. ambigua C. eurystoma v. parvula, Sch. terricola, Tri. arcula (Laminger 1980), and some predators, such as species of the genus Nebela (Schönborn 1965). Increased density of humus and detritus feeding testate amoebae in N addition treatments potentially was due to increased availability of detritus rich in N.
In conclusion, the results suggest that saprotrophic fungi in tropical montane rain forests are strongly limited by C whereas gram positive and gram negative bacteria mainly by P. In contrast to our expectations, the response of testate amoebae strikingly diff ered from that of these major groups of (mainly) saprotrophic microorganisms. Rather than benefi ting from increased availability of C and P, testate in ergosterol concentrations, rather they refl ect the biomass
of saprotrophic fungi. h erefore, the results suggest that the saprotrophic asco- and basidiomycetes benefi ted from addi-tional C and N resources. On the contrary, as indicated by the amount of the fatty acid marker 16:1ω5c, AMF were detrimentally aff ected by the addition of N suggesting that saprotrophic asco- and basidiomycetes antagonistically aff ected AMF. Reduction of AMF by the addition of N may be explained by reduced importance of AMF in providing nitrogen to plants (Johnson and Gehring 2007).
h e fungal fatty acid marker 18:2ω6,9 correlated with the ergosterol content, confi rming marker specifi city. Cor-relation of these biomarkers with microbial biomass indi-cates that the majority of microorganisms in the upper soil layer in this forest consist of saprotrophic fungi. In addi-tion, the fungal-to-bacterial PLFA ratio generally increased by the addition of C, suggesting that fungi disproportion-ately benefi ted from increased availability of C. Only in the CNP treatment the fungal-to-bacterial PLFA ratio was low suggesting that if carbon and the major macro-nutrients are present in abundance bacteria disproportionately ben-efi t from increased resource supply. Presumably, decreas-ing N and P limitation combined with enhanced C supply increases the competitive strength of bacteria lacking the ability to translocate nutrients.
As indicated by PLFA analysis gram positive and gram negative bacteria were detrimentally aff ected by the addition of C, whereas they benefi ted from the addition of P. h is indi-cates that bacteria were limited by P. Despite the availability of N has been found to stimulate bacteria if degradable C is available (Schröter et al. 2003), the combined addition of C and N reduced the content of gram negative bacteria. As discussed above, in this treatment saprotrophic fungi domi-nated and similar to AMF this also antagonistically aff ected bacteria competiting for carbon and nutrients.
In general, the response of microorganisms to C and N application was more complex than we expected and sug-gests internal feedbacks among diff erent groups of microor-ganisms. Saprotrophic microorganisms appear to be limited primarily by C with the response to additional nutrients diff ering markedly between saprotrophic fungi and bacte-ria. Fungi predominantly responded to N whereas bacteria responded to P. Diff erential limitation of fungi and bacte-ria by N and P presumably was responsible for maximum microbial biomass in the combination of C, N and P.
Response of testate amoebae
Buckeridge, K. M. and Grogan, P. 2008. Deepened snow alters soil microbial nutrient limitation in arctic birch hummock tundra. – Appl. Soil. Ecol. 39: 210–222.
Chamberlain, P. M. et al. 2005. Fatty acid composition and change in Collembola fed diff ering diets: identifi cation of trophic biomarkers. – Soil Biol. Biochem. 37: 1608–1624.
Coûteaux, M.-M. and Pussard M. 1983. Nature du régime alimentaire des protozoaires du sol. – In: leBrun, P. et al. (eds), New trends in soil biology. Proc. VIII. Int. Colloq. of Soil Biology. Dieu-Brichart, Ottignies-la-Neuve Louvain-la-Neuve, pp. 179–195.
Coûteaux, M.-M. and Darbyshire J. F. 1998. Functional diversity amongst soil protozoa. – Appl. Soil. Ecol. 10: 229–237. Demoling, F. et al. 2007. Comparison of factors limiting bacterial
growth in diff erent soils. – Soil Biol. Biochem. 39: 2485–2495. Djajakirana, G. et al. 1996. Ergosterol and microbial biomass
relationship in soil. – Biol. Fertil. Soils 22: 299–304.
Dunstan, G. A. et al. 1994. Essential polyunsaturated fatty-acids from 14 species of diatom (Bacillariophyceae). – Phytochemistry 35: 155–161.
Frey, B. et al. 1994. Chitin and ergosterol content of extraradical and intraradical mycelium of the vesicular-arbuscular mycor-rhizal fungus Glomus intraradices. – Soil Biol. Biochem. 26: 711–717.
Frostegård, A. and Bååth E. 1996. h e use of phospholipid fatty acid analysis to estimate bacterial and fungal biomass in soil. – Biol. Fertil. Soils 22: 59–65.
Frostegård, Å. et al. 1993. Shifts in the structure of soil microbial communities in limed forests as revealed by phospholipid fatty acid analysis. – Soil Biol. Biochem. 25: 723–730.
Gallardo, A. and Schlesinger W. H. 1994. Factors limiting micro-bial biomass in the mineral soil and forest fl oor of a warm-temperate forest. – Soil Biol. Biochem. 26: 1409–1415. Geltzer, J. G. et al. 1985. Pochvennye rakovinnye ameby i metody
ikh izuchenia. – Izdatelstvo moskovskogo universiteta, Moscow, Russia, in Russian.
Griffi ths, B. S. 1994. Soil nutrient fl ow. – In: Darbyshire, J. F (ed.), Soil protozoa. CAB Int., pp. 65–91.
Hunt, H. W. et al. 1987. h e detrital food web in a shortgrass prairie. – Biol. Fertil. Soils 3: 57–68.
Illig, J. et al. 2007. Oribatida (mites) – Checklist Reserva Biologica San Francisco (Prov. Zamora-Chinchipe, S. Ecuador). – Ecotrop. Monogr. 4: 221–230.
IUPAC-IUB Commission on biochemical nomenclature. 1978. h e nomenclature of lipids. – Biochem. J. 171: 21–35. Joergensen, R. G. and Scheu, S. 1999. Response of soil
microor-ganisms to the addition of carbon, nitrogen and phosphorus in a forest Rendzina. – Soil Biol. Biochem. 31: 859–866. Johnson, N. C. and Gehring, C. A. 2007. Mycorrhizas: symbiotic
mediators of rhizosphere and ecosystem processes. – In: Cardon, G. and Whitbeck, J. L. (eds), h e rhizosphere: an ecological perspective. Elsevier, pp. 73–100.
Kaspari, M. et al. 2008. Multiple nutrients limit litterfall and decomposition in a tropical forest. – Ecol. Lett. 11: 35–43. Kottke, I. et al. 2004. Arbuscular endomycorrhizas are dominant
in the organic soil of a neotropical montane cloud forest. – J. Trop. Ecol 20: 125–129.
Krashevska, V. et al. 2007. Testate amoebae (protista) of an elevational gradient in the tropical mountain rain forest of Ecuador. – Pedobiologia 51: 319–331.
Krashevska, V. et al. 2008. Microorganisms as driving factors for the community structure of testate amoebae along an altitudinal transect in tropical mountain rain forests. – Soil Biol. Biochem. 40: 2427–2433.
Laminger, H. 1978. h e eff ects of soil moisture fl uctuations on the testacean species Trinema enchelys (Ehrenberg) Leidy in a high mountain brown-earths-podsol and its feeding behaviour. – Arch. Protistenkd. 120: 46–454.
amoebae in general benefi ted from increased availability of N and suff ered from increased C supply. Benefi cial eff ects of N presumably were due to increased availability of humus and detritus rich in N. Further, certain species profi ted by increased density of gram positive and gram negative bacteria in P and NP treatments. Suff ering of testate amoebae from increased supply of C, which strongly increased fungal bio-mass, suggests antagonistic eff ects of fungi on testate amoe-bae. Our results suggest that soil food webs of tropical forests diff er markedly from those of temperate forests. Since e.g. protist–microbial interactions of temperate forests appear to be less complex and controlled mainly by resource sup-ply, and interactions between microbial groups in resource exploitation appear to be less severe. Overall, the results sug-gest that testate amoebae of tropical montane rain forests are controlled by bottom–up forces with their density depend-ing on the availability of high quality detritus resources and certain bacterial groups. However, the availability of these resources depends on antagonistic interactions among microbial groups with saprotrophic fungi controlling the resource supply for the microbial food web. h is suggests that trophic interactions in microbial food webs of tropi-cal forests are more complex than previously assumed and modulated markedly by antagonistic interactions.
Acknowledgements – Financial support was provided by the German Research Foundation (DFG; FOR 402 and 816). We thank Jens Illig (Darmstadt) and Dorothee Sandmann (Göttingen) for help with the fi eld work and Sven Marhan (Hohenheim) for help with ergosterol measurement.
References
Anderson, J. P. E. and Domsch, K. H. 1978. A physiological method for the quantitative measurement of microbial biomass in soils. – Soil Biol. Biochem. 10: 215–221.
Bååth, E. and Anderson, T.-H. 2003. Comparison of soil fungal/ bacterial ratios in a pH gradient using physiological and PLFA-based techniques. – Soil Biol. Biochem. 35: 955–963.
Bååth, E. et al. 2004. Can the extent of degradation of soil fungal mycelium during soil incubation be used to estimate ectomycorrhizal biomass in soil? – Soil Biol. Biochem. 36: 2105–2109.
Beck, E. and Muller-Hohenstein, K. 2001. Analysis of undisturbed and disturbed tropical mountain forest ecosystems in southern Ecuador. – Die Erde 132: 1–8.
Beck, E. et al. 2008. Gradients in a tropical mountain ecosystem of Ecuador. – Ecol. Stud. 198, Springer.
Beck, T. et al. 1997. An intlaboratory comparison of ten diff er-ent ways of measuring soil microbial biomass C. – Soil Biol. Biochem. 29: 1023–1032.
Blagodatskaya, E. V. and Anderson, T.-H. 1999. Adaptive responses of soil microbial communities under experimental acid stress in controlled laboratory studies. – Appl. Soil. Ecol. 11: 207–216.
Boschker, H. T. S. et al. 2005. Biomarker and carbon isotopic constraints on bacterial and algal community structure and functioning in a turbid tidal estuary. – Limnol. Oceanogr. 50: 70–80.
Scheu, S. and Schaefer, M. 1998. Bottom–up control of the soil macrofauna community in a beechwood on limestone: manipulation of food resources. – Ecology 79: 1573–1585. Schönborn, W. 1965. Untersuchungen uber die Ernährung
boden-bewohnender Testaceen. – Pedobiologia 5: 205–210.
Schönborn, W. 1982. Estimation of annual production of Testacea (Protozoa) in mull and moder (II). – Pedobiologia 23: 383–393. Schröter, D. et al. 2003. C and N mineralisation in the
decom-poser food webs of a European forest transect. – Oikos 102: 294–308.
Smith, S. E. and Read, D. J. 1997. Mycorrhizal symbiosis (2nd ed.). – Academic Press.
Ter Braak, C. J. F. 1988. CANOCO- a FORTRAN program for canonical community ordination by (partial) (detrended) (canon-ical) correspondence analysis, principle component analysis and redundancy analysis. – TNO Inst., Wageningen Tech. Rep. Ter Braak, C. J. F. 1996. Unimodal models to relate species to
environment. – DLO-Agric. Math. Group, Wageningen. Vance, E. D. and Chapin, III. 2001. Substrate limitations to
micro-bial activity in taiga forest fl oors. – Soil Biol. Biochem. 33: 173–188.
Vitousek, P. M. 1984. Litterfall, nutrient cycling, and nutrient limitation in tropical forests. – Ecology 65: 285–298.
Walker, T. W. and Syers, J. K. 1976. h e fate of phosphorus during pedogenesis. – Geoderma 15: 1–19.
Wardle, D. A. et al. 2004. Ecosystem properties and forest decline in contrasting long-term chronosequences. – Science 305: 509–513.
Wilcke, W. et al. 2002. Nutrient storage and turnover in organic layers under tropical montane rain forest in Ecuador. – Eur. J. Soil Sci. 53: 15–27.
Yeates, G. W. and Foissner, W. 1995. Testate amoebae as predators of nematodes. – Biol. Fertil. Soils 20: 1–7.
Zelles L. 1997. Phospholipid fatty acid profi les in selected members of soil microbial communities. – Chemosphere 35: 275–294. Zelles L. 1999. Fatty acid patterns of phospholipids and
lipopoly-saccharides in the characterisation of microbial communities in soil: a review. – Biol. Fertil. Soils 29: 111–129.
Zelles, L. et al. 1991. Microbial activity measured in soils stored under diff erent temperature and humidity conditions. – Soil Biol. Biochem. 23: 955–962.
Zelles, L. et al. 1995. Determination of phospholipid- and lipopol-ysaccharide derived fatty acids as an estimate of microbial bio-mass and community structures in soils. – Biol. Fertil. Soils 19: 115–123.
Laminger, H. 1980. Bodenprotozoologie. – Mikrobios 1: 1–142. Liede-Schumann, S. and Breckle, S.-W. 2007. Provisional
checklists of fl ora and fauna of the San Francisco valley and its surroundings. (Reserva biológica San Francisco/ Prov. Zamora-Chinchipe, southern Ecuador). – Ecotrop. Monogr. 4.
Leuschner, C. et al. 2007. Large altitudinal increase in tree root/ shoot ratio in tropical mountain forests of Ecuador. – Basic Appl. Ecol. 8: 219 –230.
Maraun, M. et al. 2001. Indirect eff ects of carbon and nutrient amendments on the soil meso- and microfauna of a beech-wood. – Biol. Fertil. Soils 34: 222–229.
Martinelli, L. A. et al. 1999. Nitrogen stable isotopic compo-sition of leaves and soil: tropical versus temperate forests. – Biogeochemistry 46: 45–65.
Moser, G. et al. 2008. Altitudinal change in stand structure and biomass allocation of tropical mountain forests in relation to microclimate and soil chemistry. – In: Beck, E. et al. (eds), Gra-dients in a tropical mountain ecosystem of Ecuador. Ecol. Stud. 198. Springer, pp. 229–243.
Myers, M. et al. 2000. Biodiversity hotspots for conservation priorities. – Nature 403: 853–858.
Olsson, P. A. et al. 1995. h e use of phospholipid and neutral lipid fatty acids to estimate biomass of arbuscular mycorrhizal fungi in soil. – Mycol. Res. 99: 623–629.
Olsson, P. A. et al. 2003. Ergosterol and fatty acids for biomass estimation of mycorrhizal fungi. – New Phytol. 159: 1–10. Pussard, M. et al. 1994. Protozoan interactions with the soil
micro-fl ora and possibilities for biocontrol of plant pathogenes. – In: Darbyshire, J. F. (ed.), Soil protozoa. CAB Int., pp. 123–146. Röderstein, M. et al. 2005. Above- and below-ground litter
pro-duction in three tropical montane forests in southern Ecuador. – J. Trop. Ecol. 21: 483–492.
Salomonová, S. et al. 2003. Determination of phospholipid fatty acids in sediments. – Acta Univ. Palack. Olomuc. Fac. Rerum Natur. 42: 39–49.
Scheiner, S. M. and Gurevich, J. 2001. Design und analysis of ecological experiments (2nd ed.). – Oxford Univ. Press. Scheu, S. 1987. Microbial activity and nutrient dynamics in
earthworm casts (Lumbricidae). – Biol. Fertil. Soils 5: 230–234.
Scheu, S. 1992. Automated measurement of the respira-tory response of soil microcompartments: active microbial biomass in earthworm faeces. – Soil Biol. Biochem. 24: 1113–1118.