THE RATE OF 45
Ca UPTAKE BY TWO CORALS SPECIES AT WATERS OF PULAU BURUNG, BANGKA-BELITUNG PROVINCE
Zulkifli Dahlan1), Gusti Diansyah2), T. Zia Ulqodry2), and Ania Citraresmini3) 1)Department of Biology, Faculty of Natural Science, Sriwijaya University
E-mail : [email protected]
2)Department of Marine Science, Faculty of Natural Science, Sriwijaya University 3)Centre for Application of Radiation and Isotope Technology,
National Atomic Energy Agency (BATAN) Diterima 27 Oktober 2010; disetujui 04 Februari 2011
ABSTRACT
THE RATE OF 45Ca UPTAKE BY TWO CORALS SPECIES AT WATERS OF PULAU BURUNG, BANGKA-BELITUNG PROVINCE. Coral reefs transplantation is the most technique used for coral reefs rehabilitation, at the present. Recently the 45Ca technique
has been using for determining growth appearances in corals because of its ability to calculate the calcification process. For this reason, the study on the rate of 45Ca uptake by natural corals
Acropora formosa and Acropora nobilis was carried out between June and December 2009 at the waters of Pulau Burung Island, Bangka-Belitung Province. The coral fragments of about 5 cm were harvested and put into a PVC container filled with 2 liters of fresh sea water, then incubated with 45CaCl
2 solutions with an activity of 11.04 μCi/ml for 8 hour under fluorescent
light. After the incubation, the “labeled” coral fragments were transplanted to where they have been taken from, and after such period will be re-harvested to determine their 45Ca
uptake content. The results showed that the 45Ca technique was a reliable method to calculate
the rate 45Ca uptake by coral fragments, which were studied in different depths and time
periods of light exposure. There was a significant difference in the 45Ca uptake by the two
different coral species. A. formosa up took more 45Ca than A. nobilis did. The highest 45Ca
uptake was shown by A. formosa at 5 m. This was true for all the lengths of time to light exposure (1, 3, 5 and 7 hours). Different pattern of 45Ca uptake showed by A. nobilis at 10 m
depth, where it could be recognized that after a drop of 45Ca the uptake increase continuously
until the end of the light exposure (7 hours). The difference in 45Ca uptake between the coral
fragments is assumed to be influence by light and the algae species living symbiotically with the coral species that will further influence the CO2-fixation. This process will influence the
calcification process, which is expressed in 45Ca uptake. Further studies should be carried out
to exactly gathered data of all the factors which could influence the calcification process by coral reefs, the factors could be CO2-fixation, flow of sedimentation, etc.
Keywords : coral, 45Ca, calcification, Acropora formosa, Acropora nobilis, Pulau Burung
ABSTRAK
TINGKAT SERAPAN 45Ca OLEH DUA SPESIES TERUMBU KARANG DI PERAIRAN PULAU BURUNG, PROVINSI BANGKA-BELITUNG. Transplantasi terumbu karang adalah teknik yang paling banyak digunakan untuk perbaikan terumbu karang pada saat ini. Akhir-akhir ini teknik radioisotop 45Ca banyak digunakan untuk menentukan
pertumbuhan terumbu karena mampu menghitung proses kalsifikasi yang terjadi. Dengan menggunakan teknik tersebut dilakuan pengkajian terhadap tingkat serapan 45Ca oleh
terumbu alami Acropora formosa dan Acropora nobilis. Percobaan dilakukan pada bulan Juni sampai Desember 2009 di perairan Pulau Burung, Provinsi Bangka-Belitung. Terumbu karang dipanen seukuran 5 cm dan direndam dalam 2 liter air laut pada wadah PVC, kemudian diinkubasi dengan larutan 45CaCl
2 aktivitas 11.04 μCi/ml selama 8 jam. Sebagai pencahayaan
sinar matahari digunakan lampu pendar. Setelah inkubasi, terumbu karang “bertanda” ditransplantasikan pada terumbu karang asalnya berada, dan setelah periode waktu tertentu dipanen kembali untuk menentukan kandungan serapan 45Ca. Hasil percobaan menunjukkan
terumbu, yang dipelajari pada kedalaman dan panjang waktu penyinaran matahari yang berbeda. Terdapat perbedaan yang nyata pada serapan 45Ca oleh kedua spesies terumbu.
Secara keseluruhan spesies A. formosa memperlihatkan serapan 45Ca yang lebih baik
dibanding A. nobilis. Serapan 45Ca tertinggi ditunjukkan oleh A. formosa pada kedalaman 5 m,
dibandingkan terhadap spesies yang sama pada kedalaman 10 m, dan juga dibandingkan terhadap A. nobilis pada kedalaman 5 dan 10 m. Kondisi ini berlaku pada seluruh panjang waktu penyinaran matahari (1, 3, 5 dan 7 jam). Adanya perbedaan serapan 45Ca pada
percobaan ini diduga dipengaruhi oleh sinar matahari dan alga yang hidup bersimbiosis dengan terumbu karang. Keduanya mempengaruhi fiksasi CO2 sehingga berpengaruh
terhadap proses kalsifikasi. Penelitian lebih lanjut dibutuhkan untuk memperoleh data yang benar-benar menyeluruh berkenaan seluruh faktor yang dapat mempengaruhi proses kalsifikasi terumbu karang, seperti faktor fiksasi CO2, laju sedimentasi, dan sebagainya.
Kata kunci : terumbu karang, 45Ca, kalsifikasi, Acropora formosa, Acropora nobilis, Pulau
Burung
INTRODUCTION
In Indonesia, the demolishing of coral reefs is mostly attributed to the development of the coastal areas namely the sea sand exploitation, industrial wastes consisted of heavy metals and toxic materials, using of bombs and cyanides for fishing [1]. More recently the global warming which has increased sea temperatures has been one of the important factors declining growth of the coral reefs and could be end by the dying of them. This could be observed by whitening of corals as happened in Australia at The Great Barrier Reef and in Indonesia [2,3].
According to SUHARSONO [4] in
Indonesia there are about 50.000 km2 coral reefs areas at 841 locations, of which about 5.23% are in very good, 24.2% in good, 37.34% in medium (between good and bad), and 33.17% bad condition could increase when no efforts to save the coral reefs are carried out.
There are several ways of rehabilitating condition of the coral reefs, i.e. by building artificial reefs, by transplanting coral, and by using of electricity to stimulate coral growth [4,5,6,7,8]. At present, coral reefs transplantation is the most technique used for coral reefs rehabilitation, especially when materials for building artificial reefs are not available [8,9]. Coral transplantation is done by cutting of fragments of healthy corals, considered as donors, and
transplanting it to the rehabilitation area [1]. After a period of time the transplanted coral is tested if it survives, meaning that the method could work on coral reefs rehabilitation.
In the early days of coral reefs studies, the measurement of corals growth was by using red alizarin, a color substance, to determine the volume and weight of the coral [1]. This method was not accurate. The method where volume and weight were involved, especially weight, often face serious difficulties. Weighing of the corals after a period of time rarely showed increasing numbers, and sometimes it looks like the corals have lost weight. This is due to the manifestation of the holes in the coral after a period of time. These holes obviously are responsible for the weight lost. It was assumed that these holes were made by small sea creatures, which symbiotically live with the corals. Recently the method used for determining growth appearances in corals is the 45Ca technique. By using the 45Ca technique the calcification process in
the corals could be calculated. The calcification process is used to proof that there is growth in the coral. The 45Ca in the
calcification process would form 45CaCO
3,
where the 45Ca could be calculated
qualitatively and quantitatively.
secrete organic substances which are the main substance used in the calcification process. The calcium of the seawater is bound by the organic substances to form CaCO3 which is then deposited into the coral constituents. Physical environmental factors which greatly influence the corals growth are obviously light and temperature. Other environmental factors which play a role in the calcification process are salinity, depth of the water, sedimentation and acidity (pH) [1]. Another environmental factor which could improve coral growth is a biological factor, in the form of Zooxanthellae (algae) which frequently live symbiotically with the corals. According to GOREAU and GOREAU [10] the algae plays a very important role in the calcification process. When the algae is inhibited or taken from the coral, the photosynthesis process could be terminated and it will result in very slow
CaCO3 formation. Corals capable of reef
building are invariably inhabit by Zooxanthellae, and their growth is dependable on light to execute their CO2 -fixation capability. This was shown by GOREAU and GOREAU [10] and GOREAU [11], where several coral reefs will decrease their Ca uptake when the light decrease from bright to cloudy and end at
darkness. For example Acropora palmate
showed 33.79 — 53.41 μg Ca/N/hour in
bright light. This will decrease to 18.80 —
33.80 μg Ca/N/hour in semi-darkness and
the lowest Ca uptake was at complete
darkness which was 2.56 — 3.84 μg
Ca/N/hour.
Why the rebuilding and the maintenance of coral reefs is important, could be summarized by quoting SUPRIHARYONO [12] who forwarded the advantages of preserving the coral reefs which are for increasing and maintaining fish production; as a source of food; source of medicine; tourist industry; ornamental sea fish aquariums; and as a barrier for great waves.
The purpose of this study is to determine the calcification ability of the coral fragments by using 45Ca. If calcification process happened then it means that there is growth in the coral fragments which have been transplanted.
MATERIALS AND METHODS
These works were carried out at the waters of Pulau Burung, District of South Bangka, Bangka-Belitung Province. The location in details is presented in Fig. 1. The experiment was carried out from June until December 2009 on two species of natural
coral Acropora, namely Acropora formosa and
Acropora nobilis, at coral reef area of Burung
Island water, Bangka. From June to October 2009 Survey to determine the location where the coral reefs grow, was done by continuously observing the coral every month visually. On October 2009 the corals and each coral reef were determined and ready to be studied for their calcification process by using 45Ca.
In October 2009, coral fragments of about 5 cm were taken from top of natural coral beds. The harvested coral fragments were put in glass vials with fresh sea water. The sea water was change every one hour. This was done for acclimatizing the coral fragments prior to incubation with 45Ca.
After acclimatization the coral fragments were put into a PVC container filled with 2 liters of sea water, and one hour later 45CaCl
2 solutions with an activity
of 11.04 μCi/ml was added. At the given
time, 10 p.m., the 45Ca solution was added to the seawater and was stirred gently for about 20 minutes. After stirring it was
considered that the 45Ca has dissolved
completely in the sea water. The container was then placed under fluorescent light for eight hour, from 10 p.m. to 6 a.m. The light was put 50 cm above the container. During the incubation period oxygen supply was done by putting an aerometer in the container. All this activity took placed in a fishing boat near the locations where the coral fragments were taken from. The incubation process was conducted using the method of VAN DER MEULEN and MUSCATINE [13] with some modification.
After about eight hour of incubation period, the coral fragments were put into small transparent PVC bags and transplanted from where they have been taken from, which was at 5 and 10 m depths at around 8 a.m. After 1, 3, 5 and 7 hours the coral fragments were re-harvested to
determine their 45Ca uptake content. The
time applied in this study is to exposure the coral fragments to daylight. As mentioned before the light will induce CO2-fixation by
the algae living symbiotically with the corals and play an important role in the calcification process. In this study the calcification process is expressed in 45Ca uptake.
The harvested coral fragments were put into PVC bags, sealed off and then taken to the isotope lab at the Agricultural Division of PATIR (Pusat Aplikasi Isotop dan Radiasi), Pasar Jumat, Jakarta Selatan. The samples were oven dried at 105oC. After reaching a constant dry weight, they were grinded to pass a 2 mm sieve. The grinded coral samples were put into porcelain cups and ashes by placing them into a furnace at
650oC for around 12 hours. The ashes were
dissolved in 17 ml concentrated HCl and
heated by hot plate at 100oC, until the
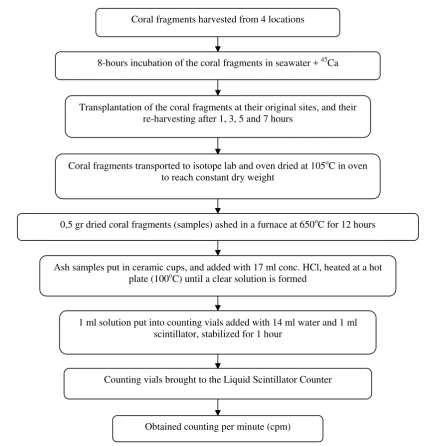
solution become clear. A one ml clear solution was taken and put into counting vials and 14 ml distilled water and 1 ml liquid scintillation was added and stabilized around one hour before counting them by liquid scintillation counter (LSC). To describe more clearly about the 45Ca analysis process, a diagram is presented in Figure 2.
The calcification process assumed would have taken place in the constituent of the corals in the coral reefs, represented by the coral fragments used. After coral fragments were incubated in 45Ca, they were transplanted onto their original site and left for 1, 3, 5, 7 hours. During this time it is assumed that the coral fragments carried out the calcification process, and the 45Ca will be deposited as 45CaCO3 in their constituent.
In this study the 45Ca technique is used as a method to evaluate the probability of the calcification process in the coral fragments from two coral species, namely A.
formosa and A. nobilis. All the works prior to
45Ca analysis involving coral fragments
RESULTS AND DISCUSSION
The base data to calculate the 45Ca
uptake is the counts per minute (cpm), which is acquired through Liquid Scintillation Counter. Further the values of
45Ca uptake could show the rates of
calcification process. The radioactivity measurement was done on December 30, 2009, about two months after the incubation in 45Ca and followed by transplanting, and terminated by harvesting the coral
fragments on October, 20, 2009. The cpm values were then transformed to dpm values, by dividing the cpm values with the counting efficiency of the Liquid Scintillation Counter (LSC). The dpm values on December 30, 2009 (Table 1) were then calculated to the date of October 20, 2009 (the date when the transplantation and harvest were carried out, see Table 2) as shown by L’ANNUNZIATA [14] with a decay factor of 0,697.
Coral fragments harvested from 4 locations
8-hours incubation of the coral fragments in seawater + 45Ca
Transplantation of the coral fragments at their original sites, and their re-harvesting after 1, 3, 5 and 7 hours
Coral fragments transported to isotope lab and oven dried at 105oC in oven to reach constant dry weight
0,5 gr dried coral fragments (samples) ashed in a furnace at 650oC for 12 hours
Ash samples put in ceramic cups, and added with 17 ml conc. HCl, heated at a hot plate (100oC) until a clear solution is formed
1 ml solution put into counting vials added with 14 ml water and 1 ml scintillator, stabilized for 1 hour
Counting vials brought to the Liquid Scintillator Counter
Obtained counting per minute (cpm)
Fig. 2. Scheme of 45Ca counting from harvest to cpm in coral fragments
Table 1. Counts per minute (cpm) and disintegration per minute (dpm) number of two different natural corals, at 30 Desember 2009.
Depth (m)
Transplan-tation
time (hours)
Acropora formosa Acropora nobilis
cpm dpm Ro-dpm**
Cpm dpm Ro-dpm
a* b* a b a b a b
5 1 9971 4466 15340 6871 11106 643 1524 989 2345 1661
3 9690 8871 14908 13648 14278 1428 4719 2212 9438 5825
5 14948 3669 22997 5645 14321 3867 1204 5949 1852 3901
7 6865 2009 10562 3091 6827 1015 1213 1562 1866 1714
10 1 4403 4559 6774 7014 6894 1031 2699 1586 4149 2868
3 1202 1465 1849 2254 2052 1069 1329 1645 2044 1845
5 1846 450 2840 692 1766 3074 nd 4729 nd 4729
7 418 914 645 1406 1025 3095 4862 4761 7210 5986
*a and b are two different samples from the same species **Ro-dpm is the mean value of a and b
Table 2. Disintegration per minute (dpm) numbers of two different natural corals at Desember 30th back dated to October 20th 2009 after incubated with 45Ca.
Depth (m)
Transplan-tation
time (hours)
Acropora formosa Acropora nobilis
dpm (30-12-2009)
dpm (20-10-2009)
Ro-dpm
dpm (30-12-2009)
dpm
(20-10-2009) Ro-dpm
a b a b a b a b
5 1 15340 6871 22009 9858 15934 989 2345 1419 2187 1803
3 14908 13648 21388 19581 20485 2212 9438 3174 13541 8357
5 22997 5645 32944 8099 20522 5949 1852 8535 2657 5596
7 10562 3091 15154 4435 9795 1562 1866 2241 2677 2459
10 1 6774 7014 9719 10063 9891 1586 4149 2275 5953 4114
3 1849 2254 2653 3234 2944 1645 2044 2360 2933 2647
5 2840 692 4075 2534 3305 4729 nd 6785 nd 6785
7 645 1406 925 1471 1198 4761 7210 6830 10344 8587
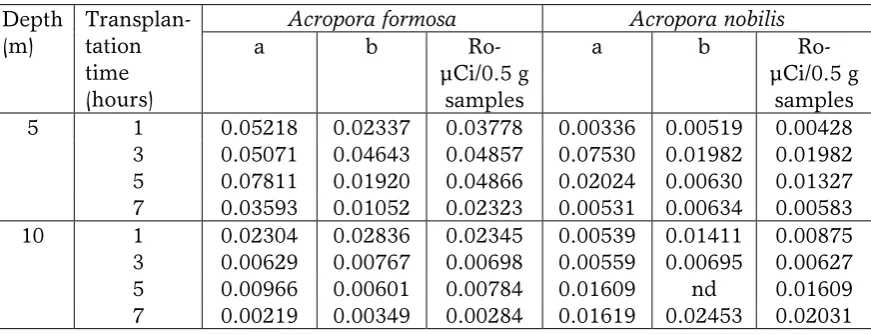
Table 3. Content of radioactivity 45Ca (μCi/sample) in two different natural corals determined at the date of October 20, 2009.
Depth (m)
Transplan-tation time (hours)
Acropora formosa Acropora nobilis
a b
Ro-μCi/0.5 g samples
a b
Ro-μCi/0.5 g samples
5 1 0.05218 0.02337 0.03778 0.00336 0.00519 0.00428
3 0.05071 0.04643 0.04857 0.07530 0.01982 0.01982
5 0.07811 0.01920 0.04866 0.02024 0.00630 0.01327
7 0.03593 0.01052 0.02323 0.00531 0.00634 0.00583
10 1 0.02304 0.02836 0.02345 0.00539 0.01411 0.00875
3 0.00629 0.00767 0.00698 0.00559 0.00695 0.00627
5 0.00966 0.00601 0.00784 0.01609 nd 0.01609
After obtaining the dpm values at October 20, 2009, the dpm were then transformed to
μCi (Table 3) as shown by L’ANNUNZIATA
[14] and the 45Ca uptake could be calculated according to this data (Table 4).
Data in Table 3 (μCi/ 0.5 g samples) is the transformation of the dpm data in Table 2. Table 1 to 3 all showed differences between the different two coral species, A.
formosa and A. nobilis, where the first
mentioned had much higher cpm, dpm and
μCi than the second species at the 5 m
depth. For the 10 m depth both species has small cpm, dpm and μCi values.
For the time of light exposure A.
formosa has an increase in cpm, dpm, and
μCi values up to 5 hours exposure at the 5 m depth, while at the 10 m depth all these values dropped after only 1 hour of
exposure. A. nobilis showed a different
pattern than A. formosa. At the 5 m depth,
the highest cpm, dpm, and μCi values were
reached at 3 hours after exposure and then dropped. Meanwhile at the 10 m depth there was a drop in the values of cpm, dpm and
μCi after 3 hours of exposure and then
increased to reach their highest values at 7 hours of exposure. These values for 45Ca are all in line with the values of cpm, dpm, and
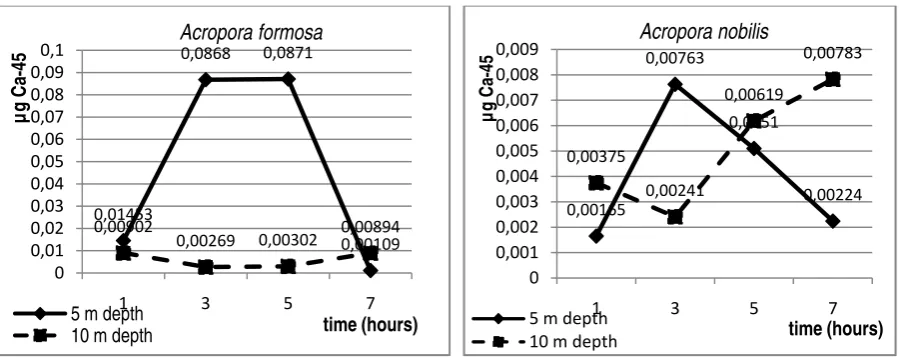
μCi as shown in Table 4. To simplify the data for discussion, the data of Table 4,
which is 45Ca uptake has been drawn and
presented in Fig. 3. The discussion will be focused in 45Ca uptake due to the fact that they are quantitative data, which is reliable to represent the calcification process whether it has occurred or not.
In this work the 45Ca uptake by the
coral fragments could be regarded as the rate of the calcification process. Here the environmental factors applied to the different coral species, A. formosa and A.
nobilis, were exposure time to the light (1, 3,
5, and 7 hours) and the depth (5 and 10 m) of coral location. It is assumed that the calcification process occurs whenever was taken up by the coral fragments.
In order to make a simple description
about the 45Ca uptake, which is playing a
role as a picture of the calcification process, the data in Table 4 is transformed into Fig. 3. The discussion is focused on 45Ca uptake as a representation of the calcification process, which is the most important data in
this study. By looking at the 45Ca uptake
data, the calcification process could be read. The high or low of 45Ca uptake is the picture of high or low the rate of the calcification process. Although 45Ca uptake are important data, it has to be taken into consideration that it could not be calculated without the determination of cpm, dpm, and μCi content of each sample (Tables 1, 2, 3).
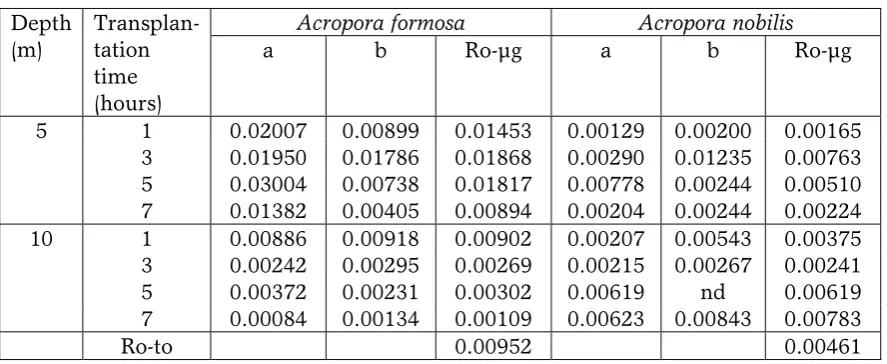
Table 4. The 45Ca uptake (μg) by two different natural corals fragment.
Depth
Acropora formosa Acropora nobilis
a b Ro-μg a b Ro-μg
5 1 0.02007 0.00899 0.01453 0.00129 0.00200 0.00165
3 0.01950 0.01786 0.01868 0.00290 0.01235 0.00763
5 0.03004 0.00738 0.01817 0.00778 0.00244 0.00510
7 0.01382 0.00405 0.00894 0.00204 0.00244 0.00224
10 1 0.00886 0.00918 0.00902 0.00207 0.00543 0.00375
3 0.00242 0.00295 0.00269 0.00215 0.00267 0.00241
5 0.00372 0.00231 0.00302 0.00619 nd 0.00619
7 0.00084 0.00134 0.00109 0.00623 0.00843 0.00783
Actually the data of Tables 1 to 3 could already be used qualitatively as an
indication of 45Ca uptake. This was shown
by VAN DER MEULEN and MUSCATINE [13], who showed high or low counts per minute (cpm) of Pocillopora diomicornis as a parameter of high or low calcification rates.
In this work, the 45Ca uptake by the coral fragments could be regarded as the rate of the calcification process as has been shown by several investigators [13]. Here the environmental factors which have been
applied to test the 45Ca uptake were two
factors namely exposure to light at rate of 1, 3, 5, 7 hours and different depth of the coral reefs location, which were 5 and 10 m depth. While other factors which could influence the calcification process, such as temperature; salinity; sedimentation; and pH were considered as stable factors. The results of these two factors are presented in Fig. 3, which was transformed from data in Table 4. The main discussion concerning the data in this work is 45Ca uptake.
Figure 3 shows that there are differences in the two species of A. formosa
and A. nobilis to their exposure to light and
depth of their growth location. In general it could be shown in Fig. 3 that A. formosa has
higher 45Ca uptake than A. nobilis 0.00952 >
0.00461 μg 45Ca/sample (Table 4, Ro-to).
Does this mean that A. formosa has a better calcification rate compared to A. nobilis, could be further answered by looking at Fig. 3.
The 5 m depth apparently was
favorable to 45Ca uptake by A. formosa,
showing the highest 45Ca uptake compared
to the same species at a 10 m depth and to the different species A. nobilis for both 5 and 10 m depth. To make the statement clearer it could be put as follows 45Ca uptake by A.
formosa at 5 m depth > A. formosa at 10 m
depth > A. nobilis at 5 and 10 m depth. This could be due to the penetration ability of the light, where at 5 m depth it has a higher penetration meaning higher light intensity compared to the 10 m depth. This conclusion was for A. formosa (Fig. 3) where obviously at the length of time to all light exposure (1, 3, 5, 7 hours) having the higher
45Ca uptake than the same species at 10 m
depth. For A. formosa at both depth, the
lowest uptake was at 7 hours to light exposure, this might be due to the lowering of the light intensity at 7 hours of exposure which was at 3 p.m. The highest 45Ca uptake
by A. formosa was on 3 and 5 hours exposure to light at 5 m depth and on 1 hour exposure at 10 m depth, although again it can be observed that at 5 m depth, the 1 hour exposure to light still gives higher 45Ca uptake than at the same exposure time at 10
m depth. The reason for low or high 45Ca
uptake which could be expressed in other words as low or high rate of calcification is due to the capability of the algae which have a symbiotic relation with the coral to carry out CO2-fixation [10].
The CO2-fixation by algae could
increase the deposition of Ca. This could be
seen on A. formosa, when taking into
consideration that A. formosa at both depth has the same algae species grown in symbiotic relation, then the light intensity will be the main factor to lower or higher the CO2-fixation. As it was said before the rate of CO2-fixation will decrease or increase the calcification process and in this study is expressed in 45Ca uptake. Obviously the 45Ca uptake in A. nobilis was down below the A.
formosa especially at the 5 m depth. The
pattern of 45Ca uptake done by A. nobilis at 5 m depth is similar to that of A. formosa, but then decrease earlier than that of A. formosa. After 5 hours of exposure to light, A. nobilis
already showed a sharp decrease of 45Ca
uptake, while contrary in A. formosa which still show increase albeit at a very low rate. The reason might be that although on the same depth (5 m) the capability of the algae
which is growing symbiotically with A.
nobilis has lower CO2-fixation capacity. This
was then shown by decreasing 45Ca uptake
by A. nobilis. Of course this need more
detailed studies. At the 10 m depth surprisingly A. nobilis demonstrate different
pattern in 45Ca uptake compared to A.
formosa. Apparently at this depth A. nobilis
has more 45Ca uptake capacity at 5 and 7
hours of exposure. After a decrease in 45Ca uptake at 3 hours to light exposure, the 45Ca uptake increase at 5 and 7 hours to light exposure and reach it highest rate of 45Ca uptake at 7 hours of exposure. This might be explained by several factors. First the light penetration, it could be that at the location
of A. nobilis after 3 hours of light exposure,
the light penetration increase resulting in greater light intensity. This greater light intensity could enhance the CO2-fixation resulting in higher 45Ca uptake by A. nobilis. This did not explain why at the 5 m depth
A. nobilis could not reach 45Ca uptake as
high as at the 10 m depth. It is expected that at the shallower depth the coral fragments could do more CO2-fixation activity than at deeper depth. This might be explained by the sedimentation. Visually the divers have spotted that at 10 m depth there was a stronger current than at 5 m depth bringing with it plenty sediment materials which consist of several nutrition. This nutrition could have been beneficial for the algae growth. More algae growth although at deeper waters could have resulted in higher CO2-fixation activity. And this all could have resulted in higher 45Ca uptake. It might be that at this particular spot there was high sedimentation. Again all this needs more detailed studies with more environmental factors to be involved.
In general from this study it could be concluded that the length of light exposure
could increase or decrease 45Ca uptake by
both coral species. Different depth could
influence difference in 45Ca uptake, and
when this is connected to light exposure
again different 45Ca uptake arouse. A.
formosa could have benefit from the length
of light exposure to a certain point at the same depth but a different pattern occurs at the 10 m depth expressed in 45Ca uptake. On the other hand at the 10 m depth A. nobilis in connection with length of light exposure at 5 and 7 hours undergoes an enhancement of 45Ca uptake.
The 45Ca uptake by both coral species
is an expression of the rate of the calcification process done. The high or low
of the CO2-fixation by algae living
light penetration at different depth causing different light intensity is responsible for the different CO2-fixation by the algae living symbiotically with the coral species. This fixation process could be expressed in 45Ca uptake by coral species and could be calculated quantitatively. This quantitative calculating of 45Ca uptake is able to estimate the calcification process carried out by the coral species.
CONCLUSION
Data obtained by this study would be concluded as follows;
- The 45Ca method could be used
satisfactorily to calculate the 45Ca uptake by the coral fragments studied in different depth and several light exposures.
- There was a significant difference in the
45Ca uptake by the two different coral
species namely A. formosa and A. nobilis, in overall A. formosa showing a sufficient 45Ca uptake than A. nobilis.
- Higher 45Ca uptake was shown by A.
formosa at 5 m depth compared to the
same species at 10 m depth, and to A.
nobilis at 5 and 10 m depth, this was true
for all the time periods of light exposure (1, 3, 5 and 7 hours).
- The 45Ca uptake showed difference
patterns, when plotted against time periods of light exposure. A. formosa has
the highest 45Ca uptake at the 5 hours
light exposure and then dropped sharply reaching its lowest 45Ca uptake at 7 hours of light exposure, at 5 m depth. While at 10 m depth, this species showed the highest 45Ca uptake at the earliest light exposure (1 hour) and then dropped at the further time periods of exposure.
- For A. nobilis at 5 m depth the 45Ca
uptake showed a similar pattern as shown by A. formosa, but here the highest
45Ca uptake was at the 3 hours of light
exposure, and to decrease sharply after 3 hours of light exposure. There was a different pattern of 45Ca uptake at 10 m depth, where it was shown that after a
drop of 45Ca uptake there is a continuous increase up to the end of the light exposure (7 hours).
- The difference in 45Ca uptake in the coral fragments is assumed to be influenced by light and algae species living symbiotic with the coral species.
- The 45Ca uptake is evidence that the coral fragments transplanted has growth during this study.
- Further studies should be carried out to
exactly gathered data of all the factors which could influence the calcification process by coral reefs, the factors could
be CO2—fixation, flow of sedimentation,
etc.
ACKNOWLEDGEMENT
We would like to thank DP2M DIKTI for funding this study. The authors also wish to thank Mr. Amrin Djawanas and Prof. Riset Elsje L. Sisworo, Ir., MS., for their involvement in the field and laboratory assay. We also appreciate Prof. Riset Elsje L. Sisworo, Ir., MS., for editing this paper.
REFERENCES
1. IDRIS, Pendugaan laju kalsifikasi karang dengan menggunakan
radioisotop 45CaCl2 sebagai tracer
(penanda) pada karang jenis
Euphyllia cristata di Pulau Pari,
Kepulauan Seribu, Skripsi, FPIK — IPB, Bogor (2004).
2. ANONIMOUS, Mesti Berjuang untuk
Hidup, KOMPAS, Kamis 29 April
2010, 13 (2010).
3. SUHARSONO dan KISWARA, W., Kematian karang alami di Laut Jawa, Oseana, 9 (1), 31 — 40 (1984).
Pusat Penelitian Oseanologi, LIPI, Jakarta (1996).
5. CLARCK, S., and EDWARD, A.J., “Coral Transplantation as an Aid to Reef Rehabilitation, Evaluation of a Case Study in The Maldive Islands”, University of New Castle, New Castle (1995).
6. BIRKELAND, A., RANDALL, G., and GRIMM, G., Three Methods of Coral Transplantation for Purpose of Re-establishing a Coral Community in Thermal Effluent Area of The Tanguisson Power Plant, Guam Marine Lab. Tech., Rep. No. 60, 1 — 24 (1979).
7. HILBERTZ, W., FLETCHER, D., and KRAUSSE, C., Mineral aeration technology, applications architecture and aquaculture, Industrial Forum, 8, 75 — 84 (1977).
8. HERDIANA, Y., Respon pertumbuhan serta keberhasilan transplantasi koral terhadap ukuran dan posisi penanaman pada dua spesies karang
Acropora micropthalma dan Acropora
intermedia di Perairan Pulau Pari,
Kepulauan Seribu, Skripsi, FPIK — IPB, Bogor (2001).
9. HARIOT, V.J., and FISK, D.A., Coral Transplantation as a Reef
Management Option, Proc. Of the 6th Int. Coral Reef Symp., Australia, 2, 75 — 79 (1998).
10. GOREAU, T.F., and GOREAU, N.I., The Physiology of skeleton formation in corals. I. A method of measuring the rate of calcium deposition by corals under different conditions, Biology Bulletin Marine,
Biology Laboratory Woods, 116, 59 —
75 (1959).
11. GOREAU, T.F., Problem of growth and calcium deposition in reef coral,
Endeavor, 20, 32 — 40 (1961).
12. SOEPRIHARYONO, The Effect of
sedimentation on a fringing reef in North Central Java, Indonesia, Thesis, Univ. of New Castle upon Thyne, New Caste Upon Thyne, (1976).
13. VAN DER MEULEN, J.H., and
MUSCATINE, L., “Influence of Symbiotic Algae on Calcification in Reef Corals Critique and Progress Report, Symbiosis in the Sea”, University of South Carolina Press, South Carolina, 1 — 19 (1974).