emerging market: Indonesian Stock Exchange”
AUTHORS
Yuliani, Isnurhadi, Ferry Jie
ARTICLE INFO
Yuliani, Isnurhadi and Ferry Jie (2017). Risk perception and
psychological behavior of investors in emerging market:
Indonesian Stock Exchange.
Investment Management and
Financial Innovations
,
14
(2-2), 347-358.
doi:10.21511/imfi.14(2-2).2017.06
DOI
http://dx.doi.org/10.21511/imfi.14(2-2).2017.06
RELEASED ON
Saturday, 19 August 2017
RECEIVED ON
Tuesday, 14 February 2017
ACCEPTED ON
Monday, 26 June 2017
LICENSE
This work is licensed under a
Creative Commons
Attribution-NonCommercial 4.0 International License
JOURNAL
"Investment Management and Financial Innovations"
ISSN PRINT
1810-4967
ISSN ONLINE
1812-9358
PUBLISHER
LLC “Consulting Publishing Company “Business
Perspectives”
NUMBER OF REFERENCES
32
NUMBER OF FIGURES
1
NUMBER OF TABLES
11
Abstract
Capital market functions as a mediator between parties who have excess funds that is, investors and those who need the funds that is, emitents. Decision to sell and buy shares of a inancial asset is very strategic decision for investors because it is associated with the chances of return to be earned in the future. he objective of this paper is to investigate the investor’s psychology on buying and selling common stock in the stock exchange in emerging market. he speciic purpose of this research is to provide the simultaneous empirical evidence about the perception of risk, psychology aspects to-wards the conidence and performance. he sample consists of 100 individual investors in Palembang, South Sumatera, Indonesia. he data were collected during March-May 2016 using questionnaire. Research indings show that perception of risk and psychol-ogy signiicantly afect conidence. Furthermore, conidence has a signiicantly posi-tive impact on performance. his research has not been explained entirely towards the investor’s psychological behavior aspects, so the additional variable may be needed as the full relection of investor’s psychology. he further research may use experimental study, starts from buying stocks, and factors that can be considered in selling stock. Yuliani (Indonesia), Isnurhadi (Indonesia), Ferry Jie (Australia)
BUSINESS PERSPECTIVES
LLC “СPС “Business Perspectives” Hryhorii Skovoroda lane, 10, Sumy, 40022, Ukraine
www.businessperspectives.org
Risk perception and
psychological behavior
of investors in emerging
market: Indonesian Stock
Exchange
Received on: 14th of February, 2017 Accepted on: 26th of June, 2017
INTRODUCTION
he role of capital market in a country is related with capital low and economic growth. Indonesia’s economic growth requires funding and a sizeable investment to be able to compete regionally and globally. he number of issuers, Composite Stock Price Index, amount of outstand-ing shares and a market capitalization luctuates and shows improve-ment for the last two years, 2015 and 2014. In addition, the amount of outstanding shares luctuates as well and tends to decline by 9.06%, but the value of market capitalization increases by 23.92% (www.idx.co.id, 2014). he increasing number of issuers improves capital market perfor-mance so as to open opportunity for investors to increase their ment activities. Decision of investors to use capital market for invest-ment activities is classiied as inancial assets. he behavior of investors to buy and sell inancial assets is a strategic decision, because it is related to the return they gain. he individual investor’s behavior in investment decision on inancial assets is something interesting to study.
Based on the number of shares owned by the investor, it was found in the study by Barber and Odean (2001) with sample by 78,000 investors in the US that the average number of shares held is 2 and 3 and the © Yuliani, Isnurhadi, Ferry Jie, 2017
Yuliani, Ph.D., Universitas Sriwijaya, Indonesia.
Isnurhadi, Ph.D., Universitas Sriwijaya, Indonesia.
Ferry Jie, Associate Professor, Edith Cowan University, Australia.
his is an Open Access article, distributed under the terms of the
Creative Commons Attribution-Non-Commercial 4.0 International license, which permits re-use, distribution, and reproduction, provided the materials aren’t used for commercial purposes and the original work is properly cited.
conidence, perception of risk, psychology, performance
Keywords
percentage of investors who are able to earn returns above the market index is 49.3%. In the previuous year, Barber and Odean (2000) conducted a study using household investors as the respondents cover-ing 35,000 investors for six years. his study found that male investors make transactions 45% more oten than female investors, even the single male investors transacted 67% more frequently than that of single female investors. he interesting inding of this study is that due to the diferent trading fre-quency, male investors’ net proit reduced as much as 2.5%, while only 1.72% for female investors. his diference indicates that the female investor’, ultimately, are more prosperous than male investors. Talar (2004) found that the dominant factors afecting the decisions of daily stock transaction are technical, foreign investors, stock liquidity, as well as rumors.
he purpose of this study is to examine the inluence of risk perception on investors’ conidence in the stock exchange, to explain the inluence of psychological factor on investors’ conidence and explain the efect of stock market conidence on the stock performance.
1.
THEORIES AND
HYPOTHESES
Investing is simply deined as placement of money or funds with the hope to obtain additional money or funds. Investment is also deined as the com-mitment of a number of funds to one or more as-sets to be held for some time to come. Investment as a commitment to the number of funds or oth-er resources is done at this time with the aim to make a proit in the future (Salge et al., 2015; Linnenluecke et al., 2016).
From the above deinition of investment, it can be inferred that investment consists of three ele-ments, namely expense or sacriice of resources at the present, then, an element of risk uncertainty and return in the future. Someone who invests has diferent motives. For instance, to meet liquidity needs, to save for retirement, to speculate and so on. Investments can be classiied into two catego-ries: investment in real assets, namely the tangible ixed assets and another category is investment in inancial assets. his research focuses on the
study of inancial assets in the form of marketable securities traded in the organized market/stock exchange.
Types of investors are described in the studies by Grinblatt and Keloharju (2001), Hui and Li (2014). All investors can be classiied into three: (1) a
con-servative investor, the type of investors who tend to avoid risks, play in investment instruments and low risk, (2) moderate investors, namely investors who have high levels of tolerance for higher risk with commensurate results, (3) an aggressive inves-tor, that is, an investor who hase high risk tolerance level, with the principle of high risk return even at extreme scale. his type of investor can be viewed as a speculator. In addition, traders are classiied into ive, namely: scalpers, day traders, swing trad-ers, position traders and investors. he diferences of type of trader are shown in Table 1.
Behavioral inance is studied to explain the mar-ket ineiciencies using psychological theories. In practice, it is observed that an individual oten-times makes mistakes and illogical assumption
Table 1. Type of traders
Type of trader Scalper Day trader Swing trader Position trader Investor
Trading style Aggressive Aggressive Aggressive enough Passive Passive
Trading total Many Many Many enough Few Few
Time frame Very short (min-hour) Short (min-hour) Long (day-week) Longer (week-month) Very long (month-year)
when dealing with inancial matters. he emer-gence of behavioral inance begins when Shiller, a professor from Yale University, wrote a work-ing paper titled “Irrational Exuberance”. Shiller warned investors that stock price based on various historical measurements will rise too high, and public will be very disappointed with the perfor-mance of stocks in the future. his is proved by the decrease of stock prices shortly ater a warning from Shiller.
Behavioral finance is still a new paradigm in the research fields of finance, which provides a supplement to standard finance theory by in-troducing the behavioral aspects of the decision. In contrast to the approach of Markowitz and Sharpe, behavioral finance approved the way people use information. Behavioral finance try to find and predict the implications of the fi-nancial markets on a systematic psychological decision processes so that the focus is on the application of economic principles for finan-cial decision making (Barberis & Thaler, 2001; Singh et al., 2003; Du, 2012).
Topics in behavioral inance consist of: (1) Be-havioral Microinance (BFM), which examines the behavior or biases of individual investors that dis-tinguish them from rational individual as in classi-cal economic theory, (2) Behavioral Macroinance (BFM) to detect and describe anomalies in the ef-icient market hypothesis described in the model behavior. his study focused on BFMI, the study of the behavior of individual investors, in order to identify psychological biases and investigate the behavior of the asset allocation decision so as to re-duce bias in the investment process.
Lucey (2005) conducted a survey on the influ-ence of the feeling of investors in equity prices and also developed the theory to explain the emergence of the findings in this area. This study examines the impact of environmental factors such as weather, biorhythms of the body, and social factors that affect the image of the mood of investors that has an impact on in-vestment decisions. The research findings are: (1) investors invest in a manner which is con-sistent with their feelings, (2) feelings’ effect on equity prices, (3) the weather, biological cycle of the body, disruption of sleep patterns, the lunar
phases, social activities and the effect of mood on decision-making.
Furthermore, Worhington (2006) examined the relationship between weather and mood and feeling for Australian investors in the capital market during the period 1958–2005. Eleven el-ements of weather were inserted, i.e., precipita-tions, evaporation, relative humidity, tempera-ture maximum and minimum, average temper-ature daily, hours of sun shine, wind speed and direction, average daily wind speed to real and nominal market return. Using non-parametric correlation analysis and autoreggresive moving average models, the findings of this study show that weather factors do not affect market return.
Another study conducted by Durand and Sanghani (2008) examined the relationship be-tween personality and investment decisions and portfolio performance. he sample consisted of 18 individual investors who hold equity port-folios in Australia for the inancial year ended 30 June 2005. he indings of the study include: (1) individuals who are more extrovert and less masculine have a greater preference for innova-tion and achieve superior portfolio performance, (2) individuals who have higher negative emo-tions tend to take higher risk and more oten to choose higher risk portfolio, (3) the higher nega-tive emotions of individuals who have a tendency of taking higher risks are also related to increase in trading behavior, while investors who are more extrovert were found to have a lower ten-dency toward trading behavior and (4) the role of psychological gender is better than the biolog-ical gender in analyzing the investors behavior.
using the method of path analysis showed that the average investor holding ordinary shares for two years and, in general, all investors are more oriented towards short-term investments with the expected capital gains rather than dividends. Research on fundamental variables in predicting stock return is done by Yanti (2012) on the object of observation shares of Shariah in Indonesian Stock Exchange. Using path analysis found that the investment strategy of the investors in the shares of Shariah is a priority to fundamental in-formation Price Earnings Ratio (PER) and stock return. Based on the description above, the model of the research hypotheses as follows:
Based on Figure 1, hypotheses of this research are:
H1: Risk perception has a signiicant efect on stock market conidence.
H2: Investor psychology has a signiicant efect on stock market conidence.
H3: Conidence in stock market has a signiicant efect on stock market performance.
2.
METHODOLOGY
2.1. Data and operational variable
Data used in this research are primary data ob-tained by using a questionnaire. Purposive sam-pling is used to identify respondents based on these criteria: (1) investors are still active in trad-ing common stock, (2) investors have been in-volved in capital market as investors for at least two years, (3) investors are not directly involved in the government strategic decision making or as government oicials. he analytical unit of this re-search is individual investor. he data collection period is three months (March-May, 2016). Data collection was performed using questionnaires and direct interviews. he result is 100 valid data.
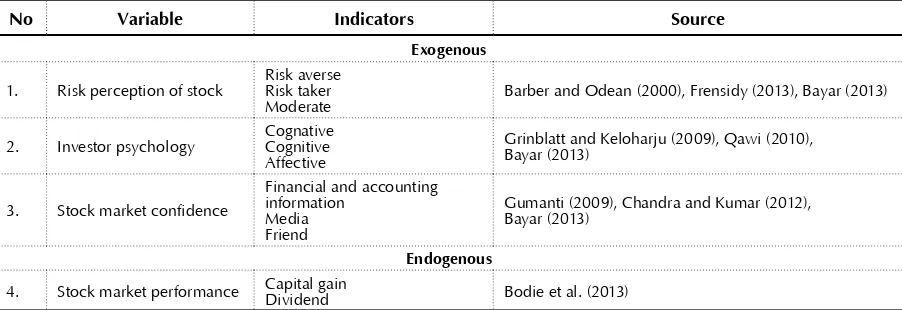
he variables used in this study are divided into exogenous and endogenous. Exogenous variables consist of risk perception, the psychology of in-vestors, conidence in capital markets, while the endogenous variable is the performance of com-mon stock. To measure the variables, Likert scale was employed. he scale includes an interval of 1
Figure 1. Research model
Table 2. Operaional variable research
No Variable Indicators Source
Exogenous
1. Risk perception of stock Risk averse Risk taker
Moderate Barber and Odean (2000), Frensidy (2013), Bayar (2013)
2. Investor psychology CognativeCognitive Affective
Grinblatt and Keloharju (2009), Qawi (2010), Bayar (2013)
3. Stock market confidence
Financial and accounting information
Media Friend
Gumanti (2009), Chandra and Kumar (2012), Bayar (2013)
Endogenous
4. Stock market performance Capital gain Dividend Bodie et al. (2013)
Risk
perception
psychology
Investor
to 5, which comprises: Strongly Disagree (score 1); Disagree (score 2); Normal (score 3); Agree (score 4) and Strongly Agree (score 5). he operational dei-nition of each variable is presented in Table 2 below.
2.2. Data analysis
he instrument to collect data in this study was a questionnaire prepared using 5-point Likert scale. he quesionaires have been tested for validity and
reliability. Validity test is to determine whether the instrument meets the requirements of the validity of each variable by using the Pearson product mo-ment. he research instrument is valid if the value of validity is r≥0.3 and signiicance of the correla-tion value is ≤ 95% or
α
=0.05 andα
=0.01.Realibility test is to look at the consistency of re-spondents to the question items. he test is done by looking at the Cronbach’s alpha coeicient with the limit value (cut of points) feasible being ≥0.6.
his study uses Structural Equation Model (SEM) based component or variance which is noted for as Partial Least Square (PLS). he reason using PLS is as follows: (a) there are more than one variable, namely the perception of risk, investors psychol-ogy; investor conidence and stock market perfor-mance; (b) involving latent variables, where vari-ables analyzed are unobservable; (c) the model is recursive; (d) the relationship formed is causality.
Furthermore, the hypothesis were tested by us-ing the followus-ing steps: 1) assumus-ing linearity test, 2) outer model test (measurement model), 3) Goodness of Fit inner structural model in form PLS Q-square predictive value relevance
( )
Q
2 which is calculated based on the value ofR
2.
Magnitude
Q
2 has a value range of0
<
Q
2<
1,
where 1 means that the closer model, the better.
2
Q
calculations performed by the formula:(
) (
) (
)
a
β
stock market confidence
ε
= +
+
3.
EMPIRICAL RESULTS
100 quesionares were collected from the respon-dents (investors) in Palembang during April-June 2016. he demographic data of the investors are shown in Table 3.
According to Table 3, the gender is 63% males and 37% females. Male investors are more dominant, since the reference rate in inancial assets is less for women to become an investor. he age of inves-tors ranges from 20-25 years old, and 62 people are single. 77 people have an undergraduate education level, six people have a high school diploma and 17 people have a master degree. According to this frequency, there is something interesting because as many as 20 respondents do not trade regularly in short period of time, meaning that the inves-tors have a long-term goal which is called dividend yield orientation.
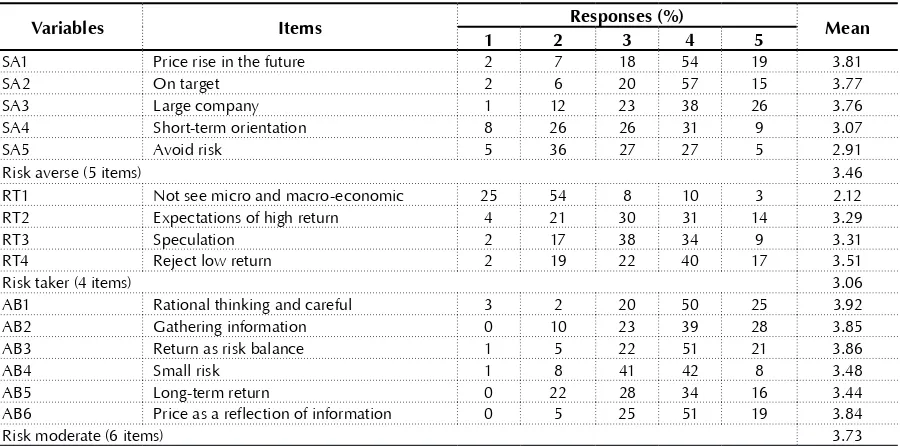
he perception of risk of investors falls into three categories, that is, risk averse, risk moderate and risk taker. he risk perception of investors in Palembang is showed in Table 4. From the table, it can be seen that the index of risk perception value on average is 51.94%, while the risk moderate is on average 3.73. he indings show that investors in Palembang dislike risk, but want high return.
Investor’s phychology is relected in three indi-cators, namely cognitive, afective and cognative. Table 5 shows the variables describing investor’s psychology where cognative indicator is domi-nant on average of 3.72. It is clear that investors in Palembang in investing in inancial assets have a target return that will be obtained and the risk is to be faced, while the dominant items are the relection of cognative indicators. Investors in Palembang are satisied with investing in the stock market, because it can give space to invest, as well manage alternative funds. he results show that investor psychology based on perception in-dex is 77.84% which is high with mean of 3.45. he high perception index indicates that investors in Palembang are optimistic in response to a state-ment on the psychology of being an investor.
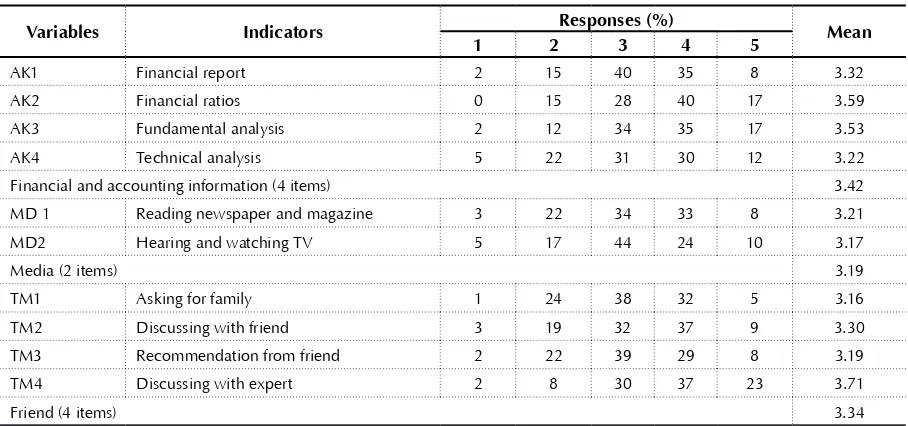
an investor in the capital market. Measurement of this variable is relected by three indicators of accounting and inancial information, informa-tion from the media and the recommendainforma-tion of friends. he description of the respondents for these variables is shown in Table 5. he dominant indicator of this variable is the accounting and
i-nancial information with the amount of the ave-rage 3.42. he results of this description suggest that investors in Palembang, before making a pur-chase and sale of common stock, will pay attention to the company’s fundamental information that is most oten done using the company’s inancial re-port data source.
Table 3. Respondentsʼ demography descripion
Demography description N Valid (%) Cumulative (%)
Gender Men 63 63.0 63.0
Women 37 37.0 100.0
Age
< 20-25 35 35.0 35.0
26-30 31 31.0 66.0
31-35 11 11.0 77.0
36-40 23 23.0 100.0
Job
Civil servant 2 2.0 2.0
Private employees 31 31.0 33.0
Privatized employees 47 47.0 80.0
Housewife 2 2.0 82.0
Entrepreneur 7 7.0 89.0
College student 4 4.0 93.0
Other 7 7.0 100
Education
Diploma 6 6.0 6.0
Bachelor 77 77.0 83.0
Master 17 17.0 100.0
Marital status Married 38 38.0 38.0
Single 62 62.0 100.0
Frequency trading
Every day 27 27.0 27.0
Every week 28 28.0 55.0
Each month 25 25.0 80.0
Do nothing 20 20.0 100.0
Table 4. Risk percepion of investors
Variables Items Responses (%) Mean
1 2 3 4 5
SA1 Price rise in the future 2 7 18 54 19 3.81
SA2 On target 2 6 20 57 15 3.77
SA3 Large company 1 12 23 38 26 3.76
SA4 Short-term orientation 8 26 26 31 9 3.07
SA5 Avoid risk 5 36 27 27 5 2.91
Risk averse (5 items) 3.46
RT1 Not see micro and macro-economic 25 54 8 10 3 2.12 RT2 Expectations of high return 4 21 30 31 14 3.29
RT3 Speculation 2 17 38 34 9 3.31
RT4 Reject low return 2 19 22 40 17 3.51
Risk taker (4 items) 3.06
AB1 Rational thinking and careful 3 2 20 50 25 3.92
AB2 Gathering information 0 10 23 39 28 3.85
AB3 Return as risk balance 1 5 22 51 21 3.86
AB4 Small risk 1 8 41 42 8 3.48
AB5 Long-term return 0 22 28 34 16 3.44
AB6 Price as a reflection of information 0 5 25 51 19 3.84
Risk moderate (6 items) 3.73
Table 5 shows that average stock market coni-dence is 33.40% with mean 3.32. hese indings suggest that investors in Palembang fall into the category of lower index value. his indicates that the low level of conidence in the inancial asset is associated with stocks. he previous variables of risk perception of moderate risk are corre-lated with low level of conidence of investors in Palembang.
Stock market performance is the response of in-vestors in the capital market. Stock market
per-formance in this study is relected by indicators of capital gains and dividend periodically. Capital gain is measured by three items, namely, stock prices continuing to rise, constantly monitoring prices and make purchases on a daily basis and orientation to the stock price. Based on these three items, the stock price increases have the highest response from investors in Palembang.
Indicator shows that the distribution of proit as dividend obligations to the company’s sharehol-ders on average is 3.50. Referring to the average
Table 5. Responses to stock market conidence
Variables Indicators Responses (%) Mean
1 2 3 4 5
AK1 Financial report 2 15 40 35 8 3.32
AK2 Financial ratios 0 15 28 40 17 3.59
AK3 Fundamental analysis 2 12 34 35 17 3.53
AK4 Technical analysis 5 22 31 30 12 3.22
Financial and accounting information (4 items) 3.42 MD 1 Reading newspaper and magazine 3 22 34 33 8 3.21
MD2 Hearing and watching TV 5 17 44 24 10 3.17
Media (2 items) 3.19
TM1 Asking for family 1 24 38 32 5 3.16
TM2 Discussing with friend 3 19 32 37 9 3.30
TM3 Recommendation from friend 2 22 39 29 8 3.19
TM4 Discussing with expert 2 8 30 37 23 3.71
Friend (4 items) 3.34
Note: Average stock market conidence (x): 33.40% with mean 3.32. Intepretation index value is 10-40% = Low; 41-70% = Average; 71-100% = High.
Table 6. Responses to stock market performance
Variables Indicators Responses (%) Mean
1 2 3 4 5
CG1 Increasing stock price 1 9 18 41 31 3.92
CG2 Look and buy every day 1 16 33 34 16 3.48
CG3 Stock price orientation 0 14 29 41 16 3.59
Capital gain (3 items) 3.66
DV1 Long-term goal 4 10 34 32 20 3.54
DV2 Profit dividend 4 9 28 48 11 3.53
DV3 Cash dividend 2 12 32 31 23 3.61
DV4 Profit growth 2 16 40 31 11 3.33
Dividend (4 items) 3.50
perception index it can be concluded that the re-sponses of investors in Palembang in buying and selling stock is low at 25% with the average of 3.58. hese indings indicate that the investors are
ori-ented towards capital gain.
Descriptive statistic of the data is important to see data distribution. Table 7 shows that the lowest value of the variable risk perception is 2.73 and the highest is 4.47 with mean of 4.463 and standard deviation of 0.396. The standard deviation value which is smaller than mean in-dicates that the data are spread evenly so that it can otherwise be normal. The difference be-tween the highest value and the lowest due to the characteristics of each respondent is diffe-rent and can be seen from the respondents age of 35% or < 20-25 years. This can affect the per-ception risk of investing in stocks that a high level of risk.
Investor’s psychology, which is reflected by three indicators, namely, cognitive, affective and cognative shows the highest value of 6.63, the lowest 1.50, mean and standard deviation of 4.56 and 0.55. The average value is greater than standard deviation and indicates that the data are normally distributed so that it can be stated that there are discrepancies among respondents with respect to the perception of the psychology of knowledge about the capital market, the tar-get return and risk and emotional factors. Stock
market confidence shows investors’ perceptions in gathering information to analyze the decision of buying and selling shares. The lowest value of this variable is 2.0 and the highest 4.6 indicat-ing that respondents have different perceptions toward accounting and financial information, gathering information from the media and ask-ing for a favor from their friends.
Stock market performance is relected in the amount of capital gain and dividends and shows the desire of investors on inancial assets. he lo-west value is 2.43, the highest is 5.0, the mean is 3.57 and the standard deviation is 0.54. Capital gain relects the diference between the purchase price and selling price of shares. he higher this dif-ference, the higher stock performance and inves-tor expectations. Dividend is a shareholder right so that long-term investors will look at the funda-mentals of companies in various aspects. he most aspect is the growth of sales and proit growth.
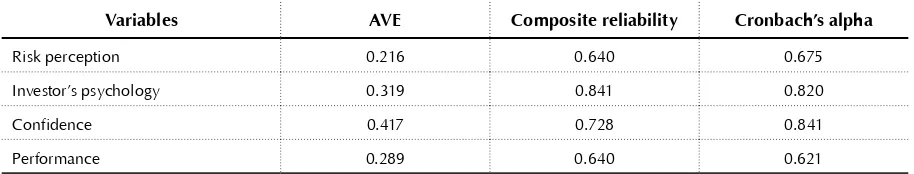
The was conducted important by using a ques-tionnaire to determine the reliability and va-lidity. If valid and reliable, the can be used for testing the hypotheses that have been proposed. The reliability test results are shown in Table 8.
Testing instruments seen from the magnitude Average Variance Extracted (AVE) show greater than 0.05. It appears that all variables are accep-ted. Reliability test by Tucker and Levi based on
Table 7. Descripive staisics (N = 100)
Variable Min Max Mean deviation Standard
Risk perception 2.730 4.470 3.463 0.396
Investor’s psychology 1.500 6.630 3.459 0.545
Confidence 2.000 4.600 3.340 0.621
Performance 2.430 5.000 3.571 0.541
Table 8. The result of the test reliability
Variables AVE Composite reliability Cronbach’s alpha
Risk perception 0.216 0.640 0.675
Investor’s psychology 0.319 0.841 0.820
Confidence 0.417 0.728 0.841
composite reliability shows that all the variables is reliable. In addition, the value of Cronbach’s alpha with the provisions of 0.7 to 0.5 is still ac-ceptable meaning that the instrument used is reliable. From Table 8, it is seen that highest va-lue of Cronbach’s alpha is investor’s psychology. It means that the reliability of each item in the statement is consistently relected in the studied variables. he indicators of investor’s psycho logy variables in this study consist of cognitive, afec-tive and cognaafec-tive and, so, are called the three important things for an investor in the buying and selling shares in the capital market. Testing discriminant validity is conducted by looking at the correlation between variables. Validity of a variable will be indicated by high value correla-tion. he high correlation value relects that the research instrument is valid. Table 9 shows that the correlation between variables is so high that it can be concluded that the instruments are valid.
Testing linearity in this study is done using a curve fit with reference to the principle of par-simony. Table 10 above shows that all the rela-tionship between variables are linear and all
models are significant. Based on the linearity test results, it can be stated that the relationship between each independent variable is linear to-wards the dependent variable. This linearity as-sumption test results will be used to continue the test of the hypotheses. The higher the val-ue of
Q
2,
the better research model is used to predict performance. Table 10 shows the value of 0.605 meaning that the model is still consid-ered good enough to predict the performance as much as by 60.5%. Another 30.5% of other variables outside the model can still be used to predict performance.The recapitulation hypotheses test results are shown in Table 11.
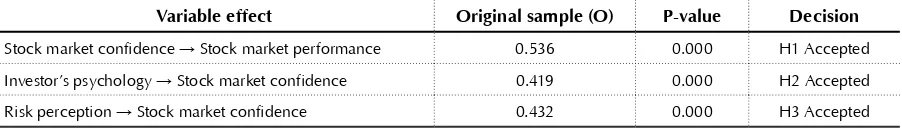
Table 11 shows that all the hypotheses are accepted. They indicate that investors in Palembang in investing are financial assets, all items of the research intruments are well explained. Theoretically all variables used in this study based on the concept of behavioral finance will be a strong concept to predict the stock market performance.
Table 9. The result of test validity
Variables
Correlation
Risk perception Investor’s psychology Confidence Performance
Risk perception 1.000 – – –
Investor’s psychology 0.229 1.000 – –
Confidence 0.528 0.518 1.000 –
Performance 0.487 0.404 0.536 1.000
Table 11. The result of hypotheses research
Variable effect Original sample (O) P-value Decision
Stock market confidence → Stock market performance 0.536 0.000 H1 Accepted Investor’s psychology → Stock market confidence 0.419 0.000 H2 Accepted Risk perception → Stock market confidence 0.432 0.000 H3 Accepted
Table 10. Linearity assumpion
Independent variable Dependent variable Result
(
α =
0.05
)
Sig DecisionRisk perception
4.
DISCUSSION
The results show that the risk perception of the stock has a significant positive effect on stock market confidence. It means that the high risk perception in the investment in stocks will fur-ther boost investor’s confidence in investing in the stock market. This study provides the em-pirical evidence that investors in Palembang when trading stocks understand the risks inher-ent to financial investminher-ents. Thus, the finding supports the first hypothesis (H1 is accepted).
On average, investors in Palembang have mode-rate risk characteristics. This type of investors belongs to long-term investors. This type of in-vestors is deemed as rational inin-vestors meaning that the main purpose of the investment is long-term and has a high level of control and the ten-dency of selective observation (Natapura, 2009).
The findings (Takeda et al., 2013) show level lite racy the of investment and individual inves-tor’s overconfidence in Japan with the number of respondents 533 men and women aged above 20 years and as investors showed that the level of literacy of high investment can lower over-confidence. Durand and Sanghani (2008) tested the relation between the level of investor per-sonality that consists of individual extroverted and introverted in Australia. The finding re-veals that individuals who have high emo-tion tend to take high risk or classified as risk taking affecting confidence in the perfor-mance of equi ty portfolios.
Table 11 reveals that investor’s psychology has a signiicant positive efect on the level of
con-idence in the capital market. hese inding demonstrates empirically that investor’s psy-chology is relected in the nature of cognitive, afective and cognative indicators is able to in-crease investor’s conidence in the capital mar-ket. Psychology of investors is important, as it relates to the level of return that will be earned in the future. he indings of this study are in ac-cordance with the theory of individual behavior in the context of the trilogy of mind (Hilgard, 1980; Mayer, 2001) that each behavior in
deci-sion making will be relected in individual’s psy-chology. Decisions under conditions of uncer-tainty or risk discussed in prospect theory that fairy individuals are associated with a range of decisions are clearly irrational (Kirmizi & Agus, 2011; Subekti et al., 2010).
The finding proves that the level of confidence in capital markets has a significant positive ef-fect on the performance of shares purchased by investors. Table 11 shows that coefficient of confidence level is 0.432 with positive direc-tion indicating that investors in Palembang have a good level of confidence in investment in the capital market. The finding supports to the prospect theory (Kahneman & Riepe, 1998; Takeda et al., 2013) that the investor’s profit and loss is based on one specific point that the target return will be obtained. Number of to-tal return in the decision to purchase and sell of shares obtained from periodic increase in dividend payments and capital gain so that the expectations of investors against this type of shares purchased are equal to the expected re-turn. This study also supports a number of pre-vious studies (Chuang, 2004; Seru et al., 2010; Shu et al., 2004).
CONCLUSION AND FUTURE STUDIES
REFERENCES
1. Barber, B. M., & Odean, T. (2008). All hat Glitters : he Efect
of Attention and News on the Buying Behavior of Individual and Institutional Investors Graduate. he Review of Financial Studies, 21(2), 785-818. https://doi. org/10.1093/rfs/hhm079
2. Barber, B. M., & Odean, T. (2001). Boys Will be Boys: Gender, Overconidence, and Common Stock Investment. he Quarterly Journal of Economics, 116(1), 261-292. Retrieved from http://www. jstor.org/stable/2696449
3. Barberis, N., Huang, M., & Santos, T. (1999). Prospect heory and Asset Prices. Cambridge, MA. https://doi.org/10.1017/ CBO9781107415324.004
4. Barberis, N., & haler, R. H. (2002). A Survey of Behav-ioral Finance. SSRN Electrone-search, 15(1), 55-72. Retrieved from http://search.proquest. com/openview/504a51ea3f7b 233cecb020a9b91eb040/1?pq-origsite=gscholar&cbl=54566
5. Chuang, S.-H., (2004). A resource-based perspective on knowledge management capability and competitive advantage: an empirical investigation. Expert Systems with Applications, 27(3), 459-465. https://doi.org/10.1016/j. eswa.2004.05.008
6. Du, D., (2012). Momentum and Behavioral Finance. Managerial Finance, 38(4), 364-379. http://dx.doi.
org/10.1108/03074351211207527
7. Durand, R., & Sanghani, J. (2008). An Intimate Portrait of the Individual Investor. Journal of Behavioral Finance, 9(44), 193-208. http://dx.doi. org/10.1080/15427560802341020
8. Grinblatt, M., & Keloharju, M. (2001). What Makes Investors Trade ? he Journal of Finance, 56(2), 589-616. https://doi. org/10.1111/0022-1082.00338
9. Hilgard, E. R. (1980). he trilogy. Journal of the History of the Behavioral Sciences, 16, 107-117.
https://doi.org/10.1002/1520- 6696(198004)16:2<107::AID-JHBS2300160202>3.0.CO;2-Y
10. Hui, B., & Li, P. (2014). Does Investor Sentiment Predict Stock Returns? he Evidence from Chinese Stock Market. J Syst Sci Complex, 27, 130-143. Retrieved from https://goo.gl/qvqqzs
11. Indonesia Stock Exchange. (2014). Siaran Pers. Retrieved from http:// www.idx.co.id/index.html
12. Kahneman, D., & Riepe, M. W. (1998). Aspects of Investor Psychology. he Journal of Portfolio Management, 24(4), 52-65. https://doi.org/10.3905/ jpm.1998.409643
13. Kartika, N., & Iramani, R. (2013). Pengaruh Overconidence, Experience, Emotion terhadap Risk Perception dan Risk Attitude pada Investor Pasar Modal di Surabaya. Journal of Business and Banking, 3(2), 177-188. https://doi. org/10.14414/jbb.v3i2.235
14. Kirmizi, & Agus, S. S. (2011). Pengaruh Pertumbuhan Modal dan Aset Terhadap Rasio Risk Based Capital (RBC), Pertumbu-han Premi Neto dan Proitabilitas Perusahaan Asuransi. Pekbis Jur-nal, 3(1), 391-405. Retrieved from
https://goo.gl/z4bXBN
15. Kumar, A. (2008). How Do Deci-sion Choices Frames Inluence the Stock Investors ? Investment of Individual. Management Sci-ence, 54(6), 1052-1064. https://doi. org/10.1287/mnsc.1070.0845
16. Linnainmaa, J. T. (2010). Do Limit Orders Alter Inferences about Investor Performance and Behavior ? he Journal of Finance, 65(4), 1473-1506.
https://doi.org/10.1111/j.1540-6261.2010.01576.x
17. Linnenluecke, M. K. et al. (2016). Emerging trends in Asia-Paciic inance research: A review of recent inluential publications and a research agenda. Paciic Basin Finance Journal, 36, 66-76.
http://dx.doi.org/10.1016/j.pac-in.2015.12.002
18. Lucey, B. M. (2005). he Role of Feeling in Investor Decision-Making. Journal of Economic Surveys, 19(2), 212-237. https:// doi.org/10.1111/j.0950-0804.2005.00245.x
19. Maulina, V. (2011). Informasi Asimetri dan Periode Menahan Kepemilikan Saham Biasa di Bursa Efek Indonesia. Retrieved from Program Doktor Ilmu Manajemen Universitas Brawijaya Malang Jawa Timur.
20. Mayer, J. D. (2001). Primary Divisions of Personality and their Scientiic Contributions : From the Trilogy-of-Mind to the Systems Set. Journal of the heory of Social Behaviour, 31(4), 449-476.
https://doi.org/10.1111/1468-5914.00169
21. Natapura, C. (2009). Analisis Perilaku Investor Institusional dengan Pendekatan Analytical Hierarchy Process (AHP), 16, 180-187. Retrieved from http://journal. ui.ac.id/index.php/jbb/article/ viewFile/620/605
22. Odean, T. (2015). Trading Is Hazardous to Your Wealth : he Common Stock Investment Performance of Individual Investors. he Journal of Finance, 55(2), 773-806. https://doi. org/10.1111/0022-1082.00226
23. Qawi, R. B. (2010). Behav-ioral Finance : Is Investor Psyche Driving Market Performance ? he IUP Journal of Behavioral Finance, VII(4), 7-20. Retrieved from http://search.proquest. com/openview/f6e118b15e4c d94d94d69a171ec73b88/1?pq-origsite=gscholar&cbl=54444
24. Salge, T. O., Kohli, R., & Barrett, M. (2015). Investing in Informa-tion Systems: On he Behavioral and Institutional Search Mecha-nisms Underpinning Hospitals’ IS Investment Decisions. MIS Quartely, 39(1), 61-89. Retrieved from http://aisel.aisnet.org/misq/ vol39/iss1/6/
he Review of Financial Stud-ies, 23(2), 705-739. https://doi. org/10.1093/rfs/hhp060
26. Shu, P., Chen, H., & Yeh, Y.-H. (2004). Does Trading Improve Individual Investor Performance ? Review of Quantitative Finance and Accounting, 22, 199-217.
https://doi.org/10.1023/ B:REQU.0000025760.91840.8d
27. Singh, M., Davidson, W. N., & Suchard, J. (2003). Corporate diversiication strategies and capital structure, 43, 147-167.
https://doi.org/10.1016/S1062-9769(02)00124-2
28. Subekti, I., Wijayanti, A., & Akhmad, K. (2010). he Real anc Accruals Earning Management: Satu Perspektif dari Teori Prospek, Simposioum Nasional Akuntansi XIII. Purwokerto.
29. Takeda, K., Takemura, T., & Kozu, T. (2013). Investment Literacy and Individual Investor Biases: Survey Evidence in the Japanese Stock Market. Rev Socionetwork Strat, 7, 31-42. https://doi.org/10.1007/ s12626-012-0031-z
30. Worhington, A. (2006). Whether the Weather. A Comprehensive Assessment of Climate Efect in the Australian Stock Market. Retrieved
from http://ro.uow.edu.au/com-mpapers/186/
31. Wulandari, D. A., & Iramani, R. (2014). Studi Experienced Regret, Risk Tolerance, Overconfidence dan Risk Perception pada Pen-gambilan Keputusan Investasi Dosen Ekonomi. Journal of Busi-ness and Banking, 4(1), 55-66. Retrieved from https://journal. perbanas.ac.id/index.php/jbb/ article/viewFile/293/231