CONFERENCE PAPER
Financial protection in the South-East Asia
region: determinants and policy implications
Working Paper prepared by the WHO Regional Office for South-East Asia
WHO/HIS/HGF/HFWorkingPaper/17.11
© World Health Organization, 2017 All rights reserved.
This is a working paper prepared for the Universal Health Coverage Forum, Tokyo, Japan, 2017. This document may not be reviewed, abstracted, quot-ed, reproducquot-ed, transmittquot-ed, distributquot-ed, translated or adaptquot-ed, in part or in whole, in any form or by any means without the permission of the World Health Organization.
The designations employed and the presentation of the material in this pub-lication do not imply the expression of any opinion whatsoever on the part of the World Health Organization concerning the legal status of any country, territory, city or area or of its authorities, or concerning the delimitation of its frontiers or boundaries. Dotted lines on maps represent approximate border lines, for which there may not yet be full agreement.
The mention of specific companies or of certain manufacturers’ products does not imply that they are endorsed or recommended by the World Health Organization in preference to others of a similar nature that are not men-tioned. Errors and omissions excepted, the names of proprietary products are distinguished by initial capital letters.
All reasonable precautions have been taken by the World Health Organization to verify the information contained in this publication. However, the published material is being distributed without warranty of any kind, either express or implied. The responsibility for the interpretation and use of the material lies with the reader. In no event shall the World Health Organization be liable for damages arising from its use.
Financial protection in the South-East Asia
region: determinants and policy implications
Working Paper prepared by the WHO Regional Office for South-East Asia
CONFERENCE PAPER
1. AN OVERVIEW OF FINANCIAL PROTECTION
IN SOUTH EAST ASIA REGION ...1
2. METHODOLOGY AND LIMITATIONS ... 3
3. RESULTS: A PICTURE OF FINANCIAL PROTECTION IN THE REGION ... 6
4. DISCUSSION ...12
5. CONCLUSIONS ... 16
REFERENCES ...18
CONFERENCE PAPER ACKNOWLEDGEMENTS
The paper was developed by Hui Wang (Health Economist) and Lluis Vinals Torres (Regional Advisor) from Department of Health Systems Development of WHO SEARO, under overall supervision of Dr. Phyllida Travis (Director of HSD Department). Valuable comments have been received from Joseph Kutzin (WHO).
The work has only been possible with the great facilitation of access to and understanding of survey data from all national statistics offices and WHO country offices. Specifically, the team would like to thank:
Cheku Dorji of National Statistics Bureau, Bhutan; Puspa Raj Paudel of Central Bureau of Statistics and Jhabindra Pandey, Health Financing unit, Ministry of Health, Nepal; Kimat Adhikari and Roshan Kumar Karn of WHO country office, Nepal; Elias dos Santos Ferreira, Director General of Statistics and Dr Dolors Castello of WHO country office, Timor-Leste; Priyanka Saksena of WHO country office, India; and Padmal De Silva of WHO country office, Sri Lanka,
We are also grateful to the team led by Dr. Kanjana Tisayaticom of International Health Policy Program (IHPP), who provided data analysis for Thailand. Dr Klara Tisocki (Regional Advisor) of WHO SEARO provided expert knowledge for the discussion section on pharmaceutical policies, and Dr Gabriela Flores Pentzke Saint-Germain from WHO headquarters helped with understanding of the methodology used for global monitoring of UHC.
Last, WHO-SEARO would like to express its gratitude to the Department for International Development (DFID) from the United Kingdom and the European Union-Luxembourg/ WHO UHC Partnership for their financial support.
CONFERENCE PAPER 1. AN OVERVIEW OF FINANCIAL PROTECTION IN SOUTH EAST ASIA REGION
The fundamental goal of a health system is to enhance population health in an equitable and efficient manner. To achieve this goal, policies should be designed to ensure people’s access and use of good quality health services when needed, without suffering from financial hardship. The latter is referred to as the “financial protection” arm of Universal Health Coverage, which is now adopted as part of the Sustainable Development Goals. When households pay directly for the services they use, i.e. out of their pockets (OOP), they are at greater risk of financial hardship. The need to pay high OOPs creates a financial barrier to accessing health services, with a probable greater impact on the poor. This exacerbates inequalities in service use. In most societies, this is deemed unfair as health is generally viewed as a fundamental human right, and access to health care should not be determined merely by income or wealth. The SDG emphasis on ‘leave no-one behind’ reinforces a commitment to greater equity.
High OOPs are undesirable as they undermine both individual and societal welfare, for the following three reasons. First, health needs are highly unpredictable and costs can be prohibitively high. This reinforces the case for pooling of risks and resources at a population level. Second, expenditures on preventing and treating communicable diseases not only benefit the affected individuals, but also society as a whole, making a strong case for subsidies for these diseases with public resources. Last but not least, the information asymmetry problem, where providers have more information about what services are needed than users, is particularly common in healthcare. The reality is that OOPs may not reflect the true value of services received, but instead reflect rent seeking by providers, who may provide unnecessary care (Arrow 1963; Gersovitz M & Hammer JS, 2003).
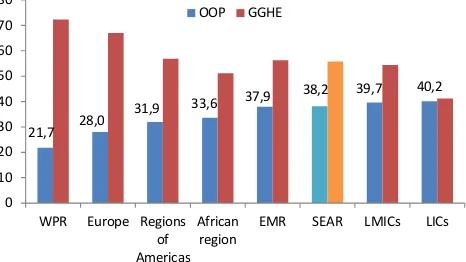
The South East Asia Region (SEAR) continues to have the highest health out-of-pocket share of total health expenditure amongst all WHO regions. On average, 38% of health care is paid directly by households at
1 As in the World Economic Outlook database, accessed on Aug 14, 2017 2 As in the Global Health Expenditure Database, accessed on September 5, 2017
3 This paper still uses Total Health Expenditure, instead of Current Health Expenditure because the data are derived from the Global Health Expenditure Database prior to the updating of the classifications to the new SHA 2011 format.
the time that they use services. Global experience suggests that if more than 30-40 of total health spending is financed through OOP, it is likely that people are not sufficiently protected (WHO 2016). Low public spending on health certainly contributes to this situation. The combination of low government revenues, averaging 23% of the Gross Domestic Product (GDP) of SEAR countries (IMF1 2017) and low
allocation to health, averaging 9% of total government spending (WHO2 2017), results in amongst the lowest
public spending on health observed across all regions. This situation affects the poorest segment of society in particular, preventing many from accessing services due to financial barriers or leading to impoverishment.
Figure 1: Out of pocket and General
Government Health Expenditure, as
share of Total Health Expenditure, 2014
EMRO: Eastern Mediterranean Region; WPRO: West-Pacific Region; LMICs: Lower middle income countries by World Bank standard; LICs: low income countries. All represent unweighted averages.
Source: Global Health Expenditure Database, accessed on Oct 30, 2017.
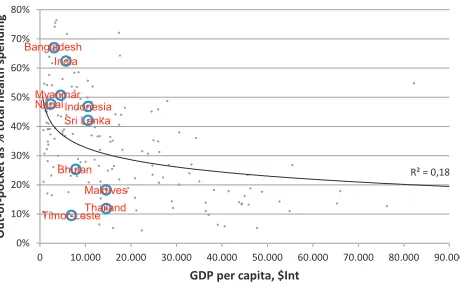
There is a considerable variation across countries in the Region, with OOP share of THE3 varying from
as low as 10% in Timor-Leste to 67% in Bangladesh. While the two upper-middle income countries in the region, Thailand and Maldives, have among the lowest share of OOP, income level is not always a significant predictor of OOP share, as SEAR countries fall both sides of the global regression line (see Figure 2).
1.
An overview
of financial protection
in South East
Asia Region
1: Out of pocket and General Government Health Expenditure, as share of Total Health Expendit
21,7 28,0
31,9 33,6
37,9 38,2 39,7 40,2
0
EMR SEAR LMICs LICs
Figure 2: OOP share of THE varies
across countries and does not always
reflect income level
Source: WHO Global Health Expenditure Database, accessed on November 17th, 2017.
SEAR countries are taking action. Most have embarked on the journey of pursuing UHC through a series of health reforms, with a particular concern for the poor. For instance, India launched a financial protection scheme of the Rashtriya Swasthya Bima Yojana (RSBY) in 2008. This provides insurance coverage for inpatient care for the population below the poverty line (BPL), who, after enrolling with a small registration fee, will then be entitled to a capped payment of 30,000 rupees per family per year. Indonesia introduced a government-financed health insurance program for the poor and near poor (Jamkesmas) in 2005. It later merged the other four parallel insurance programs into a single scheme, Jaminan Kesehatan Nasional (JKN) in 2014, harmonizing the benefits package across different population groups. Thailand introduced the Universal Coverage Scheme (UCS) in soon after the financial crisis in the late 90s, providing comprehensive
coverage of both inpatient and outpatient services for the informal sector population, i.e. people who were not already affiliated to the Social Security Scheme (SSS) for private sector employees or the Civil Servant Medical Benefit Scheme (CSMBS). Maldives initiated the Aasandha Program in 2012, which is funded from general Government revenues, and
immediately guaranteeing universal coverage through a comprehensive benefit package for all citizens. Nepal, which has the lowest per capita income in the Region, also is piloting a national insurance program recently, although the enrollment rate has not yet risen substantially in the first year of implementation.
While these efforts are admirable, health insurance “population coverage” should not be taken as equivalent to UHC. The potential enrolment barriers (financial and non-financial), supply side capacity constraints, as well as insufficiency of fund and their poor management, can all be the bottlenecks to translating entitlements on paper into effective service coverage (World Bank Group, 2015).
Therefore, the monitoring of progress towards financial protection should go beyond a simple documentation of numbers of enrollees of national insurance programs over time, or how citizens’ rights are defined in constitutions. Instead, in order to better assess the actual effect of all the well-intentioned policies, this paper presents empirical evidence from appropriate national household surveys. With the findings, the paper also intends to stimulate discussions on how health policies can be better designed to enhance financial protection of vulnerable populations, which is the stepping stone towards UHC.
The paper is structured in five sections. After this introduction, the second section presents the methodology used in the analysis. The third shows the financial protection situation in seven countries, including presenting the main components of out-of-pocket spending, and equity in financial protection. The fourth section discusses the results and their policy implications. Lastly, the fifth section summarizes the main conclusions and messages of the paper.
0 10.000 20.000 30.000 40.000 50.000 60.000 70.000 80.000 90.000
O
GDP per capita, $Int
CONFERENCE PAPER 2. METHODOLOGY AND LIMITATIONS
2.
Methodology
and
limitations
In the SDG monitoring framework, the incidence of catastrophic expenditure is used to track countries’ progress towards the financial protection dimension of UHC. It is defined as the “proportion of the population with large household expenditures on health as a share of total household expenditure or income”. “Large expenditures” are defined as health payments exceeding either 10% or 25% total household consumptions.
In addition to using total household expenditure or income as the denominator, there is an argument that the amount of spending on daily necessities should be deducted to reflect a more realistic “capacity of households to pay for healthcare”. It is assumed, therefore, that the poor spend more on their basic necessities, leaving even smaller room for other consumptions. There are many approaches to defining what counts as “necessities” (WHO and the World Bank, 2017), one of them being a standard amount representing subsistence level of food expenditure. This paper also follows this widely adopted approach (Ke et al, 2003).
In the worst scenarios, large health payments may result in impoverishment, meaning that health expenditures push people below poverty lines. Poverty lines usually reflect a valuation of what constitutes basic needs of a household, which understandably vary across countries. For global comparison purposes, absolute poverty lines (in international dollars) are generally used, currently set at $1.9 and $3.1 per day per capita (2011 purchasing power parities, PPPs). Some people might have high levels of per capita spending, including health expenditure, and remain above the poverty line. However, when health expenditures are deducted, per capita spending on necessities such as food, clothing and housing might fall below minimum living standards. Therefore, the difference between these two, the gross and net (excluding health payment) of daily per capita spending can reveal the extent to which health payments exacerbate poverty. The effect can be expressed both as an increase in incidence of poverty when comparing the changes in headcount ratio, and an increase in the severity
of poverty when comparing the changes in poverty gap ratio (O’Donnell, O. et al, 2008). For purpose of simplicity, only the increased incidence is presented in this paper.
The two concepts of catastrophic spending and impoverishment capture two different aspects of financial protection. For instance, well-off households may spend a higher percent of their resources on healthcare, resulting in a higher incidence of “catastrophic” health expenditure. However, this higher share being spent on healthcare might not necessarily bring a higher financial hardship to them than a lower share for poor households. By contrast, for those who live near the poverty line, a small amount of health OOP is sufficient to impoverish them. They may not be classified as having
“catastrophic” health expenditure, but they are also suffering from lack of financial protection. Therefore, an approach that combines both concepts can better capture the financial burden of OOP. This is especially meaningful for policy purposes as the impact on the most economically disadvantaged groups can be better quantified. A new analysis combining both measures will be published in a subsequent paper.
Both catastrophic health expenditure and impoverishment have limitations, and neither can measure everything of interest. For instance, they do not capture cases of foregone care, which particularly concerns the poor; they also cannot differentiate the healthcare utilization by illness (such as chronic conditions); by using total household consumptions as denominator, they also fail to adjust for capacity to pay; furthermore, they do not capture relevant indirect costs of illness, such as income loss due to disability, and in general lack the ability to evaluate the effects of coping strategy households use to finance their healthcare on their general welfare (such as using debt or credit financing to pay for healthcare).
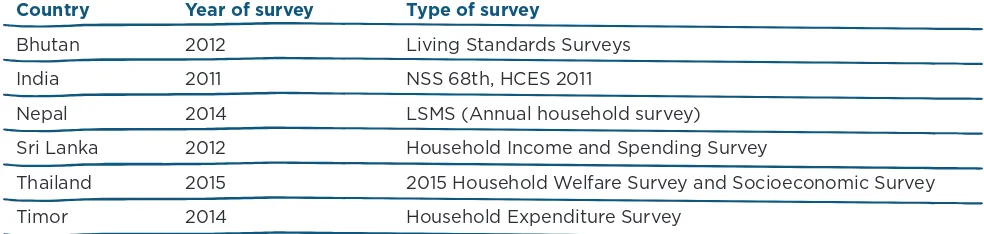
It is important to note that for India, the Household Consumption and Expenditure Survey of 2011 is used, corresponding to 68th round of National Sample Survey round, instead of the most recent survey of 2014, because the former has a more balanced capture of health and other household expenditures. For Thailand, data come from the annual Socioeconomic Survey (SES) and Household Welfare Survey (HWS).
Throughout the analysis, population weights, or household weights adjusted by household size, are used to produce all estimates, except for Thailand, where household weight has been used.
Care needs to be taken with cross-country
comparisons, since the designs of the surveys differ in many ways. First, many have a double counting issue, asking for documentation of OOP both in health-specific module and non-food expenditure module, and the estimates might not match. To address it, scenarios using different combinations of information have been used to test robustness, but inevitably a subjective decision has to be made in the end.
Second, the questions on OOP components in dif-ferent surveys may not follow the same structure. For instance, countries have seen a huge variation in types of questions being asked for household health consumptions. Therefore, in some countries
module in the questionnaires asked about expenses on Rimdo/puja, or religious treatment, which might not be related exclusively to health, and is generally not considered as “health services”. For Sri Lanka, the questionnaire asks about expenditures of both the “main” households and servants living with the families. While the health expenditures for the former are grouped by different categories, there is no such level of detail for the latter. Therefore it is assumed that the distribution is the same for both groups, which is unlikely to be true, but is reasonable given its marginal magnitude.
Third, while the majority of countries use a mix of recall periods, Nepal’s survey follows a recall period of 12 months. The bias introduced by a long recall period is already well known (Das et al, 2012).
Last but not least, surveys vary in level of details for other expenditures. Since the poor may have a larger proportion of expenditure on food than other categories, an overestimate of other nonfood expenditures may have a potential impact on the calculation of denominator, thus affecting the equity implication of both financial protection indicators. The extent of accuracy in calculating the non-health expenditures also have an impact.
Given these limitations, direct cross-country comparison should be taken with caution. In the future, it would perhaps be more meaningful for
Country Year of survey Type of survey
Bhutan 2012 Living Standards Surveys
India 2011 NSS 68th, HCES 2011
Nepal 2014 LSMS (Annual household survey)
Sri Lanka 2012 Household Income and Spending Survey
Thailand 2015 2015 Household Welfare Survey and Socioeconomic Survey
Timor 2014 Household Expenditure Survey
3.
Results:
a picture of
financial
protection
in the Region
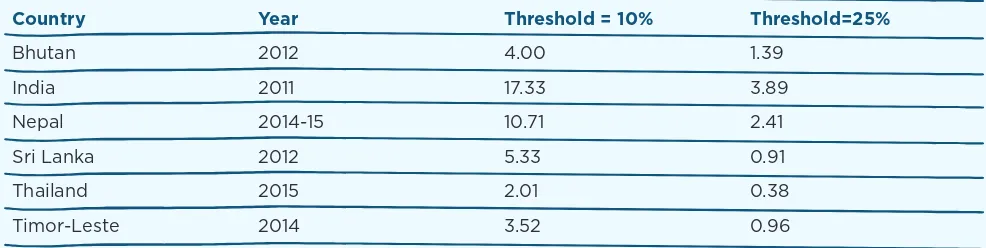
Incidence of catastrophic expenditures
Table 2 below presents the incidence of catastrophic health expenditure based on the SDG3.8.2 target, using the two different thresholds (10% and 25% of total household expenditure). India (at 17%) and Nepal (11%) have the highest share of the population spending more than 10% of all households’ resources on healthcare. Thailand (2%) and Timor-Leste (3.5%) have the lowest. When the 25% threshold is used, India and Thailand still have the highest and lowest catastrophic incidence.In absolute numbers, across the seven countries, 221.7 million people suffer from catastrophic expenditure for the 10% threshold and 49.7 million for the 25% threshold. Not surprisingly, India, with the largest population, has the highest number of people affected.
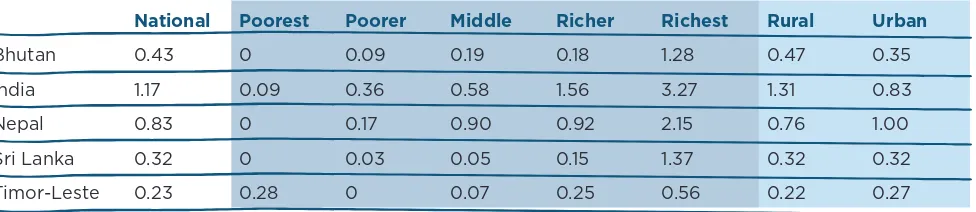
The incidence of catastrophic spending varies by consumption and expenditure quintiles. Figure 3
by total consumption or expenditures quintiles. The finding that poorer households have a lower face-value catastrophic incidence is consistent with studies globally, and hints at an affordability issue for the poor (WHO and World Bank Group 2015.). Figure 4 shows the incidence of catastrophic expenditures by urban-rural areas. In Bhutan and India, the incidence in rural areas is higher than in urban areas, which may also suggest a mixture of inequality in both financial protection and access to health services.
As mentioned earlier, there is a third way of calculating catastrophic spending, which is based on the capacity to pay approach and using a 40% threshold. Table 3 shows incidence of catastrophic expenditure following this approach. It is clear that very few people in the six countries spend more than 40% of their non-subsistence spending on health. The data show that the richest quintile is more likely to spend a bigger share of their budget on health.
Country Year Threshold = 10% Threshold=25%
Bhutan 2012 4.00 1.39
India 2011 17.33 3.89
Nepal 2014-15 10.71 2.41
Sri Lanka 2012 5.33 0.91
Thailand 2015 2.01 0.38
Timor-Leste 2014 3.52 0.96
CONFERENCE PAPER
7
3. RESULTS: A PICTURE OF FINANCIAL PROTECTION IN THE REGION
National Poorest Poorer Middle Richer Richest Rural Urban
Bhutan 0.43 0 0.09 0.19 0.18 1.28 0.47 0.35
India 1.17 0.09 0.36 0.58 1.56 3.27 1.31 0.83
Nepal 0.83 0 0.17 0.90 0.92 2.15 0.76 1.00
Sri Lanka 0.32 0 0.03 0.05 0.15 1.37 0.32 0.32
Timor-Leste 0.23 0.28 0 0.07 0.25 0.56 0.22 0.27
Table 3: Incidence of catastrophic expenditure (%), using capacity to pay approach
with 40% threshold
Figure 3: Incidence of Catastrophic expenditure, by expenditure/consumption
quintile (and total expenditure as denominator)
Threshold=10%
al est Poorer
0.09 0.36 0.17 0.03 0
Threshold =25%
al est rer e er est ral rban
35 83 00 32
Threshold=10% Threshold=25%
Figure 4: Incidence of Catastrophic expenditure, by geographical area
Threshold=10% Threshold=25%
al est Poorer
0.09 0.36 0.17 0.03 0
Threshold=25%
al est rer e er est ral rban
Impoverishment
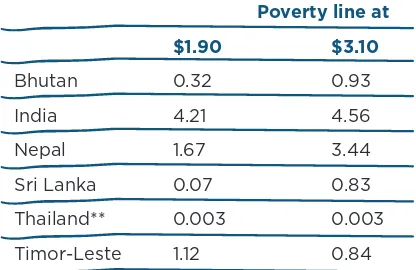
As mentioned earlier, the concept of incidence of catastrophic expenditure does not adequately capture households close to the poverty line. Table 4 shows the impoverishing effect of health spending expressed as the share of the population affected. India (4.2%) and Nepal (1.7%) have the highest share of the population being pushed under the extreme poverty line of PPP$ 1.90 per capita per day, corresponding to 52.5 million and 472,490 people, respectively. Thailand and Sri Lanka, on the other hand, have the fewest people being pushed under the poverty line of PPP$1.90.
When PPP$3.10 is used as the poverty line, the
impoverishing effect is still most acutely experienced in India and Nepal, being 4.6% and 3.4%, corresponding to 56.9 million and 974,829 people, respectively. Thailand, Sri Lanka and Timor-Leste have seen the lowest impoverishing effect.
Table 5 presents the impoverishing effect by consumption quintiles. The value of zero in many poor quintiles is because people are classified as poor already. Any OOP will only further their financial hardship. When including this consideration, the impoverishing effect clearly shows that the poorer suffer much more than their richer counterparts.
From results in Panel A, it is clear that the bottom 40% by expenditure are vulnerable to being impoverished using the PPP$1.90 poverty line, or further
impoverished in India and Timor-Leste, and the bottom 20% are vulnerable in Nepal. Similarly, the bottom 60% are vulnerable of being impoverished using the PPP$3.10 poverty line, or further impoverished in India and Timor-Leste, and the bottom 40% are vulnerable in Nepal.
Poverty line at
$1.90 $3.10
Bhutan 0.32 0.93
India 4.21 4.56
Nepal 1.67 3.44
Sri Lanka 0.07 0.83
Thailand** 0.003 0.003
Timor-Leste 1.12 0.84
*PPP exchange rates based on World Development Indicators, accessed on February 2017 **PL=$1 per capita per day and $2 per capita per day
CONFERENCE PAPER 3. RESULTS: A PICTURE OF FINANCIAL PROTECTION IN THE REGION
Panel A. PL=$1.90
Poorest Poorer Middle Richer Richest
Bhutan 1.31 0.28 0 0 0
India 0 17.61 2.49 0.67 0.25
Nepal 6.90 0.97 0.46 0 0
Sri Lanka 0.34 0 0 0 0
Timor-Leste 0 0 5.28 0.22 0.10
Panel B. PL=$3.10
Poorest Poorer Middle Richer Richest
Bhutan 0 3.28 1.16 0.13 0.07
India 0 0 0 21.11 1.71
Nepal 0 0 15.50 1.51 0.21
Sri Lanka 3.86 0.26 0 0 0.04
Timor-Leste 0 0 0 3.53 0.68
*Thailand data are omitted here as the values are very close to zero for all quintiles under the two international poverty lines.
Table 5: Percentage of population being pushed under two international poverty
lines due to OOP (2011 PPP international dollar*), by expenditure/consumption
quintile
Threshold = 10% Threshold=25%
Rural Urban Rural Urban
Bhutan 0.43 0.06 1.18 0.36
India 5.24 1.61 4.86 3.83
Nepal 1.98 0.94 3.79 2.64
Sri Lanka 0.08 0 0.97 0.19
Timor-Leste 0.95 1.56 0.51 1.69
Table 8 shows all OOP components, by economic quintiles and by region. Apart from the expenditure on medicine, other significant OOP components include 1) in Sri Lanka, more than 40% of OOP has been paid as fees to private medical practitioners, especially in urban areas; 2) in Thailand, the largest share of OOP is spent on inpatient care, and the trend is only reversed among the poor households.
when necessary. According to Demographic Health Surveys, as many as 55% of women aged 15-49 in Nepal, 15% in Indonesia, 17% in India and 14% of Bangladesh reported having “problems in accessing health care due to cost of treatment”. Differences in service utilization by socio-economic quintiles further suggest that not accessing services due to financial barriers affects particularly the poorest segments of societies (WHO-SEARO, 2009). A successful journey the rural population suffers most from OOP induced
impoverishment, no matter which international poverty line is used. Again the effect is largest in India and Nepal. When using PPP$1.90 as poverty line, 5.2% and 1.6% of rural and urban population in India are newly classified as poor due to OOP. In the case of Nepal, 2.0% of rural and 1% urban population are newly classified as poor due to OOP. When using PPP$3.10 as poverty line, the incidence of impoverishing health spending in India changes to 4.9% and 3.8%, in rural and urban areas respectively, and the numbers in Nepal increase to 3.8% and 2.6%, respectively.
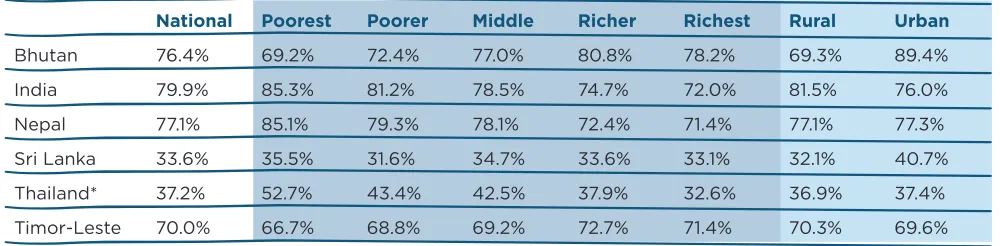
Components and main drivers of OOP
Medicine expenditure is the dominant component of OOP in many countries, as shown in Table 7: In Bhutan, the spending on medicines and other health commodities during inpatient and outpatient care, as well as spending on commodities such as vaccines, constitutes 76.4% of total OOP. In India, 80% of OOPof OOP is spent on medicine. In Nepal, 77.1% of OOP is spent on medicines purchased in country, with another 1.5% spent on medicines during overseas healthcare. In Sri Lanka, the medicine expenditure share of OOP is likely to be underestimated, because in addition to the option of “purchase of medical and pharmaceutical products”, there are another two options in the questionnaire, namely “Fees to private medical practitioners (included costs of medicine)” and “Ayurveda consultation fees (included costs of medicine)”, from which the medicine part cannot be separated.
Apart from Bhutan and Timor-Leste, the poorer households spend proportionally more on medicines than their richer counterparts in other countries. This is perhaps most prominent in Thailand, where on average the biggest component of OOP is hospital inpatient care (see Table 7 below), having medicines being the biggest financial burden for the poor.
National Poorest Poorer Middle Richer Richest Rural Urban
Bhutan 76.4% 69.2% 72.4% 77.0% 80.8% 78.2% 69.3% 89.4%
India 79.9% 85.3% 81.2% 78.5% 74.7% 72.0% 81.5% 76.0%
Nepal 77.1% 85.1% 79.3% 78.1% 72.4% 71.4% 77.1% 77.3%
Sri Lanka 33.6% 35.5% 31.6% 34.7% 33.6% 33.1% 32.1% 40.7%
Thailand* 37.2% 52.7% 43.4% 42.5% 37.9% 32.6% 36.9% 37.4%
Timor-Leste 70.0% 66.7% 68.8% 69.2% 72.7% 71.4% 70.3% 69.6%
*Estimated as an average of rural and urban results
CONFERENCE PAPER 3. RESULTS: A PICTURE OF FINANCIAL PROTECTION IN THE REGION
Poorest Poorer Middle Richer Richest Rural Urban National Bhutan
Hospital care 0.1 0.6 2.7 1.3 4.2 1.8 2.7 2.1
Medicine 69.2 72.4 77.0 80.8 78.2 69.3 89.4 76.4
Traditional care 18.3 11.2 11.9 10.9 10.9 15.9 5.1 12.1
Other 12.4 15.8 8.4 7.0 6.7 13.0 2.8 9.4
India
Medicine 85.3 81.2 78.5 74.7 72.0 81.5 76.0 79.9
Diagnostic tests 1.4 2.2 3.4 4.1 5.2 2.6 3.4 2.8
Doctor fees 8.2 10.2 12.0 13.0 13.7 9.8 13.1 10.7
Nursing home/family planning devices 1.7 2.7 3.1 4.6 5.1 2.6 4.1 3.0
Other 3.4 3.6 3.1 3.6 3.9 3.5 3.4 3.5
Nepal
Inpatient 7.8 10.5 9.6 13.1 11.4 11.8 7.6 10.5
Outpatient 7.0 9.9 12.2 14.2 17.0 10.9 14.9 12.1
Medicine 85.1 79.3 78.1 72.4 71.4 77.1 77.3 77.1
Overseas 0.0 0.2 0.1 0.3 0.2 0.2 0.3 0.2
Sri Lanka
Fees to private medical practitioners (included costs of medicine)
53.2 57.0 58.1 54.6 52.8 46.6 55.3 43.5
Ayurveda (included costs of medicine) 1.6 1.4 1.7 1.6 1.6 1.8 1.7 1.5
Consultation fees to specialist 3.0 0.9 1.6 2.3 3.2 5.7 2.9 3.5
Diagnostic tests 4.8 2.0 3.9 4.0 5.7 7.0 4.6 5.9
Payment to private hospitals and nursing home
2.5 2.4 2.5 1.9 1.6 3.8 2.3 3.5
Purchase of medical and pharmaceutical products
33.6 35.5 31.6 34.7 33.6 33.1 32.1 40.7
Spectacles and Hearing aids 0.5 0.2 0.1 0.3 0.5 1.0 0.4 0.6
Other 0.8 0.6 0.6 0.6 1.0 1.1 0.8 0.8
Timor-Leste
Inpatient 5.8 3.7 5.9 6.3 8.8 6.0 6.9 6.4
Outpatient (excluding medicine) 27.6 27.5 24.9 21.0 19.8 23.7 23.5 23.6
Medicine (also including outpatient medicine) 66.7 68.8 69.2 72.7 71.4 70.3 69.6 70.0
Thailand*
Medicine 52.7 43.4 42.5 37.9 32.6 36.9 37.4 37.2
Inpatient care 33.0 42.1 40.1 47.6 47.8 44.4 45.9 45.1
Outpatient 14.3 14.5 17.5 14.5 19.6 18.6 16.7 17.7
*National averages are estimates.
Issues of financial access and impoverishment may take various forms, including small amounts to be paid during a long period and financial shocks due to expensive specialized acute care. Medicines, as shown by data above, belong to the first type. The discussion hereafter will focus on how the medicines challenge is being addressed, leaving the issues related accessing acute, specialized, hospital care, for a future analysis.
Tackling OOP on medicines: the missed target?
High out-of-pocket spending, mainly led by household spending onpharmaceuticals, is pushing millions into poverty and/or representing financial hardship to them. This is not exclusive to South East Asian countries. Countries such as The Philippines, Georgia and Brazil present a similar situation (Bredenkamp et al 2013; Zoidze et al 2013; Vera Lucia et al. 2016).
Government efforts in tackling financial protection include actions such as increasing budget allocations for health, creating social protection schemes or negotiating prices down to improve affordability of services and medicines. However, trends to date suggest that they are either insufficient or not yet
meeting their goals. In general though, these policies have not been systematically evaluated and only partial non comprehensive analysis exists.
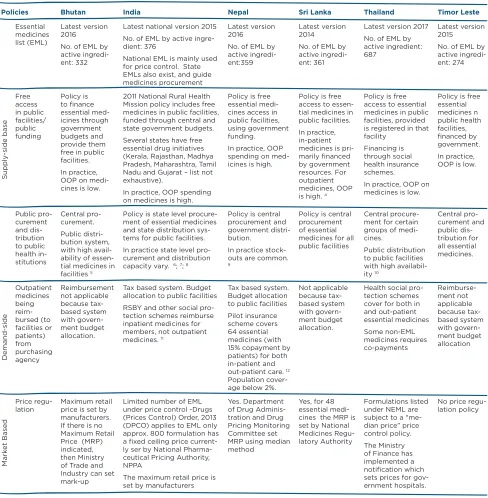
It is not an entirely new finding that medicines are the highest component of OOP in many countries. For instance, purchase of drugs was found to constitute 70% of the total OOP expenditure in India in 2008 (Garg et al, 2009). The persistence of high OOP on medicines demonstrates that policy efforts so far have not reduced the problem. Table 9 below briefly summarizes a series of interventions (not meant to be exhaustive) being tried by SEAR Member States to tackle the challenges of access to medicines over the past few years.
CONFERENCE PAPER 4. DISCUSSION
policies relies on the smoothness of the reimbursement mechanisms.
Substantial transaction costs with a lengthy claims procedure can jeopardize them. Lastly, market based solutions involve price regulation to increase affordability of medicines. Still, the policy might not provide enough financial protection for the poor, who may still find the regulated prices prohibitively high (Cameron et al, 2011). Obviously, a combination of the three types of policies is more likely to succeed than any intervention being implemented alone.
There are preconditions for these policies to be successful. The fiscal space of the government, and in particular the share they can allocate to medicines, immediately matters. Public spending on medicines in SEAR is extremely low, in both absolute and relatives terms (WHO-SEARO, 2017). Public spending on medicines is above half of total spending only in Bhutan, Timor Leste and Thailand. In Myanmar, India and Nepal, public spending on medicines does not reach 10% of total medicines spending.
The situation for the poor is particularly worrying. They suffer from both foregone care and further impoverishment due to health care. Existing policies do not seem to work particularly well for them. While increased drugs availability in public facilities could help, patterns of care seeking by the poorest families suggest they are not benefitting the most (Rahman et al, 2014). Medicines in most south-Asian countries are cheap when compared with international peers (Cameron et al 2009). However, even those cheap drugs may be unaffordable to individuals, thus deterring treatment and leading to impoverishment, for the poorest groups of society. Some social health protection schemes, such RSBY in India, target specifically people below poverty lines but include only hospital based services (Chowdury et al 2016) hence not tackling where the main problem is, i.e. outpatient medicines.
Enhancing financial protection: more strategic
purchasing is needed
Over the past decades, many countries have developed programs, mostly vertical, to tackle communicable diseases, such as TB, malaria, and vaccine-preventable diseases. These efforts have seen great success in expanding free access to medicines to almost everyone, and have largely been credited for the fast increase in life expectancies. However, with the demographic and epidemic transitions being experienced in developing countries in a much shorter period of time than in developed ones, policy makers confront a huge challenge in dealing with this dual burden. Noncommunicable diseases are different in nature from infectious disease. They have more subtle and gradual onset, with a lengthy and indefinite duration, and usually not curable and in need of long-term care. Without effective and sufficient response from existing health systems, NCDs are already threatening the households’ finances, particularly those of the poor. Evidence from India and the Philippines shows that NCDs are significantly associated with high OOP expenditures (Indrani et al, 2016) and catastrophic health expenditure (Cavalles, 2014). When considering addressing this problem, health authorities will need to weigh the financial and political factors for a feasible priority setting. Apart from the criteria mentioned earlier, other factors may also be considered, including voices from citizens and professionals, system affordability, ethical concerns and equity.
The second question policy makers need to ask is how health providers should be paid in order to improve users’ financial protection. Relying on a payment system mostly based on fee-for-service mechanisms, can leave room for health providers to deliver more services than needed, resulting in cost escalation and exposing patients to financial hardship, without bringing in health benefits. This situation has already been reported in several countries (e.g. Li et al, 2012, Bredenkamp et al. 2014). The use of more proactive payment methods, like in Thailand, where per capita, case-payments with overall budget cap and extra incentives are combined, is a good example of how extra resources can be translated into more financial protection for users.
Last but not least, policy makers need to decide who to work with to provide health services. In countries with large private sector, increasing effective access and ensuring financial protection may require engaging with it. In SEA region, private practice is quite prevalent. In India 70% of diseases episodes were treated in the private sector, consisting of private doctors, nursing homes, private hospitals and charitable institutions (NSSO, 2015). Harnessing the potential of the private sector faces
challenges of its own. The level of knowledge of quantity and quality of care provided is often rather weak. Also, governments seem not having/using the right instruments to regulate it. Engaging thus with the private sector may certainly require building up first governments capacity to regulate and perhaps contract.
CONFERENCE PAPER 4. DISCUSSION
Policies Bhutan India Nepal Sri Lanka Thailand Timor Leste
Supply
Latest national version 2015
No. of EML by active ingre-dient: 376
National EML is mainly used for price control. State EMLs also exist, and guide medicines procurement free in public facilities.
In practice, OOP on medi-cines is low.
2011 National Rural Health Mission policy includes free medicines in public facilities, funded through central and state government budgets.
Several states have free essential drug initiatives (Kerala, Rajasthan, Madhya Pradesh, Maharashtra, Tamil Nadu and Gujarat – list not exhaustive).
In practice, OOP spending on medicines is high.
Policy is free essential medi-cines access in public facilities, using government funding.
In practice, OOP spending on med-icines is high.
Policy is free access to essen-tial medicines in public facilities.
Policy is free access to essential medicines in public facilities, provided is registered in that facility
Financing is through social health insurance schemes.
In practice, OOP on medicines is low.
Policy is free essential tial medicines in facilities 5
Policy is state level procure-ment of essential medicines and state distribution sys-tems for public facilities.
In practice state level pro-curement and distribution capacity vary. 6; 7; 8
Policy is central procurement and government distri-bution.
In practice stock-outs are common.
9
Policy is central procurement of essential medicines for all public facilities
Central procure-ment for certain groups of medi-cines.
Public distribution to public facilities with high
availabil-Tax based system. Budget allocation to public facilities
RSBY and other social pro-tection schemes reimburse inpatient medicines for members, not outpatient medicines. 11
Tax based system. Budget allocation 15% copayment by patients) for both in-patient and out-patient care. 12
Population cover-Industry can set mark-up
Limited number of EML under price control -Drugs (Prices Control) Order, 2013 (DPCO) applies to EML only approx. 800 formulation has a fixed ceiling price current-ly ser by National Pharma-ceutical Pricing Authority, NPPA
The maximum retail price is set by manufacturers
Yes. Department of Drug Adminis-tration and Drug Pricing Monitoring Committee set MRP using median method
Yes, for 48 essential medi-cines the MRP is set by National Medicines Regu-latory Authority
Formulations listed under NEML are subject to a “me-dian price” price control policy.
The Ministry of Finance has implemented a notification which sets prices for gov-ernment hospitals.
No price regu-lation policy
4 Institute for Health Policy: Sri Lanka Health Accounts: National Health Expenditure 1990–2014 ; 2015 http://www.ihp.lk/publications/docs/HES1504.pdf
5 Medicines in health care delivery in Bhutan - Situational Analysis: 20 July -31 July 2015, WHO SEARO http://www.searo.who.int/entity/medicines /bhutan_situational_analysis_
oct15.pdf?ua=1
6 Maiti R et al Essential Medicines: An Indian Perspective Indian J Community Med. 2015 Oct-Dec;40(4):223-32;
7 Prinja S. et al Availability of medicines in public sector health facilities of two North Indian States, BMC Pharmacol Toxicol. 2015 Dec 23;16:43. 8 Singh PV et al Understanding public drug procurement in India: a comparative qualitative study of five Indian states. BMJ Open. 2013 Feb 5;3(2). 9 Medicines in health care delivery in Nepal - Situational Analysis, 2015 http://www.searo.who.int/entity/medicines/nepal2014.pdf
10 Medicines in health care delivery in Thailand - Situational Analysis, 2016 http://www.searo.who.int/entity/medicines/thailand_situational_assessment.pdf?ua=1 11 Health Insurance Expenditures in India (2013-14), November 2016 https://mohfw.gov.in/sites/default/files/6691590451489562855.pdf
5.
Conclusions
Policy makers are aware of the challenge of improving financial protection in South-East Asian countries, as out-of-pocket expenditure on health have been continuously high over the past decades. This paper presents the latest evidence in seven countries of how serious the issue is, summarized in two widely used financial protection indicators of incidence of catastrophic of expenditure and impoverishing effect. As expected, countries’ experiences vary to a large extent.
Globally, the median incidence of catastrophic spending in 2010 is 7.1% using the 10% threshold, and 1% using the 25% threshold. Two countries of this study – India and Nepal - have incidence rates higher than the global median for both thresholds. Three other countries – Bhutan, Sri Lanka and Timor-Leste – have incidence rates near the global median for the 25% threshold. When capacity to pay is used as the denominator, catastrophic payments in all countries appears to compare favorably to global median of 1.0%, except in India (WHO and the World Bank, 2017). However, this may simply reflect lower levels of service use, particularly for the poor, in many countries, where people have little budget left for healthcare after meeting their daily consumption needs (the issue of foregone care, referred to earlier in the paper). Regardless of the definition and
thresholds used, the incidence rates are in general higher among rural populations, which is likely a result of both financial and geographic barriers to healthcare.
Global median rates of impoverishment are 1.86% using the extreme poverty line ($1.90), and 2.44% using the poverty line ($3.10). India and Nepal have the highest proportion of people being impoverished as a result of health spending. Data also show clearly that the poorer households suffer more than their richer counterparts.
Medicines are the biggest component of OOP expenditures in India, Nepal, Bhutan and Timor-Leste. In Sri Lanka, medicine expenditure is the second biggest component of OOP, following OOP payments to private medical practitioners. Low public spending on medicines plus absence or weakly performing policies partially explain the lack of financial protection against OOP payment on medicines.
CONFERENCE PAPER 5. CONCLUSIONS
and purchase quality services strategically, with farsighted planning and stepwise reform efforts to address both service coverage and financial protection issues
There are examples of countries, including Thailand in SEAR, which have gradually expanded financial protection maintained it sustainably, from which other countries may take useful lessons.
References
Amiresmaili, A. (2012) Iranian Household Financial Protection against Catastrophic Health Care Expenditures, Iranian Journal Public Health, Vol. 41, No.9, Sep 2012, pp. 62-70
Arrow, K. (1963). “Uncertainty and the Welfare Economics of Medical Care.” American Economic Review 53 (5): 941–73.
Bredenkamp, C. and Leander, R. B. (2013) Financial protection from health spending in the
Philippines: policies and progress, Health Policy and Planning, Volume 31, Issue 7, 1 September 2016, Pages 919–927
Cameron A, Ewen M, Auton M, Abegunde D. (2011) The World Medicines Situation 2011 —Medicines Prices, Availability and Affordability, Geneva, World Health Organization http://www.who. int/medicines/areas/policy/world_medicines_ situation/WMS_ch6_wPricing_v6.pdf ; (see Fig 1.4))
Cameron, A. Ewen, M. Ross-Degnan, D. Ball, D. Laing, R. (2009) Medicine prices, availability, and affordability in 36 developing and middle-income countries: a secondary analysis , Lancet Volume 373, No. 9659, p240–249
Cavalles, Alvin (2014) Analysis of Catastrophic Health Financing by Key Institutions, Discussion Paper 2014-51, Philippine Institute for Development Studies
Chowdhury Samik, Gupta Indrani, Prinja Shankar, Trivedi Mayur (2016) Out-patient expenditure in out-of-pocket spending in India: assessment and options based on results from a district level survey, Institute of Economic Growth, pp 1-12, Delhi, India
Das, J., J. Hammer, and C. Sanchez-Paramo. 2012. “The Impact of Recall Periods on Reported Morbidity and Health Seeking Behavior.” Journal of Development Economics 98 (1): 76–88.
Garg, Charu. Karan, Anup K. (2009) Reducing out-of-pocket expenditures to reduce poverty: a disaggregated analysis at rural-urban and state level in India, Health Policy and Planning 2009; 2009, 24: 116-128
Gersovitz, M; Hammer, JS.. 2003. „Infectious diseases, public policy, and the marriage of economics and epidemiology“. The World Bank research observer. -- Vol. 18, no. 2 (Fall 2003), pp. 129-157.
CONFERENCE PAPER REFERENCES
National Sample Survey Office – Ministry of Statistic and Programme Implementation (2016) Health in India – NSS 71st Round – January – June 2014, http://mospi.nic.in/sites/default/files/ publication_reports/nss_rep574.pdf, Delhi
O’Donnell, O., E. van Doorslaer, A. Wagstaff, and M. Lindelow. 2008. Analyzing Health Equity Using Household Surveys: A Guide to Techniques and Their Implementation. Washington, DC: World Bank
Rahman MM, Karan A, Rahman MS, Parsons A, Abe SK, Bilano V, Awan R, Gilmour S, Shibuya K (2014) Progress Toward Universal Health Coverage: A Comparative Analysis in 5 South Asian Countries., ; Int J Health Policy Manag. 2014 Jan 6;2(1):29-38. doi: 10.15171/ ijhpm.2014.06
Saito, Eiko; Gilmour, Stuart; Rahman, Md Mizanur; Gautam, Ghan Shyam; Khrihna Shrestha, Pradeep & Shibuya, Kenji (2014) Catastrophic household expenditure on health in Nepal: a cross-sectional survey, Bull World Health Organ 2014;92:760–767 | doi: http://dx.doi. org/10.2471/BLT.13.126615
Vera-Lucia, Luiza; Urruth Leão Tavares, Noemia; Oliveira, Maria Auxiliadora; Dourado Arrais, Paulo Sergio; Ramos, Luiz Roberto; Dal Pizzo, Tatiane da Silva; Serrate Mengue, Sotero; Rocha Farias, Mareni; Dâmaso Bertoldi, Andrea (2016) Catastrophic expenditure on medicines in Brazil, Revista de Saude Publica; 2016;50(suppl 2):15s
WHO-SEARO (2017) Improving access to medicines in the South-East Asia Region – Progress, Challenges, Priorities
WHO (2016). Health financing country diagnostic: a foundation for national strategy development
WHO-SEARO (2009) Health inequities in South-East Asia Region: Selected country case studies, http://apps.who.int/iris/ bitstream/10665/205241/1/B4288.pdf
WHO and World Bank Group (2015) Tracking Universal Health Coverage. First Global Monitoring Report
WHO and the World Bank (2017). Tracking Universal Health Coverage: 2017 global monitoring report
World Bank Group (2015). Going Universal: How 24 Developing Countries Are Implementing Universal Health Coverage Reforms from the Bottom Up. Washington D.C. United States.
Xu Ke, David B Evans, Kei Kawabata, Riadh Zeramdini, Jan Klavus, Christopher J L Murray (2003) Household catastrophic health expenditure: a multicountry analysis, The Lancet Volume 362, Issue 9378, 12 July 2003, Pages 111-117