Simulating the radiation distribution within a barley-straw mulch
Michael D. Novak
a,∗, Wenjun Chen
b, Mohammad A. Hares
caFaculty of Agricultural Sciences, University of British Columbia, 266B-2357 Main Mall, Vancouver, BC, Canada V6T 1Z4 bEnvironmental Monitoring Section, Canada Centre for Remote Sensing, 588 Booth St., Ottawa, Ont., Canada K1A 0Y7
c60 Provender Avenue, Ottawa, Ont., Canada K1K 4N4
Received 26 July 1999; received in revised form 23 November 1999; accepted 22 December 1999
Abstract
Mulching is a technique widely used to moderate soil microclimate. Modelling radiation transfer within mulches is a critical step in the development of comprehensive microclimate models of the soil–mulch–atmosphere system and similar hay-drying systems. The objective of this research was to develop a relatively simple physically-based model that predicts profiles of shortwave and longwave radiation flux densities within barley-straw mulches and to test it against hourly radiation flux measurements made above and below mulches applied at rates of 2, 5, 10, and 15 t ha−1in successive field-plot experiments.
Unique features of the model include accounting for upper-surface and lower-surface mulch element temperatures using effective view factors and neglecting all shortwave reflections beyond secondary ones, so that calculation of the fluxes above any layer is explicit and does not require matrix inversion. Model input parameters were for the most part measured completely independently of the field tests. Measured transmissivities demonstrated that mulch elements were uniformly distributed, as expected, for low mulch application rates but were clumped for higher rates, which was attributed to the greater effort then needed to separate the elements of baled straw. Sensitivity tests showed that solar irradiance, atmospheric emissivity, and mulch element reflectivity are important input parameters to the model and that measuring the difference between upper-surface and lower-surface mulch element temperatures is not as critical. Modelled and measured net radiation flux density above the mulch and total downward radiation flux density near the bottom of the mulch were generally in excellent agreement, with some exceptions. These were attributed mainly to measurement error (condensation on the upper dome of the net radiometer above the mulch before and just after sunrise and inadequate spatial averaging under the thin mulches). Modelled profiles of daytime and nighttime radiation fluxes in a 10 t ha−1mulch and simulations of the effects of uniformity, randomness, and
clumping of mulch elements are reported. © 2000 Elsevier Science B.V. All rights reserved.
Keywords: Straw mulch; Radiation; Model; Clumping; Field plots
1. Introduction
Crop residues conserve soil and modify soil micro-climate when left on the surface as a mulch and are valuable animal foods, fuels, and manufactured
ma-∗Corresponding author. Tel.:+1-604-822-2875;
fax:+1-604-822-8639.
E-mail address: [email protected] (M.D. Novak)
terials when harvested (Unger, 1994). The effects of mulching on soil microclimate are largely controlled by both radiation regimes and turbulent transfer within the mulch. Similarly, the quality of hay, which mainly depends on how fast it dries after cutting, is largely controlled by the radiation distribution and turbulent transfer within the hay. Therefore, we carried out a detailed series of micrometeorological field studies of barley straw applied at various rates. Two other papers
(Novak et al., 2000a, b) describe the wind and turbu-lence regimes and the transfer of heat and moisture within and above a 10 t ha−1mulch. This paper deals with the radiation distribution within the mulch for all the application rates (2, 5, 10, and 15 t ha−1) that we studied in our field plots.
To simulate the radiation distribution, some re-searchers have treated the mulch as a single (bulked) layer (Ross et al., 1985; Chung and Horton, 1987; Hares and Novak, 1992). This approach, however, does not provide details of the distribution within the residue layers, which is particularly critical for, say, hay drying. Others have divided the mulch or hay into many layers (Bristow et al., 1986; Tuzet et al., 1993; Bussière and Cellier, 1994) and used standard radi-ation modelling techniques (Kreith, 1973; Norman, 1979) to simulate the vertical profiles of radiation flux densities. Residue elements were usually assumed to be randomly distributed although within-mulch ra-diation flux densities were not measured to test the validity of this assumption. In some cases there is an indirect indication that the radiation simulation is in error. For example, the model of Bussière and Cel-lier (1994) predicted small daytime evaporation rates under a sugar-cane mulch but their measured values were quite large (150–200 W m−2). One possible rea-son for this error is the underestimation of downward solar radiation flux at the underlying soil surface.
To improve the simulation of radiation distribution in a mulch, features specific to mulches must be con-sidered (Tanner and Shen, 1990, hereafter referred to as TS90). An important attribute is whether the mulch elements are uniformly or randomly distributed, or clumped, as found also in plant canopies (Chen and Black, 1991). TS90 found that the residue elements were nearly uniformly distributed in a flail-chopped corn mulch but Wagner-Riddle et al. (1996) found a near random distribution in a rye mulch. The uniformity, randomness, or clumping of mulch ele-ments probably depends strongly on the method of spreading and therefore can be altered. Dead residue elements have much smaller transmissivities than live leaves, e.g., flail-chopped corn residue elements have transmissivities of 0.005 and 0.02 in the visible and near-infrared bands, respectively, compared to 0.07 and 0.36, respectively, for senesced corn leaves (TS90). There can be a large difference between the temperatures of the upper and lower surfaces of a
(sunlit) mulch element, in part because of the lack of transpiration which is an important component in the temperature regulation of leaves (Norman, 1979). This difference can be accentuated by the low wind speeds within the mulch and the low thermal conduc-tivity of dry residue elements.
The objective of this research was therefore to develop a relatively simple but physically-based radi-ation model of a barley-straw mulch that incorporates these features. We present such a model in this paper and test it against measurements of radiation fluxes made both above and below the mulches applied at the various rates in our field plots. We then assess the sensitivity of the model to its input parameters, use the model to determine the profiles of shortwave and longwave components within the mulch under field conditions, and simulate the effects of uniformity, randomness, and clumping of mulch elements on the shortwave radiation distribution.
2. Theory
2.1. Clumping index
For a mulch (or any canopy) consisting of flat el-ements with their flat sides in the horizontal plane, which we assume to be the case, the transmission of radiation can be described as (Ross, 1976)
τ (Ri)=(1−1R)[1−1R]i−1, i≥1, (1)
whereτ (Ri)is the transmissivity through i vertically
stacked ‘elemental’ layers (within which no mutual shading occurs among residue elements) having a (single-sided) residue-area index Ri = i1R, 1R is
the residue-area index of an elemental layer, andis the clumping index, which describes the way in which the residue elements are arranged, as illustrated by the following limiting and special cases (Ross, 1976): 1. =0, which is when the highest degree of clump-ing occurs. This implies that the residue elements in all layers below the first are arranged one be-low the other. Such an arrangement provides maxi-mum mutual shading and, consequently, maximaxi-mum transmissivity. From Eq. (1) we obtain
It follows that the penetration of radiation is deter-mined by the first layer and lower layers have no effect.
2. =1, which is when residue elements are randomly distributed. Eq. (1) becomes
τ (Ri)=(1−1R)i, i≥1. (3)
3. =1/1R for Ri>1, which is when the lowest
de-gree of clumping or the highest dede-gree of unifor-mity exists. This is the situation where no mutual shading exists between elements in different layers, which yields
τ (Ri)=
1−Ri, 0< Ri ≤1,
0, Ri >1. (4)
Because each residue layer supports the weight of the overlying layers this case is physically impos-sible but represents an upper limit for.
2.2. Mulch radiation model
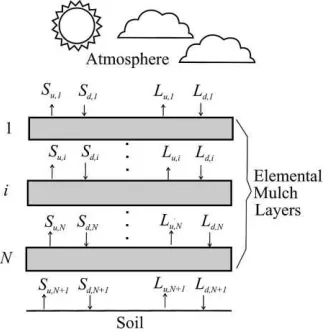
The mulch is divided into N elemental layers, la-belled 1. . .N, layer 0 denotes the atmosphere, and
layer N+1 denotes the soil (Fig. 1). The mulch ele-ments are assumed to be opaque to both shortwave and longwave radiation and their longwave emissiv-ities are assumed to be 1 because the reflectivity for thermal fluxes is negligible (Norman, 1979; Bristow
Fig. 1. Schematic showing both downward (subscript d) and up-ward (subscript u) flux densities of shortwave, S, and longwave,
L, radiation in the soil–mulch–atmosphere system.
et al., 1986). The longwave emissivity of the soil is similarly assumed to be 1. The (Ri) function
is assumed to be the same for both shortwave and longwave radiation, as found for flail-chopped corn residue by TS90 and Shen and Tanner (1990). Short-wave radiation is not separated into beam and diffuse components. According to TS90 both components are transmitted similarly through a mulch. Forward scattering of shortwave radiation is assumed to be negligible so that all internal reflections within the mulch occur from the flat sides of the mulch ele-ments. Penumbra effects are also neglected, which is reasonable for such a short canopy (Ross, 1976).
From Eq. (1), the ‘primary’ downward transmitted direct solar radiation above the ith layer,Sd′,i, is given by
Sd′,i=S0τi−1=S0(1−1R)[1−(Ri−1)1R]i−2,
for 2≤i≤N+1, (5)
where the term primary refers to the fact that no sec-ondary reflections downward are included, S0 is the
solar irradiance above the mulch, and τ0=1 (which
corresponds to i=1). These downward fluxes are re-flected upward by all the mulch layers and the un-derlying soil surface yielding a primary upward flux above the ith layer,Su′,i, given by
Su′,i= N X
j=i
αm(Sd′,j−Sd′,j+1)τj−i+Sd′,N+1αsτN+1−i,
for 1≤i≤N, (6)
withSu′,N+1 =Sd′,N+1αs, whereαm is the shortwave
reflectivity of the mulch elements andαs is the
short-wave reflectivity of the soil. Note that theτi(Ri)
func-tion is used for upward and downward transfer, which is appropriate for mulch elements which appear the same whether looked at from above or below.
Similarly, the ‘secondary’ downward shortwave ra-diation above the ith layer,Sd′′,i, is given by
Sd′′,i= i−1
X
j=1
αm[(Su′,j+1−S ′
u,j)−αm(S′d,j+1
−S′d,j)]τi−1,for 2≤i≤N+1, (7)
Su′′,i= square brackets in Eqs. (7) and (8) ensure that fluxes determined in a previous step are not counted twice. ‘Tertiary’ reflections were also determined similarly but were found to be less than 1 W m−2 and so are neglected. The net shortwave radiation flux density above the ith layer, Sn,i, is therefore
Sn,i=Sd′,i−S
Longwave radiation above each layer has components originating at the soil surface, residue layers, and the atmosphere. The fraction of the view from a plane above the ith layer occupied by the part of the jth over-lying layer that is illuminated by radiation emanating uniformly upward from above the ith layer is given by
fj,i=τi−j−1−τi−j, for 1≤j < i, (10)
with the fraction of the atmosphere seen from this plane given byf0,i =τi−1, or 1−Pij−1=1fj,i. Similarly,
the fraction of the view from a plane above the ith layer occupied by the part of the jth underlying layer that is illuminated by radiation emanating uniformly downward from above the ith layer is given by
fj,i=τj−i−τj−i+1, fori≤j < N+1, (11)
with the fraction of the soil seen from this plane given by fN+1,i = τN+1−i, or 1−PNj=ifj,i. These are
assumed to be the effective ‘view factors’ for longwave transfer from the atmosphere, jth mulch layer, and soil to the plane above the ith layer.
The downward longwave radiation flux density above the ith layer, Ld,i, is then given by
Boltzmann constant, Ta is the absolute temperature
of the air (at ‘screen’ height), and Td,j is the
abso-lute temperature of the lower surfaces of the jth layer mulch elements. The first term on the right hand side of Eq. (12) is due to radiation originating from the at-mosphere and the second term due to radiation origi-nating from overlying mulch layers. Similarly, the up-ward longwave radiation flux density above the ith layer, Lu,i, is given by
ature of the soil surface and Tu,j is the absolute
tem-perature of the upper surfaces of the jth layer mulch elements. The first term on the right hand side of Eq. (13) is due to radiation originating from the soil and the second term due to radiation from underlying mulch layers. The net longwave radiation flux density above the ith layer is given by
Ln,i =Ld,i−Lu,i, for 1≤i≤N+1, (14)
and the net radiation flux density above the ith layer is given by
Rn,i =Sn,i+Ln,i for 1≤i≤N+1. (15)
For clear-sky conditions, the value ofεais determined
from Ta (K) and water vapour pressure, ea(mb), at
screen height using (Novak and Black, 1985)
εa =εac=a0+5.95×10⁻⁵eaexp
1500
Ta
, (16)
whereεac is the clear-sky emissivity and a0 is a
pa-rameter that accounts for dust concentrations in the atmosphere (Idso, 1980). For cloudy conditions,εais calculated from (Bristow et al., 1986)
εa =(1−0.84C)εac+0.84C, (17)
where C is the mean daily fraction of cloud cover (which ranges from 0 to 1). C is estimated from χ
C=
1, χ <0.35,
2.4−4χ , 0.35≤χ ≤0.6,
0, χ >0.6.
(18)
Because the model neglects higher reflections beyond the secondary, all variables are calculated explicitly from these simple formulas, in contrast with more standard models which are not approximate in this way but which require matrix inversion for their so-lution (Kreith, 1973). The input variables S0, Ta, ea,
Tu,i, Td,i, and Ts, are all given as functions of time, t,
during the period of interest. The model calculations were programmed in FORTRAN.
3. Experiments
3.1. Field-plot measurements
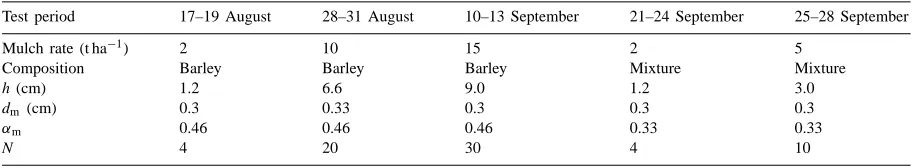
Field tests of the mulch radiation model were carried out at the University of British Columbia Plant Science Research Station in Vancouver from 17 August–28 September 1993. During 17 August–13 September pure barley straw was the predominant mulch material while during 21–28 September the mulch was a mixture of barley straw, clover, and weeds (Table 1). The mulch plot was a 14 m diameter circular area located in a 25 m×40 m area kept bare outside the mulch. Mulch application rates of 2, 5, 10, and 15 t ha−1(resulting in h=1.2, 3.0, 6.6, and 9.0 cm, respectively) were studied successively on this plot.
Rn,1 was measured using a net radiometer (model
S-1, Swissteco Instruments, Oberriet, Switzerland) mounted at about 0.5 m above the soil surface near the centre of the mulch plot. The instrument was cali-brated in the field prior to the experiments by shading out the beam component of solar radiation (Fritschen
Table 1
Mulch application rate, composition (barley straw or a mixture of barley, clover, and weeds), mulch height, h, elemental layer thickness,
dm, mulch element reflectivity,αm, and the number of elemental layers, N, used in the model for the indicated test periods in 1993
Test period 17–19 August 28–31 August 10–13 September 21–24 September 25–28 September
Mulch rate (t ha−1) 2 10 15 2 5
Composition Barley Barley Barley Mixture Mixture
h (cm) 1.2 6.6 9.0 1.2 3.0
dm(cm) 0.3 0.33 0.3 0.3 0.3
αm 0.46 0.46 0.46 0.33 0.33
N 4 20 30 4 10
and Gay, 1979), which was measured by similarly shading a model CM5 Kipp & Zonen solarimeter that had been calibrated at the National Atmospheric Radiation Centre, Downsview, Ont., Canada. The net radiometer was most reliable during daytime because
Rn,1 was probably overestimated on some nights
when moisture condensation occurred on the upper polyethylene dome.
The total downward radiation flux density beneath the mulch,Sd′,N−1+Sd′′,N−1+Ld,N−1, was measured
using a miniature net radiometer of diameter 1.2 cm (model minor MK II S-14, Swissteco Instruments, Oberriet, Switzerland). The sensor of the radiometer was aligned with the soil surface so that the upper polyethylene dome protruded into the mulch layer by about 0.6 cm. The lower dome was replaced with a black-body cavity and temperature sensor positioned in a hole in the soil. The measured flux density was assumed to apply to z=0.6 cm (i=N−1) within the mulch, where z is the height above the soil surface. The miniature net radiometer was also calibrated using the beam-shading technique prior to the experiments. Because of its location, the miniature net radiometer dome was likely free of dew at night.
Hourly average S0was measured at an auto-climate
station located about 100 m from the experimental site using a miniature solarimeter (model LI-200SZ, LI-COR Inc., Lincoln, NE, USA) mounted at z=10 m. Hourly average Ta and ea were measured with a
thermistor and capacitance-type chip, respectively, in a combined sensor (model 207 in August and model HMP35CF in September, Campbell Scientific Inc., Logan, UT, USA) placed in a Stevenson screen (z≈1.5 m) at the climate station. The capacitance-type chip measures relative humidity, RH, which was con-verted to vapour pressure using Ta measured by the
for water. All climate station sensors were monitored using a programmable data logger (model CR21X, Campbell Scientific Inc., Logan, UT, USA).
The hourly average profile of upper-surface mulch-element temperature, Tu, was measured by
attaching 250mm diameter chromel/constantan
ther-mocouples to the upper surfaces of selected elements at different z using transparent tape. Measurements were at z=1.2 cm in the 2 t ha−1 mulch, z=1.1, 2.2, and 3.3 cm in the 5 t ha−1mulch, z=1.1, 2.2, 3.3, 4.4,
5.5, and 6.6 cm in the 10 t ha−1 mulch, and z=1.0, 2.0, 3.0, 4.0, 5.0, 6.0, 7.0, 8.0, and 9.0 cm in the 15 t ha−1mulch. Hourly average Ta within the mulch
was also measured at these same z using 76mm
diam-eter chromel/constantan thermocouples. The hourly average lower-surface mulch-element temperature,
Td, was assumed to be equal to Taat the same z. This
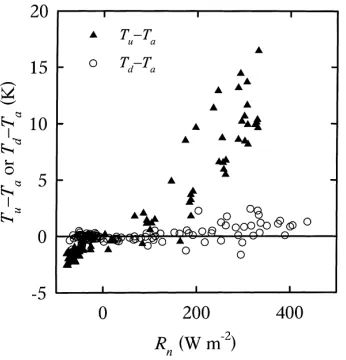
assumption was tested in 1994 using the same exper-imental site and layout for the 10 t ha−1 barley-straw mulch. Fig. 2 shows Td–Ta at the top of the mulch
(z=6.6 cm) plotted versus Rnabove the mulch for five
consecutive days. Also shown is Tu–Ta at z=6.6 cm
from the four consecutive days of measurement with the 10 t ha−1mulch in 1993. Generally, Td–Ta is near
zero although there is some suggestion of a small
in-Fig. 2. Difference between hourly average lower-surface, Td, or upper-surface, Tu, mulch-element temperature and air temperature,
Ta, at the top of the 10 t ha−1 straw mulch vs the net radiation flux density above the mulch during 0:00 hours PST on 18 August to 24:00 hours PST on 22 August 1994, or 8:00 hours PST on 28 August to 24:00 hours PST on 31 August 1993, respectively.
crease, up to about 1.5 K on average, with increasing
Rn. However, the increase is very small compared
with Tu–Ta, which increases up to 15 K at midday
and falls to about −3 K at night when Rn becomes
negative. Novak et al. (2000b) show that Tu–Tain the
upper third of the mulch increases strongly with z dur-ing daytime. The values of Tu,i and Td,i required for
the various layers in the mulch model were calculated from the measured within-mulch vertical profiles of
Tuand Ta, respectively, by linear interpolation.
Hourly average Ts was calculated using Fourier’s
law applied across the upper 0.5 cm layer of the soil using hourly average soil temperature measured with a chromel/constantan thermocouple installed nominally at the 0.5 cm depth and hourly average soil heat flux density measured with a custom-made thermopile-type heat flux plate installed nominally at the 1 cm depth (see Novak et al., 2000b, for a full description). All instrument signals during the mulch experiments were measured, averaged on-line, and stored using a programmable data logger (model CR7, Campbell Scientific Inc., Logan, UT, USA).
3.2. Determination of mulch radiation parameters
In the field experiments, the straw consisted mostly of flattened stalks typically about 30 cm long, 0.5 cm wide, and 0.1 cm thick, but some unflattened pieces about 0.3 cm wide and 0.3 cm thick also existed. The flattening occurred because the straw had been firmly packed in bales. The projected element area per unit mass of the mulch was 5.6 m2kg−1, as measured with a video camera and image analysis software (Leaf Area and Analysis Programme, Skye Instruments Ltd., Llandrindod Wells, Powys, UK), with resulting total projected residue-area density approximately equal to 91 m2m−3 averaged over all mulch rates used. The ratio of mulch height, h, to application rate is about 0.6 cm per t ha−1, based upon the mulch heights mea-sured in the field tests (Table 1). Assuming that the depth of an elemental layer is dm=0.3 cm, the
maxi-mum thickness of a piece of straw, we have1R=0.28. The expected range for is then about 0–3.5, i.e., 0–1/1R.
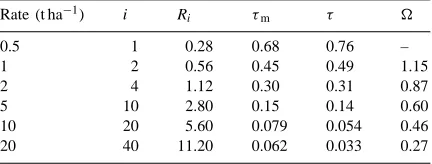
Measurements ofτ(Ri) were made in the summer
1 m above bare soil (Hares, 1988; Hares and Novak, 1992). Fresh dry barley straw was manually distributed uniformly on the film at rates of 0.5, 1, 2, 5, 10, and 20 t ha−1. Downward solar radiation below the frame was measured with a solarimeter (model CM5, Kipp & Zonen, Delft, Holland) positioned 0.13 m below the middle of the frame while that above the frame,
S0, was measured by another such solarimeter located
nearby. The ratio of average solar radiation below to that above the mulch, τm, was measured at 10 min
intervals during daytime (8:00–15:00 hours PST) on clear days (one mulch application rate per day) using a programmable data logger (model CR21, Campbell Scientific Inc., Logan, UT, USA). Significant scatter (0.35–0.87) in the 10 min ratios existed for applica-tion rates lower than 5 t ha−1, which was attributed to the variability of mulch cover at these low rates, but for the higher rates the ratios were nearly constant, as found by TS90. Measured ratios shown in Table 2 are averages over the daytime measurement period.
Theτmvalues need correction because they include
the effects of the transmissivity of the acrylic film,
τa=0.88, (the reflectivity of the acrylic film is
ne-glected) and the reflection downward by the mulch of shortwave radiation that had been reflected upward by the bare soil, i.e.,
τm =τaτ+ Ssτa2α
S0 , (19)
where Ss is the solar radiation flux density reflected
upward by the illuminated soil surface and α is the reflectivity of the mulch layer to radiation from below it. Theτa2 term appears because the radiation passes through the acrylic twice. Ss is calculated as
Ss=αs[f τmS0+(1−f )S0], (20)
Table 2
Number of elemental layers, i, residue-area index, Ri, uncorrected
transmissivity,τm, corrected transmissivity,τ, and clumping index,
, for fresh barley-straw mulch at various application rates Rate (t ha−1) i R
10 20 5.60 0.079 0.054 0.46
20 40 11.20 0.062 0.033 0.27
whereαs=0.16 (dry soil) was measured in the field
and f=0.15 is the estimated view factor between the bottom of the frame and its shadow on the soil surface. Theαwas approximated by assuming a constant ratio between it and the absorptivitya=1−τ−αof the mulch, similar to that done by TS90, i.e,
a α =
(1−τ −α)
α =K, (21)
where K is a constant. Substituting Ss from Eq. (20)
into Eq. (19) yields
τ = τm τa
−αs[f τm+(1−f )]τaα. (22)
Substituting α=0.3 measured above a field plot of fresh mulch applied at 10 t ha−1 (Hares, 1988), for which the contribution from the underlying soil is neg-ligible, and theτm=0.079 for the 10 t ha−1in Table 2
into Eq. (22), and then substituting the so-calculated
τ=0.054 into Eq. (21) yields K=2.15. With this value of K,τ is calculated for all the mulch application rates (Table 2) from
τ = τm/τa−αs[f τm+(1−f )]τa/(1+K)
1−αs[f τm+(1−f )]τa/(1+K)
, (23)
which is derived by combining Eqs. (19), (20), and (21).
The(Ri) calculated from theτ(Ri) with Eq. (1)
are also shown in Table 2. For R1=1R, a single
el-emental layer,τ should be 1−0.28=0.72. The actual measuredτ is 0.76, which is quite close to 0.72 and is consistent with a small amount of overlap of elements in this layer. Note that the value ofis undefined for this layer. This is not a problem in principle when cal-culatingτ in Eq. (5) because the factor containing
for i=2 (i.e., between the 1st and 2nd mulch layers) is equal to 1 for any value of. As more elemental layers are added the effects of uniformity and clump-ing co-exist, with uniformity dominatclump-ing somewhat for
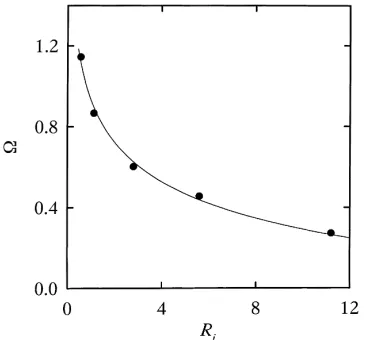
R2=0.56, resulting in >1. This is reasonable since
the straw was distributed as uniformly as possible. TS90 found=1.74 and 1.66 for beam and diffuse shortwave radiation, respectively, from their transmis-sivity measurements with a flail-chopped corn mulch (which resembled the barley straw in that most of the pieces were flat with their flat sides in the horizontal plane). As Ri increases further, becomes
proba-bly because of the greater effort required to manually separate all the clumps of baled straw at the higher rates. The(Ri) function can be represented by the
empirical equation,
(Ri)=3.01Ri−0.104−2.07, Ri > 1R, (24)
which is shown in Fig. 3. Note that this applies for fresh straw, which was appropriate since the field ex-periments lasted 3–5 days for each application rate. Hares (1988) also measured transmissivities of straw that had been in the field for about 1 year and found large reductions compared to the fresh values (Hares and Novak, 1992), in agreement with the field obser-vations of Wagner-Riddle et al. (1996). Eq. (24) was used to calculatein Eq. (5) for all i≥3. For i=2 the measuredτ=0.76 was used.
Mulch element reflectivity, αm, was measured directly by pasting fresh dry barley straw onto a 0.4 m×0.4 m wooden board so that the area was com-pletely covered with straw without any gaps. Solar radiation fluxes incident to and reflected from the board were measured outdoors around midday on a clear day (16 October 1996) with the board placed in two orientations, yielding solar-beam angles of 0 and 70◦relative to the direction normal to the board. The measurements were done with a single model CM5 Kipp & Zonen solarimeter, which was manu-ally rotated between facing away from and facing the
Fig. 3. Clumping index determined from measured transmissivities vs residue-area index for the barley-straw mulch. Also shown is the fitted nonlinear regression given by Eq. (24).
board, the latter with the radiometer 0.1 m away from the centre of the board. The solarimeter signal was monitored directly with a voltmeter. The effects of the background grassed area (with measured reflectivity of 0.25) and the shadow of the solarimeter on the board, both of which were partially in the view of the solarimeter when it faced the board, were accounted for using standard view factor theory (Kreith, 1973) similar to the corrections forτ described above. The
αm so-measured was 0.46±0.04, which we used in the radiation model for the mulch plots consisting of pure barley straw. However, for the application rates with clover and weed residues mixed in with the bar-ley straw, theαm was determined by matching
mod-elled and measured Rn,1for the 5 t ha−1mulch during
12:00–13:00 hours PST on 26 September 1993, a clear day. Thisαm was used for all other times and
mulch application rates with the mixed mulch (Table 1). The measuredαm were similar to those of other
residue types, e.g.,αm=0.46±0.06 for a flail-chopped
corn residue (TS90) and αm=0.31 for a sugar-cane residue (Bussière and Cellier, 1994).
A value ofαs=0.1 (moist soil) was estimated based on previous field measurements (Hares and Novak, 1992). It was assumed that a0=0.6, the oceanic value
(Idso, 1980), because the site is located within 500 m of the ocean and west-northwest winds prevailed for most of the study. Because of the variation of the ratio of h to application rate, the effective layer depth for the 10 t ha−1mulch is actually slightly greater (0.33) than the 0.3 nominally assumed (Table 1).
4. Results and discussion
4.1. Comparison with field measurements
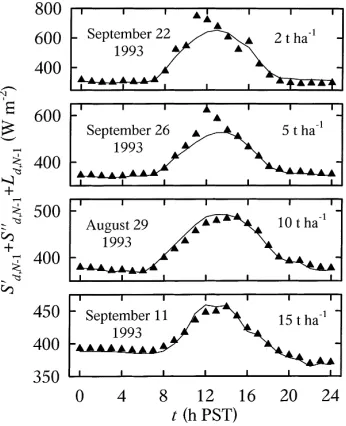
Diurnal variations of modelled and measured hourly average Rn,1for the indicated day in each of the 2, 5,
Fig. 4. Diurnal variations on the indicated days in 1993 of measured (symbols) and modelled (solid curves) hourly average net radiation flux density above straw mulches applied at rates of 2, 5, 10, and 15 t ha−1.
September (5 t ha−1). The most likely explanation for these is measurement error due to moisture condensa-tion on the upper dome of the net radiometer, which we suspect occurred often during the experiments. The moisture has an emissivity close to 1 and con-sequently the net radiometer overestimates Rn,1. On
11, 22, and 26 September RH>90% was measured at the climate station during 0:00–6:00 hours PST, but otherwise RH<80%. During 29 August, RH<80% all day which is consistent with the condensation ex-planation. Another possibility, which we feel is less likely, is a greater cloud cover at night compared with daytime. The C used in the model is based on day-time measurements of S0 and so would then be too
low at night, which would cause the model to under-estimate Rn,1(= Ln,1). Despite these discrepancies,
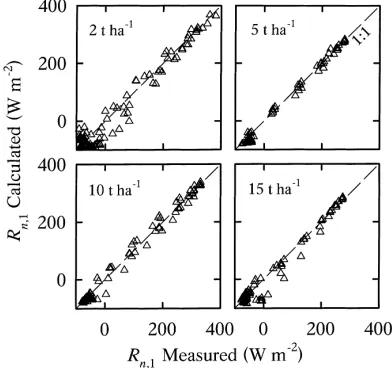
good agreement is found between measurements and calculations when all available data from the four mulch application rates are compared on 1:1 plots (Fig. 5). Table 3 reports the linear regression statistics (intercept forced through 0) for these 1:1 plots which show that the r2values are all above 0.93.
Figs. 6 and 7 present comparisons similar to those in Figs. 4 and 5, respectively, but between modelled and
Fig. 5. Plots of all available modelled vs measured hourly average net radiation flux density above straw mulches applied at rates of 2, 5, 10, and 15 t ha−1 during 1993. Also shown are the 1:1 lines.
measured hourly averageSd′,N−1+Sd′′,N−1+Ld,N−1.
The 1:1 regression statistics are also reported in Ta-ble 3. Agreement between the model and measure-ments is excellent for all mulch application rates at night and for the 10 and 15 t ha−1 application rates during daytime. But agreement is occasionally poor during the daytime for the 2 and 5 t ha−1 applica-tion rates. This is mainly attributed to the spatial het-erogeneity of the transmitted shortwave flux beneath these thin canopies. Based on the wheat curve in Gre-gory (1982), the estimated cover of the soil surface for the barley-straw mulch is 64 and 92% for the 2 and 5 t ha−1 mulches, respectively, so that it is ex-pected that the full above-mulch solar radiation flux would occasionally penetrate to near the bottom of the mulch as solar elevation and azimuth change during the day. Tram systems have been generally used to overcome this heterogeneity problem by greater spa-tial sampling when measuring radiation fluxes within forests. Black et al. (1991) found that the more open the forest canopy, the longer the pathway of the tram should be in order to obtain good spatial averaging. Because a mulch is much denser than a forest, the to-tal downward radiation flux under the thick mulches was adequately smooth (standard error of estimation
Table 3
Statistics associated with the linear regression (intercept forced through 0) between modelled and measured net radiation flux density above the mulch, Rn,1, and total downward radiation flux density at 0.6 cm above the soil surface within the mulch,S′d,N−1+S
′′
d,N−1+Ld,N−1,
for straw application rates of 2, 5, 10, and 15 t ha−1 during 1993
Rate (t ha−1) r2 Slope Standard error (W m−2) Range (W m−2) Number of hours
Rn,1 2 0.96 0.98 30 −91–407 112
5 0.99 1.02 16 −75–279 86
10 0.99 1.09 17 −78–331 89
15 0.94 0.96 32 −76–274 73
S′
d,N−1+S
′′
d,N−1+Ld,N−1 2 0.88 0.99 50 297–782 112
5 0.87 0.96 25 334–532 86
10 0.98 0.99 6.0 369–492 89
15 0.97 1.00 5.4 357–456 73
was not so for the thin mulches (standard error of es-timation in the range 20–50 W m−2).
4.2. Model sensitivity analysis
Inputs to the model include variables (S0, Ta, ea,
Tu,i, Td,i, and Ts, all given as functions of t in the
pe-riod of interest) and parameters ((Ri),αm, andαs).
Outputs of the model consist of various radiation flux
Fig. 6. Diurnal variations on the indicated days in 1993 of mea-sured (symbols) and modelled (solid curves) hourly average total downward radiation flux density at 0.6 cm above the soil surface within straw mulches applied at rates of 2, 5, 10, and 15 t ha−1.
densities of interest. Here, we consider the sensitivity of Rn,i (because of its importance in energy balance
modelling) at the top (i=1, or above the mulch), mid-dle (i=(N+2)/2), and bottom (i=N+1, or at the soil surface) of the mulch to changes in S0, Tu,i,εac,αm, αs, and. The fractional sensitivity, fp, of Rn,i to a
fractional change in an input variable or parameter p is defined as (McNaughton and Spriggs, 1986)
fp=
Rt1
t0p(∂Rn,i/∂p)dt
Rt1
t0Rn,idt
, (25)
where t0 and t1 are the initial and final times of
the period of interest. Because the partial derivative and integrals in Eq. (25) cannot easily be computed analytically, the partial derivative was replaced by a finite-difference approximation, 1Rn,i/1p, with
1p=0.1p, and the integrals were replaced by sums over the hourly calculated values. For the variables (that vary with t) and in addition for(Ri) and Tu,i
(that also vary with i, i=1. . .N), p is a factor that
multiplies each of them, with p=1 corresponding to the base case.
Fractional sensitivities were calculated for daytime (6:00–19:00 hours PST) and nighttime (19:00–6:00 hours PST) averages during 28–31 August 1993, with the 10 t ha−1 mulch (Table 4). Sensitivities for the other mulch application rates (not shown) are qualita-tively similar. The average daytime Rn,i is sensitive to
S0 andεac, especially in the upper part of the mulch.
This was also reported by Tuzet et al. (1993), who used evapotranspiration rate as the output for their model sensitivity analysis. Daytime Rn,i is also
sen-sitive to, especially in the lower part of the mulch.
Tu,i, αm, and αs have little effect except for αm at
the top of the mulch. Nighttime average Rn,i is very
sensitive to εac and , especially at the mulch top for the former and at the mulch bottom for the latter. Changes in the other inputs have little effect.
Although Rn,i is insensitive to Tu,i, it is of interest
to know how large the error is if it is assumed that
Tu,i=Td,i. Additional model calculations show that
daytime average Rn,1is 6% higher when this
assump-Table 4
Fractional sensitivity of the daytime and nighttime averages of net radiation flux density at the top, middle, and bottom of the 10 t ha−1 straw mulch to input variables (solar irradiance, S0, upper-surface element temperature, Tu,i, and atmospheric clear-sky emissivity, εac) and input parameters (element shortwave reflectivity, αm, soil shortwave reflectivity, αs, and clumping index, ) during 28–31August 1993
Daytime Nighttime
Top Middle Bottom Top Middle Bottom
S0 1.7 1.2 0.91 −0.007 −0.004 −0.003
Tu,i −0.059 −0.005 0.000 −0.022 0.033 0.000
εac 1.7 0.92 0.62 −4.3 −2.0 −1.4
αm −0.68 −0.025 0.25 0.002 0.000 −0.001
αs −0.001 −0.006 −0.08 0.000 0.000 0.000
−1.1 −1.9 −2.7 −0.12 −1.3 −1.8
tion is made. For hourly Rn,1, the maximum
differ-ence is 10%. During nighttime, the differdiffer-ence is small (<5%). Within the mulch, the effects on Rn,idecrease,
becoming negligible at the soil surface. Therefore, al-though not as important as S0,εac,αm, and,
measur-ing Tu,ishould be considered if a 10% error is deemed
significant.
4.3. Modelled vertical profiles of radiation
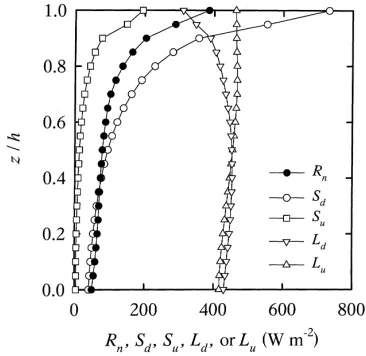
A major application of the radiation model is to determine the vertical profiles of the components of the radiation balance within the mulch. Fig. 8 shows modelled vertical profiles of Rn,Sd=Sd′ +Sd′′,Su= Su′ +S′′u, Ld, and Luwithin the 10 t ha−1straw mulch
during 12:00–13:00 hours PST on 29 August 1993. The largest component at the mulch top is Sd, which
attenuates quickly with decreasing z in the top 1/3 of the mulch, indicating strong interception of short-wave radiation. A fraction of the intercepted solar ra-diation is reflected upward as shortwave rara-diation and the rest is absorbed, and in steady state, re-emitted as longwave radiation, resulting in Rn≈Sd/2 near the
canopy top. The albedo of the mulch is 0.27, consid-erably less than αm=0.46, in agreement with other
studies (Tanner et al., 1987). In the lower part of the
mulch, Sddecreases slowly due to the high degree of
clumping of the mulch elements. Rn decreases even
more slowly because the net longwave increases and
Sudecreases. The shift from loss to gain for the
long-wave balance occurs near the middle of the mulch, which is explained by the vertical profiles of Tu and
Td (≈Ta), with the former increasing with z
through-out the mulch and the latter reaching a maximum near
z/h=2/3 (Novak et al., 2000b). Sdand Rnare
signifi-cantly large at the soil surface below the mulch which has implications for the energy balance there (Novak et al., 2000b).
Fig. 9 shows modelled vertical profiles within the 10 t ha−1straw mulch during 0:00–1:00 hours PST on 29 August 1993. During nighttime only the longwave components are nonzero. Although Tu,1<Ta, Rnabove
the mulch is negative because the atmospheric emis-sivity is much less than that of the residue elements. As z/h decreases the sky view factor decreases and Rn
therefore increases slowly. However, Rn is still
nega-tive at the soil surface.
In conservation tillage practices, the degree of clumping among residue elements may change from one situation to another (TS90). The model was used to investigate the impact of clumping on the mulch radiation balance. In principle, a complete assessment of this impact requires that the effects of changing
Fig. 9. Modelled vertical profiles of downward and upward long-wave radiation flux densities, Ldand Lu, respectively, and net ra-diation flux density, Rn, within the 10 t ha−1 straw mulch during 0:00–1:00 hours PST on 29 August 1993.
on the vertical profiles of Tu and Td be known,
either from measurements or calculations with a full energy balance model of the mulch. These effects are not considered here but, as shown by the sensitivity analysis, they should be small compared to those associated with directly. Fig. 10 shows vertical profiles of Sn within the 10 t ha−1 straw mulch
dur-ing 12:00–13:00 hours PST on 29 August 1993 for different assumed values of.
Except for the =0 case (maximum clumping) there is little effect of on Sn at the top of the
mulch (in spite of the sensitivity of Rn indicated in
Table 4). For=0, the shortwave radiation reaching the underlying soil surface is a maximum. A large evaporation rate from soil would be expected in this case if the soil was wet, so that this element arrange-ment is not efficient for conserving soil moisture but may be good for warming the soil at high latitudes where low soil temperatures in early spring are a problem. Both the =1 (random distribution) and
=3.5 (most uniform distribution) cases virtually eliminate shortwave radiation at the underlying soil surface and so are effective for water conservation. According to the actual measured transmissivities, the mulch elements are clumped to a moderate degree and so an intermediate radiation distribution exists.
Fig. 10. Modelled vertical profiles of net shortwave radiation flux density calculated with the indicated clumping indices within the 10 t ha−1straw mulch during 12:00–13:00 hours PST on 29 August 1993. The transmissivities corresponding to the actual mulch
Clumping might explain the 150–200 W m−2 under-estimate of evaporation under a sugar-cane mulch by the model presented in Bussière and Cellier (1994). Their model assumed that the mulch elements were distributed randomly in each layer. Clearly, clumping greatly alters radiation distribution patterns within a mulch, which can, therefore, be modified according to different applications.
5. Summary and conclusions
A model to predict profiles of shortwave and long-wave radiation flux densities within barley-straw mulches has been described and tested against 3–5 days of hourly field-plot radiation flux measure-ments made above and below the mulch for each of the 2, 5, 10, and 15 t ha−1application rates studied. In the model, mulch elements are assumed to be flat, with their flat sides in the horizontal plane, and opaque, with negligible longwave reflectivity (true also for the underlying soil surface). Mulch transmissivities are identical for beam and diffuse shortwave radiation, forward scattering of shortwave radiation and penum-bra effects are negligible, and effective view factors are used to calculate longwave fluxes emanating from lower and upper mulch element surfaces, which may differ in temperature. The model separates the mulch into horizontal elemental layers and neglects all but primary and secondary shortwave reflections between these, so that calculation of the fluxes above any layer is explicit and does not require matrix inversion.
Model input parameters were measured completely independently of the field tests (except for two cases where mulch element reflectivity was calibrated us-ing a sus-ingle midday hourly measurement of net radi-ation above the mulch). Sensitivity tests show that an important input to the model when predicting the net radiation profile is the transmissivity, which depends upon the total leaf area traversed within each mulch. This function was determined by uniformly distribut-ing fresh barley-straw mulch at rates of 0.5, 1, 2, 5, 10, and 20 t ha−1 on a frame and measuring down-ward shortwave fluxes above and below it. For the 1–2 t ha−1rates, the clumping index determined from the corresponding transmissivity is nearly equal to or greater than 1, as expected for uniform distribution of elements and in agreement with the flail-chopped corn
mulch of TS90. However, for the 5–20 t ha−1 rates the clumping index varies in the corresponding range 0.72–0.31, which is consistent with the elements being increasingly clumped together, probably because of the greater effort needed to manually separate the ele-ments of baled straw as the application rate increases. The field measurements show that upper-surface and lower-surface mulch element temperatures differ by up to 15 K, although model tests show that assum-ing them to be equal (to measured air temperature within the mulch) does not affect net radiation above, within, and below a 10 t ha−1 mulch by more than 10%. The sensitivity tests show that solar irradiance, atmospheric emissivity, and mulch element reflectiv-ity are more important input parameters than the dif-ference between lower-surface and upper-surface ele-ment temperatures.
Modelled and measured net radiation flux density above the mulch and total downward radiation flux density near the bottom of the mulch are in excel-lent agreement most of the time. Exceptions are the net radiaton during the latter part of some nights and early mornings and the total downward radiation flux during daytime for low mulch application rates. The most likely explanation of the former is that dew for-mation on the net radiometers caused a measurement error. An alternative explanation is that actual cloud cover differed between daytime and nighttime, while the model assumes a constant fraction of cloud cover for the whole day. The discrepancy for total downward radiation is attributed to a lack of adequate horizon-tal averaging under the thin canopies with the single fixed miniature net radiometer.
Radiation profiles calculated with the model for the 10 t ha−1 straw mulch show that most of the short-wave radiation is intercepted in the upper 20% of the mulch but that a considerable amount (∼40 W m−2at midday) penetrates to the underlying soil surface be-cause of the clumping between elements, resulting in a net radiation flux density of∼50 W m−2at the soil
re-quires that the radiation model be coupled to a model of heat and mass transfer above and within the mulch.
Acknowledgements
The study was supported by a grant to MDN from the National Science and Engineering Research Coun-cil of Canada. WC was supported by a University of British Columbia Graduate Fellowship and a St. John’s Fellowship. We thank the staff of the UBC Plant Sci-ence Research Station for their help with plot prepa-ration. Mr. Rick Ketler and Dr. Alberto Orchansky as-sisted with instrumentation and monitoring. Dr. Andy Black, Dr. Marie-Claude Fortin, Dr. Douw Steyn, Dr. Kya Tha Paw U, and Dr. Roland Stull provided valu-able suggestions on an early draft of this manuscript.
References
Black, T.A., Chen, J.M., Sagar, R.M., 1991. Characteristics of shortwave and longwave irradiances under a Douglas-fir forest stand. Can. J. For. Res. 21, 1020–1028.
Bristow, K.L., Campbell, G.S., Papendick, R.I., Elliott, L.F., 1986. Simulation of heat and moisture transfer through a surface residue–soil system. Agric. For. Meteorol. 36, 193–214. Bussière, F., Cellier, P., 1994. Modification of the soil temperature
and water content regimes by a crop residue mulch: experiment and modelling. Agric. For. Meteorol. 68, 1–28.
Chen, J.M., Black, T.A., 1991. Measuring leaf area index of plant canopies with branch architecture. Agric. For. Meteorol. 57, 1–12.
Chung, S.O., Horton, R., 1987. Soil heat and water flow with a partial surface mulch. Water Resources Res. 23, 2175–2186. Fritschen, L.J., Gay, L.W., 1979. Environmental Instrumentation.
Springer, New York, 216 pp.
Gregory, J.M., 1982. Soil cover prediction with various amounts and types of crop residue. Trans. ASAE 25, 1333–1337. Hares, M.A., 1988. Effects of mulching on the surface energy
balance and soil thermal regimes. Ph.D. Thesis, University of British Columbia, Vancouver, BC.
Hares, M.A., Novak, M.D., 1992. Simulation of surface energy balance and soil temperature under strip tillage II. Field test. Soil Sci. Soc. Am. J. 56, 29–36.
Idso, S.B., 1980. On the apparent incompatibility of different atmospheric thermal radiation data sets. Q. J. R. Meteorol. Soc. 106, 375–376.
Kreith, F., 1973. Principles of Heat Transfer, 3rd Edition. Harper & Row, New York, 656 pp.
McNaughton, K.G., Spriggs, T.W., 1986. A mixed-layer model for regional evaporation. Boundary-Layer Meteorol. 34, 243– 262.
Norman, J.M., 1979. Modeling the complete crop canopy. In: Barfield, B.J., Gerber, J.F. (Eds.), Modification of the Aerial Environment of Plants. ASAE Monograph Number 2, ASAE, St. Joseph, MI, pp. 249–277.
Novak, M.D., Black, T.A., 1985. Theoretical determination of the surface energy balance and thermal regimes of bare soils. Boundary-Layer Meteorol. 33, 313–333.
Novak, M.D., Chen, W.J., Orchansky, A.L., Ketler, R., 2000a. Turbulent exchange processes within and above a straw mulch Part I. Mean wind speed and turbulent statistics. Agric. For. Meteorol. 102 (2–3), 139–154.
Novak, M.D., Chen, W.J., Orchansky, A.L., Ketler, R., 2000b. Turbulent exchange processes within and above a straw mulch Part II. Thermal and moisture regimes. Agric. For. Meteorol. 102 (2–3), 155–171.
Ross, J., 1976. Radiative transfer in plant communities. In: Monteith, J.L. (Ed.), Vegetation and the Atmosphere, Vol. 1: Principles. Academic Press, New York, pp. 13–55.
Ross, P.J., Williams, J., McCown, R.L., 1985. Soil temperature and the energy balance of vegetative mulch in the semi-arid tropics I. Static analysis of the radiation balance. Aust. J. Soil Res. 23, 493–514.
Shen, Y., Tanner, C.B., 1990. Radiative and conductive transport of heat through flail-chopped corn residue. Soil Sci. Soc. Am. J. 54, 653–658.
Tanner, C.B., Shen, Y., 1990. Solar-radiation transmittance of flail-chopped corn residue layers. Soil Sci. Soc. Am. J. 54, 650–652.
Tanner, C.B., Shen, Y., Saeed, I.A., 1987. Radiation, sensible heat, and vapor transfer in flail-chopped corn residue on the soil surface. Final report, University of Wisconsin, Madison, WI, 170 pp.
Tuzet, A., Perrier, A., Oulid Aissa, A.K., 1993. A prediction model for field drying of hay using a heat balance method. Agric. For. Meteorol. 65, 63–89.
Unger, P.W. (Ed.), 1994. Managing Agricultural Residues. Lewis Publishers, Boca Raton, FL, 448 pp.