NDVI FROM ACTIVE OPTICAL SENSORS AS A MEASURE OF CANOPY COVER AND
BIOMASS
E.M. Perrya,*, G.J. Fitzgeralda, N. Pooleb, S. Craigc, A. Whitlockd a
Department Primary Industries, Future Farming Systems Research, 110 Natimuk Rd. Horsham VIC 3401 Australia - (eileen.perry, glenn.fitzgerald)@dpi.vic.gov.au
b
Foundation for Arable Research, Lincoln 7640 NZ - [email protected] c
Birchip Cropping Group, Birchip VIC 3483 Australia - [email protected] d
Precision.agriculture.com.au - [email protected]
KEY WORDS: Agriculture, Farming, Vegetation, Sensor, Spatial, Real-time
ABSTRACT:
Commercially available proximal sensors are being used in precision agriculture to provide non-destructive, real-time spatial information on ‘green biomass’ that may be of interest to the remote sensing community. The sensors are described as biomass sensors, but questions remain on which canopy characteristics can be best estimated by the sensor measurements. In this study Normalized Difference Vegetation Index (NDVI) measurements from active optical sensors were examined across multiple datasets, representing different active optical sensors, different years, and different sites for wheat and barley. The NDVI values were compared with spatially and temporally coincident measurements of fractional green cover and above ground biomass, expressed as dry matter in kg ha-1. Direct comparison of NDVI measurements from the different sensors for the same plots over a range of canopy cover demonstrates differences for plot means of NDVI. Canopy fractional green cover values were well described by NDVI using a linear model. Using all of the datasets, the linear regression of fractional green cover on NDVI yielded an r2 of 0.71 and a standard error of 0.12. NDVI measured by the sensors did not explain as much of the variance in dry matter as for fractional cover. Dry matter was related to NDVI using a non-linear model. For all sensors, sites and dates with green biomass, the model was fitted with r2 value of 0.27, and standard error of 2133 kg ha-1. The relationship between NDVI and dry matter was nearly linear at levels of biomass less than 1000 kg ha-1. Results for these datasets indicate that the active optical sensors may be a useful surrogate for fractional cover, but not for above ground biomass.
*
Corresponding author.
1. INTRODUCTION
Commercially available proximal sensors are being used in precision agriculture to provide non-destructive, real-time spatial information on ‘green biomass’. These active optical sensors utilise built-in light sources, pulsed to differentiate the artificial signal from sunlight. This gives these sensors a tremendous advantage over passive optical sensors (such as ground-based spectrometers) in that they can be used under any sky conditions, or even in complete darkness. The sensors are described as biomass sensors, but questions remain on what canopy characteristics the sensors best relate to. There is a relevance to the remote sensing community in that these sensors could potentially provide ground truth on fractional ground cover and/or plant biomass. In this study Normalized Difference Vegetation Index (NDVI; Rouse et al. 1973) measurements from active optical sensors were examined across multiple datasets, representing different active optical sensors, different years, and different sites for wheat and barley grown under rainfed conditions.
2. METHODS
Several sites and sensor combinations were used for this study:
•Small plot agronomic trials near Horsham Vic (36° 44’ S latitude, 142° 06’ E longitude) on various cultivars of wheat (Triticum aestivum L) for the years 2007, 2008, and 2010. Two sensor models were used, the Crop Circle ACS-210 and Crop Circle ACS-470 (Holland Scientific Inc, Lincoln NE, USA).
•Large plot agronomic trials near Lubeck VIC (36° 46’ 42” S latitude, 142° 30’ 33” W longitude) on wheat (Triticum aestivum L cv. Derrimut) for 2009 and 2010. Two sensor models were used, the Greenseeker handheld (NTech Industries, Ukiah CA, USA) and Crop Circle ACS-470 (Holland Scientific Inc, Lincoln NE, USA).
•Paddock scale agronomy trials on eight paddocks near Inverleigh VIC (144° 2’ 17” W, 38° 9’ 0” S) on wheat (Triticum aestivum L cv. Derrimut) and barley (H. vulgare L. cv. Gairdner) during 2009 and 2010. A Crop Circle ACS-470 was used to measure NDVI.
Sensor measurements were made throughout the growing season for the Lubeck and Inverleigh trials, and until anthesis (flowering) for the Horsham trials. Sensor measurements were made with the sensor head situated 1 to 1.5 m above the canopy, with the sensor field of view spanning across rows. The NDVI values were either computed from the red and near infrared bands (Holland Scientific sensors) or output directly from the sensor (Greenseeker). Estimates of fractional green cover were made using colour photographs following methods described in Li el al. 2010 for each of the sensor data acquisitions. Above ground biomass (dry matter in kg ha-1) was determined by biomass cuttings for the plots and paddock scale sample locations at key crop growth stages that corresponded with sensor acquisitions. Regression and non linear model fitting were performed using GenStat (Payne et al. 2009).
International Archives of the Photogrammetry, Remote Sensing and Spatial Information Sciences, Volume XXXIX-B8, 2012 XXII ISPRS Congress, 25 August – 01 September 2012, Melbourne, Australia
3. RESULTS AND DISCUSSIONS
3.1 Comparison of NDVI Between Sensors
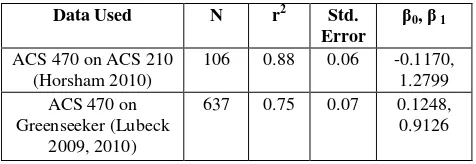
Experiment plot means of NDVI measured by different sensors for the same locations and dates were used to compare the sensors. Table 1 shows results of regression of the ACS 470 sensor NDVI values with the ACS 210 and Greenseeker, based on corresponding plot means. The sensors show linear relationships with high r2 values of 0.89 and 0.75, and standard errors of 0.06 and 0.07 NDVI units. Neither corresponding set of measurements shows a 1:1 relationship, with slopes of 1.3 and 0.91, and offsets of -0.1170 and 1.2799. Given that the measurements were made over the growing season (and a range of dates), these results would indicate systematic differences in the NDVI values generated by the sensors.
Table 1. Regression of NDVI values between sensors
3.2 Comparison of NDVI with Fractional Green Cover
Experimental plot means of NDVI were compared with corresponding values of fractional green cover from photos for each of the sensors over a range of dates. Fig. 1 shows the means for NDVI and fractional green cover with each point in the graph representing an experimental plot mean value. The fractional green cover data were well described by NDVI using a linear model (Table 2). Pooling all of the data with sensor NDVI and corresponding fractional green cover (N=2355 plot means) resulted in an r2 values of 0.70, and a standard error is 0.12 (note fractional cover is unit less). Subsetting the data to include only the stem elongation phase of crop growth, or by considering individual dates, did not drastically alter the results (not shown).
Figure 1. Fractional Green Cover (measured) plotted against the mean NDVI measured by plot, for all datasets (N=2355). The regression fitted yield r2 = 0.70 and a
standard error of fractional cover of 0.12. Note that bare soil plots are included (fractional cover of 0.0).
Table 2. Regression results for fractional green cover on NDVI
3.3 Comparison of NDVI with Above Ground Biomass
Experimental plot means of NDVI and corresponding measured biomass were compared for the three sensors across sites and dates. Fig. 2 shows biomass (dry matter in kg ha-1) measurements and corresponding NDVI means for dates up until flowering, or Zadoks 60 (Zadoks et al. 1974) plotted by sensor. These dates are shown as this would be the maximum amount of green above ground biomass. The measured biomass was fitted to sensor NDVI using a non-linear regression model:
Biomass = 0 + 1*( 2 NDVI
) (1)
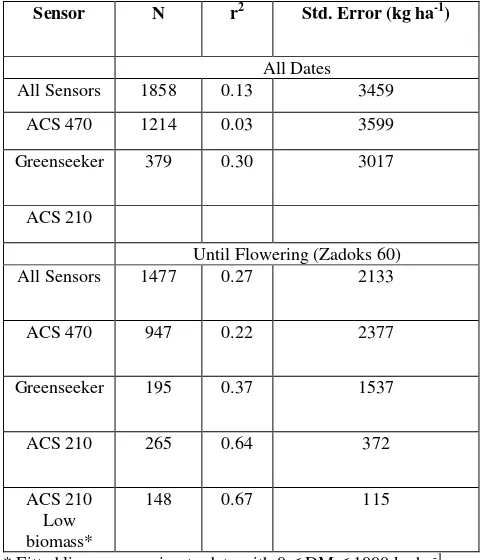
where 0, 1 and 2 represent fitted parameters. The regression results are shown in Table 3. Overall, the sensor NDVI did not explain as much of the variance in biomass as it did for fractional green cover as indicated by the r2 values. Pooling all of the data (N=1858) resulted in an r2 value of 0.13 and standard error of 3459 kg ha-1. For two of the sensors (ACS 470 and Greenseeker) the r2 improved when the data was subset to include dates up until flowering; the ACS 210 Horsham data was only acquired during this phase, so no comparison was available. The ACS 210 Horsham data yielded the highest r2 values for biomass fit to the sensor NDVI. One possible explanation for this result was the close proximity of the sensor measurements and the biomass sampling due to the small experimental plot size.
As can be seen in Fig. 2, the relationship between sensor NDVI and biomass is more linear at low values of biomass. Linear
International Archives of the Photogrammetry, Remote Sensing and Spatial Information Sciences, Volume XXXIX-B8, 2012 XXII ISPRS Congress, 25 August – 01 September 2012, Melbourne, Australia
0 2000 4000 6000 8000 10000 12000
0 0.2 0.4 0.6 0.8 1
Sensor NDVI
B
io
m
a
s
s
,
a
s
D
ry
M
a
tt
e
r
k
g
h
a
-1
ACS 210
ACS 470 Greenseeker
Figure 2. Above ground biomass measured as dry matter kg ha-1 plotted against the mean NDVI measured by plot for all data up to the flowering stage, Zadoks 60 (N=1475). The non linear equation fitted yield r2 = 0.27 and a standard error of 2133 kg ha-1.
Sensor N r2 Std. Error (kg ha-1)
All Dates
All Sensors 1858 0.13 3459
ACS 470 1214 0.03 3599
Greenseeker 379 0.30 3017
ACS 210
Until Flowering (Zadoks 60)
All Sensors 1477 0.27 2133
ACS 470 947 0.22 2377
Greenseeker 195 0.37 1537
ACS 210 265 0.64 372
ACS 210 Low biomass*
148 0.67 115
* Fitted linear regression to data with 0 DM 1000 kg ha-1
Table 3. Regression results for Total Above Ground Dry Matter (kg ha-1) on NDVI
4. CONCLUSIONS
The commercially available active optical sensors are robust and can be used under most sky conditions, so they are of potential interest for ground truth of biomass for various remote sensing applications. The results show a strong linear relation between the sensor NDVI and fractional green cover for a dataset that included three different sensors and multiple sites and dates. However, the relation between measured biomass and sensor NDVI was found to be linear only at low values of biomass (less than 1000 kg ha-1), and non-linear regression resulted in low r2 values for the dataset. Results of the study indicate the sensors may provide good estimates of fractional green cover, although caution should be applied when directly comparing NDVI from different sensors models.
5. REFERENCES
Li, Y., Chen, D., Walker, C.N., Angus, J.F., 2010. Estimating the nitrogen status of crops using a digital camera. Field Crops Research 118(3), pp. 221-227.
Payne, R.W., Murray, D.A., Harding, S.A., Baird, D.B., Soutar, D.M., 2009. GenStat for Windows (12th Edition) Introduction. VSN International, Hemel Hempstead.
Rouse, J.W., Jr., Haas, R. H., Schell, J.A., Deering, D.W, 1973. Monitoring vegetation systems in the Great Plains with ETRS. , Earth Res. Tech. Satellite-1 Symp, Goddard Space Flight Cent., Washington, DC, pp. 309-317.
Zadoks, J.C., Chang, T.T., Konzak, C.F., 1974. A decimal code for the growth stages of cereals. Weed Research 14(6), pp. 415-421.
6. ACKNOWLEDGEMENTS
The authors wish to thank the Grains Research Development Corporation for research funding of multiple projects that supported the data acquisition and analysis of this work. We are also indebted to our grower collaborators who allowed us to work on their farms.
International Archives of the Photogrammetry, Remote Sensing and Spatial Information Sciences, Volume XXXIX-B8, 2012 XXII ISPRS Congress, 25 August – 01 September 2012, Melbourne, Australia