PHASE NOISE INVESTIGATION OF MAXIMUM LIKELIHOOD ESTIMATION
METHOD FOR AIRBORNE MULTIBASELINE SAR INTERFEROMETRY
C. Magnard*, D. Small, E. Meier
Remote Sensing Laboratories, Department of Geography, University of Zurich, CH-8057 Zurich, Switzerland – (christophe.magnard, david.small, erich.meier)@geo.uzh.ch
KEY WORDS: Synthetic aperture radar (SAR), Interferometry, Multibaseline, Maximum likelihood, Phase unwrapping, MEMPHIS, Millimeter wave radar, Ka-band
ABSTRACT:
The phase estimation of cross-track multibaseline synthetic aperture interferometric data is usually thought to be very efficiently achieved using the maximum likelihood (ML) method. The suitability of this method is investigated here as applied to airborne single pass multibaseline data. Experimental interferometric data acquired with a Ka-band sensor were processed using (a) a ML method that fuses the complex data from all receivers and (b) a coarse-to-fine method that only uses the intermediate baselines to unwrap the phase values from the longest baseline. The phase noise was analyzed for both methods: in most cases, a small improvement was found when the ML method was used.
1. INTRODUCTION
Multibaseline cross-track SAR interferometry is an extension of InSAR, whereby multiple baselines combine the advantages of shorter and longer baselines: simple phase unwrapping of interferograms from short baselines and lower sensitivity to phase noise from longer baselines (Rosen, 2000). Many different methods were developed to combine the data from the various baselines. The coarse-to-fine (C2F) phase unwrapping method (Magnard, 2014 and Essen, 2007) uses data from the shorter baselines to unwrap the interferogram based on the longest baseline. This method keeps the unwrapped phase information from the longest baseline, discarding information from the other baselines. The maximum likelihood (ML) method calculates a most-likely phase from arrays of focused SAR data (Single Look Complex data) according to a model (Lombardo, 1997). This allows use of all the data and should therefore improve the noise level and reliability. Several other methods such as least squares or weighted least squares can also be used to calculate the unwrapped phase; they were compared in (Lombardini, 2001), showing their advantages and shortcomings.
A lower phase noise is expected when using a model-based fusion of the complex data from all receiving channels such as that provided by the ML method. However, the effectiveness of the ML method with actual (non-simulated) high resolution single pass multibaseline airborne InSAR data has yet to be demonstrated. Such data have particularities such as dissimilar receiver properties, non-perfectly aligned phase centers, and imperfect motion compensation. On the other hand, issues such as temporal decorrelation or baseline lengths approaching criticality are not present.
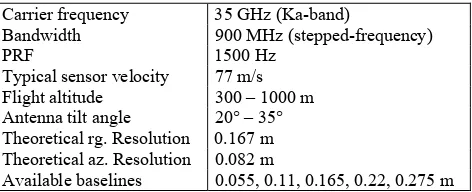
In this study, we used data acquired with the Fraunhofer-FHR MEMPHIS Ka-band single pass multibaseline InSAR system (see Table 1 and Figure 1). The interferometric processing was achieved with a ML method fusing the data from all 4 receiving antennas as well as a C2F method only using the intermediate baselines to unwrap the InSAR data from the longest baseline. The investigated hypothesis that ML method results in a lower phase noise than C2F method was tested using flat verification areas.
Carrier frequency 35 GHz (Ka-band)
Bandwidth 900 MHz (stepped-frequency)
PRF 1500 Hz
Typical sensor velocity 77 m/s Flight altitude 300 – 1000 m Antenna tilt angle 20° – 35° Theoretical rg. Resolution 0.167 m Theoretical az. Resolution 0.082 m
Available baselines 0.055, 0.11, 0.165, 0.22, 0.275 m
Table 1. MEMPHIS SAR system parameters.
Figure 1. MEMPHIS Ka-band interferometric antenna. E1, E2: transmit horns, R1–R4: receive horns. Only one transmit horn can be used at a time.
2. METHOD
MEMPHIS SAR data focusing was detailed in (Magnard, 2014). The raw data from each chirp are first separately range compressed through a matched filtering method using a chirp replica. A stepped-frequency processing combines the 8 separate and partially overlapping 200 MHz bandwidths into a single 900 MHz bandwidth (outlined in Lord, 2000) and the azimuth focusing is achieved with an Extended Omega-K algorithm (Reigber, 2006). The azimuth focusing includes a range- and topography-dependent motion compensation using the beam center approximation.
It results in single look complex (SLC) data with a resolution of ~17 cm in range and ~10 cm in azimuth. The interferometric processing using both ML and C2F methods is presented below.
2.1 Interferometric processing
The InSAR processing method starts from the 4 previously generated SLCs. An elevation angle dependent phase correction using antenna phase patterns is applied to correct for systematic phase errors. Due to the short range distance and low flying altitude, the beam elevation varies significantly depending on the ground topography. An iterative processing method is therefore required: an approximate elevation angle is used in the first loop; the result from the first iteration allows a more accurate calculation of the elevation angle that is used in the next loop.
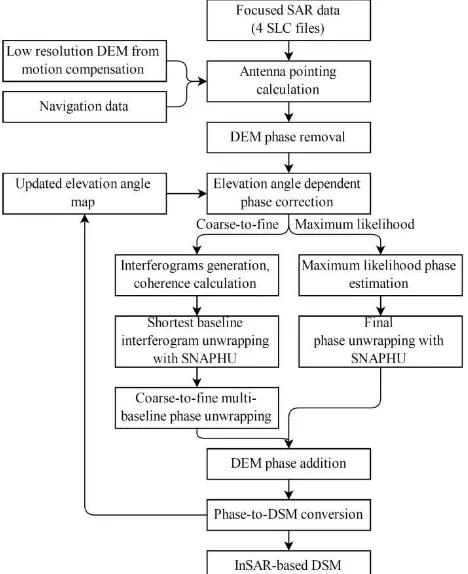
The InSAR processing chain using both ML and C2F methods is summarized in Figure 2.
Figure 2. Block diagram of the InSAR processing chains for both C2F and ML methods.
First, the antenna pointing is estimated using the navigation data and a coarse resolution digital elevation model (DEM).
The phase corresponding to this DEM is subtracted from each SLC to simplify the phase unwrapping. An elevation angle dependent phase correction is simultaneously carried out using the antenna elevation phase patterns.
The unwrapped phase is then calculated using C2F or ML phase estimation.
The phase corresponding to the coarse DEM is added back. The data are converted into a point cloud in Cartesian
coordinates and transformed / resampled into a digital surface model in local map coordinates.
An iterative process has to be used to ensure that accurate values are available for the elevation angle phase correction. In a second iteration, the elevation angle calculated in the first iteration is used.
2.2 Antenna pointing estimation
The antenna pointing calculation can be summarized as follows. Using the original, non-linearized navigation data (position, velocity and attitude information), we compute the intersection between (a) a plane perpendicular to the sensor roll axis passing through the sensor position and (b) the DEM used in the motion compensation. The range distance corresponding to the current sample and the beam look orientation (right or left) constrain the intersection to a single point. The resulting Cartesian coordinates are then backward geocoded (Meier, 1993) using the linearized flight track calculated in the motion compensation. This yields their range and azimuth positions in the focused SAR image. Finally, the relationship is inverted: a look up table is generated with the range/azimuth coordinates of the focused SAR image as input and the azimuth receive time and beam elevation as outputs.
2.3 Elevation angle dependent phase correction
The uncorrected interferometric phase contains systematic errors that depend on the backscatter position relative to the beam center. An elevation angle dependent phase correction is applied to compensate for these errors, using antenna phase patterns (see Figure 3). This correction is applied to each slave receiver separately as follows:
A, j′ A, j corrected phase and corr, XY j the phase correction calculated for the channel X and Y combination. All phase corrections were calculated depending on the elevation angle j.
Figure 3. Relative elevation angle dependent phase correction curves for channels B, C and D. 0° corresponds to the beam center. Negative elevation angle values are below the beam center, while positive values are above the beam center.
For the first loop of the algorithm, the antenna pointing described above combined with the known beam center depression angle provide the elevation angle for each pixel. In subsequent loops, the elevation angle is recalculated based on the results from the previous loop, yielding a more accurate phase correction.
2.4 Coarse-to-fine method
The coarse-to-fine approach is detailed in (Magnard, 2014). It begins with calculation of the interferograms computed from SLC pairs. The interferogram generated from the shortest baseline/largest ambiguity height is first unwrapped with the SNAPHU algorithm (Chen, 2001). The interferograms with longer baselines are then sequentially unwrapped using progressive integration of information from the previously unwrapped interferograms. Table 2 summarizes MEMPHIS available baselines and corresponding ambiguity heights.
Receiving Horns Baseline [m] Ambiguity Height [m] R1, R2 B1 = 0.055 208.41 R2, R3 or R3, R4 B2 = 0.11 104.21 R1, R3 B3 = 0.165 69.47 R2, R4 B4 = 0.22 52.1 R1, R4 B5 = 0.275 41.68
Table 2. Available baselines and corresponding typical ambiguity heights. Values at mid-range (1547 m), sensor altitude: 770 m, depression angle: 30°.
2.5 Maximum likelihood method
The maximum likelihood phase estimation uses the model presented in (Lombardo, 1997). This method assumes that all phase centers are perfectly aligned. The interferometric phase from pairs of MEMPHIS SAR data show constant phase offsets, contradicting this alignment assumption. Constant phase offsets were therefore estimated from the data and corrected on the slave SLCs before performing the ML estimation.
For each interferogram cell, the corresponding area is selected from each SLC, forming a vector of 4 matrices. The size of the matrices corresponds to the number of looks. This vector can be characterized as a complex Gaussian random vector with zero mean and covariance matrix C (Rodriguez, 1992). The covariance matrix is estimated from the data. The interferometric phase is then calculated as the position of the maximum of the logarithmic likelihood function.
3. RESULTS
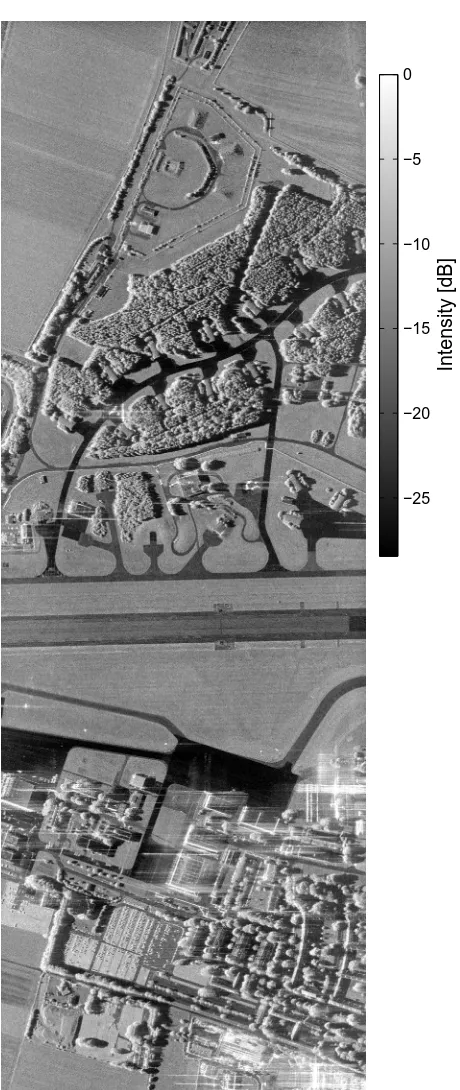
The data used for this investigation were 6 acquisitions (M1-M6) made with the MEMPHIS sensor in 2011 at Memmingen, Germany. The interferometric processing was achieved on all 6 acquisitions as described above with both ML and C2F methods, using different numbers of looks, as listed in Table 3. An intensity image of acquisition M4 is shown in Figure 4.
Range looks
Azimuth looks
Range pixel spacing [m]
Azimuth pixel spacing [m]
1 4 0.167 0.207
2 8 0.333 0.414
3 12 0.500 0.621
4 16 0.666 0.828
5 20 0.833 1.035
6 24 0.999 1.242
10 40 1.665 2.070
Table 3. Number of looks tested in the interferometric processing. The azimuth pixel spacing corresponds to the average over the 6 tested datasets at Memmingen.
Figure 4. Intensity image of acquisition M4 in range-azimuth geometry. Azimuth and slant range extent: 2.1 x 0.6 km. Intensity scaled relatively: 28.4 dB black to white.
3.1 Elevation angle dependent phase correction
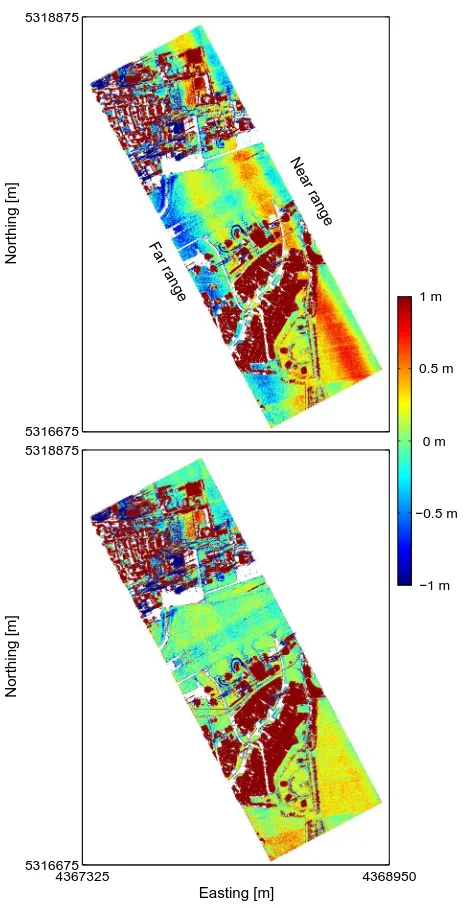
A result from the elevation angle dependent phase correction is shown in Figure 5. In that case, the phase corrections resulted in height rectifications ranging from -0.4 m to +0.5 m. Wave-like deviations oriented along the range direction are clearly visible on the uncorrected image, with a predominant overshooting in near range (yellow-red) and an undershooting in far range (blue).
Intensity [dB]
−25 −20 −15 −10 −5 0
Figure 5. Height difference between the InSAR DSM calculated from acquisition M4 and an airborne laser scanning (ALS) DTM, without (top) and with (bottom) elevation angle dependent phase correction (C2F method). White areas are areas with low coherence. Coordinate system: German Gauss-Krüger strip 4, elevation over DHHN92 reference (Deutsches Haupthöhennetz 1992—German mean height reference system 1992).
3.2 Phase noise comparison from ML and C2F methods
The noise level was compared between results from C2F and ML processing chains. For this, flat verification areas were selected, such as the one shown in Figure 6. These areas were approximately the size of football fields and located at different range distances. Their flatness was verified using airborne laser scanning data, which showed a standard deviation of ~0.072 m.
Figure 6. Height calculated through the ML InSAR processing for acquisition M4. The red rectangle shows one of the flat verification areas.
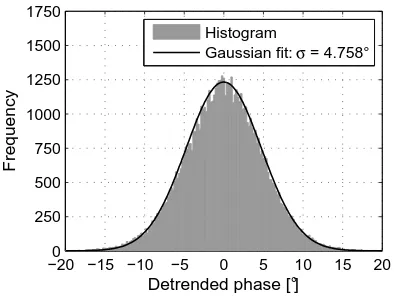
The height standard deviation depends directly on the range distance, and is related to the local ambiguity height. The heights were first converted back into phase values to aggregate the data from various range distances. Histograms of the phase were generated and normal distribution curves were fit to these histograms, as shown in Figure 7.
Northing [m]
Near range
Far range 5318875
5316675
−1 m −0.5 m 0 m 0.5 m 1 m
Easting [m]
Northing [m]
4367325 4368950
5318875
5316675
620 m 625 m 630 m 635 m 640 m 645 m 650 m
Figure 7. Distribution of the detrended phase for 3 range and 12 azimuth looks (0.5 x 0.621 m sample interval), using the ML method. All verification areas were combined to produce the figure. The histogram used a 0.2° bin width.
The results are summarized in Figure 8. For each number of looks tested, the figure shows the measured standard deviation of the interferometric phase for both ML and C2F in a loglog scale. It also displays the phase noise estimated via Cramer-Rao bound (Rodriguez, 1992).
Figure 8. Noise comparison between C2F and ML methods. These values correspond at mid-range to ~1.5 m with 4 looks down to ~0.2 m with 400 looks.
A statistical analysis was carried out: with 4 looks, the results using the C2F method showed a marginally lower phase noise than those using ML phase estimation. With more looks, the ML phase estimation delivered consistently better results: noise variance using the C2F method was steadily ~1.05 times larger than the noise variance using the ML method. While very close, all such differences were found to be statistically significant at a 5% significance level.
4. CONCLUSIONS
ML phase estimation was demonstrated to be appropriate for InSAR processing of single pass high resolution multibaseline airborne data. Careful calibration steps were necessary to make the data fit the ML model assumptions. For example, an elevation angle dependent phase correction was applied for each slave channel.
The results were found to be very close between the C2F and ML methods. With only 4 looks, the noise level was marginally better with the C2F approach. However, with more looks, the noise variance with the C2F approach was slightly but steadily larger than the noise variance obtained using the ML method. These results were found to be statistically significant, confirming the hypothesis stated in the introduction that ML method results in a lower phase noise than C2F method.
Outliers were discarded from the data to compute the phase standard deviation. They were mostly found when using low numbers of looks. These outliers will be further studied, including their distribution and their dependency on the processing method, the local coherence, and the number of looks.
REFERENCES
Chen, C.W., 2001. Statistical-Cost Network-Flow Approaches to Two-Dimensional Phase Unwrapping for Radar
Interferometry. PhD Thesis, Department of Electrical
Engineering, Stanford University.
Essen, H., Brehm, T., Boehmsdorff, S., and Stilla, U., 2007. Multibaseline Interferometric SAR at Millimeterwaves, Test of an Algorithm on Real Data and a Synthetic Scene. In:
Proceedings of SPIE, vol. 6746.
Lombardini, F., and Griffiths, H.D., 2001. Optimum and Suboptimum Estimator Performance for Multibaseline InSAR.
In: EUSAR 2000 Special Issue, Frequenz, Zeitschrift für
Telekommunikation, vol. 55, pp. 114-118.
Lombardo, P., and Lombardini, F., 1997. Multibaseline SAR Interferometry for Terrain Slope Adaptivity. In: IEEE Proc.
Nat. Radar Conf. 1997, pp. 196-201, New York.
Lord, R.T., 2000. Aspects of Stepped-Frequency Processing for
Low-Frequency SAR Systems. PhD Thesis, Department of
Electrical Engineering, University of Cape Town, Rondebosch, South Africa.
Magnard, C., Frioud, M., Small, D., Brehm, T., Essen, H., and Meier, E., 2014. Processing of MEMPHIS Ka-Band Multibaseline Interferometric SAR Data: From Raw Data to Digital Surface Models. In: IEEE JSTARS, vol. 7, issue 7, pp. 2927-2941.
Meier, E., Frei, U., and Nüesch, D., 1993. Precise Terrain Corrected Geocoded Images. In: Schreier G. (ed.) SAR
Geocoding: Data and System. Wichmann, pp. 173-186.
Reigber, A., Alivizatos, E., Potsis, A., and Moreira, A., 2006. Extended wavenumber-domain synthetic aperture radar focusing with integrated motion compensation. In: IEE
Proceedings Radar, Sonar and Navigation, vol. 153, issue 3,
pp. 301-310.
Rodriguez, E., and Martin, J., 1992. Theory and design of interferometric synthetic aperture radars. In: Radar and Signal
Processing, IEE Proceedings F, vol. 139, no. 2, pp. 147-159.
Rosen, P.A., Hensley, S., Joughin, I., Li, F.K., Madsen, S.N., Rodriguez, E., and Goldstein, R.M., 2000. Synthetic Aperture Radar Interferometry. In: Proceedings of the IEEE, vol. 88, no. 3, pp. 333-381. Est. from Cramer Rao bound