RIVER MAINTENANCE MANAGEMENT SYSTEM USING THREE-DIMENSIONAL
UAV DATA IN JAPAN
Satoshi Kubota a, Yuki Kawai b
a Faculty of Environmental and Urban Engineering, Kansai University, [email protected] b Graduate Student of Science and Engineering, Kansai University, [email protected]
KEY WORDS: riveradministration facilities, UAV, three-dimensional data
ABSTRACT:
River administration facilities such as levees and river walls play a major role in preventing flooding due to heavy rain. The forms of such facilities must be constantly monitored for alteration due to rain and running water, and limited human resources and budgets make it necessary to efficiently maintain river administration facilities. During maintenance, inspection results are commonly recorded on paper documents. Continuous inspection and repair using information systems are an on-going challenge. This study proposes a maintenance management system for river facilities that uses three-dimensional data to solve these problems and make operation and maintenance more efficient. The system uses three-dimensional data to visualize river facility deformation and its process, and it has functions that visualize information about river management at any point in the three-dimensional data. The three- dimensional data is generated by photogrammetry using a camera on an Unmanned Aerial Vehicle.
1. INTRODUCTION
Levees and coastal revetments prevent flooding due to heavy rains or typhoons. Deformation of river administration facilities due to rain and running water should be monitored. Recently, there has been increasing recognition of the importance of river administration facilities and their maintenance. Limited human resources and budget make it necessary to efficiently maintain river administration facilities.
Inspection results are generally recorded as paper records, hindering prompt updates and daily use in operations. There is a need for computerizing these records and accumulating them as a database. River administrators create inspection manuals, and river administration facilities vary according to the features of each river. Inspections should thus be performed after grasping the features of each river. Failure to accumulate historical data related to inspection results will result in river administrations with an insufficient grasp of river features. It is thus necessary to allow for immediate and accurate reference to accumulated inspection data. Remy et al., 2004 state that France counts several thousand kilometers of flood-protection levees. However, the majority of these levees are very old and they are managed by municipalities or individuals. So, huge amount of dates are lost such as history of repair. Therefore, systems which accumulate data related river management are needed. In current maintenance work, river administration facilities are shown on two-dimensional maps, which are not suitable for grasping river forms. Representing river forms as three- dimensional data allows recording maintenance information at any point in the data. River administrators can furthermore refer the shape of river administration facilities from various points of view.
Using three-dimensional data will thus improve the efficiency of operations and maintenance. In river maintenance, it is necessary to construct an environment that manages three- dimensional data and maintenance information.
A river management system is composed of functions for planning, design, construction, maintenance, and rehabilitation of rivers. A fundamental requirement of such a system is the ability to support the modeling and management of design and construction information and to enable the exchange of such information among different project disciplines in an effective
information related to the river is generated, including spatial information, such as geographical and positional attributes, and temporal information (Fisher and Kunz, 1995, 2004; Fisher and Kam, 2002).
This study proposes a river maintenance management system that uses three-dimensional data to solve these problems and efficiently conduct operations and maintenance. The research was conducted at the Kishiwada civil engineering office on the Kashiigawa River in Osaka Prefecture, Japan.
2. RELATED RESEARCH
Using existing plane figures and lateral profiles, Fujita et al., 2015a and Machida et al., 2013 constructed three-dimensional data for use in river structure construction and maintenance. Unlike these studies, the present study uses Unmanned Aerial Vehicle (UAV) to construct three-dimensional data. Fujita et al., 2015b and Yoshida et al., 2015 calculated river deformation and maintenance efficiency using point cloud data. These studies used point cloud data only for showing river shapes and their changes. Tanaka et al., 2015 proposed a visualization environment that uses point cloud data of rivers for maintenance. This study uses three-dimensional data not only for grasping river shapes, but also for recording inspection results. Currently, it can be difficult to find inspection points, because inspection results are recorded on two-dimensional maps. Inspection results recorded in three-dimensional data allow river administrators to better grasp inspection points at any place. Damien et al., 2006 and Pierre et al., 2004 assessed levee condition and registered the result on GIS. And a system which indicates and locates the most critical levee sections which shall be upgraded and maintained in priority. However, these are consideration as two-dimensional. As described above, use of three-dimensional data is important.
3. PROBLEM ANALYSIS OF RIVER MAINTENANCE WORK
This section analyzes the inspection manual of Osaka Prefecture (Civil Engineering Division of Osaka Prefecture, 2015) and the results of interviews with river administrators. ISPRS Annals of the Photogrammetry, Remote Sensing and Spatial Information Sciences, Volume IV-2/W1, 2016
Figure 1. River administration facilities[Yamatogawa River Office, 2015]
3.1 River Administration Facilities
River administration facilities stabilize river flow rates and water levels to prevent flood damage. Figure 1 shows an example of a river administration facility. By Japanese law, river administration facilities include dams, weirs, levees, coastal revetments, water gates, ground sills, trees belts for flood disaster prevention, and other facilities. Coastal revetments are structures that prevent the erosion of levees and riverbanks. Water gates are structures for drainage and prevention of reverse flow. Groundsill structures prevent riverbed erosion.
3.2 River Inspection Manual
River inspection manuals are used to maintain rivers accurately and efficiently. The river inspection manual summarizes items, contents, and methods needed to carry out inspections. Prefectural standards guide inspection of river administration facilities and their repair. Generally, inspections based on the river inspection manual are performed once a year through visual inspection. Inspection targets include levees, coastal revetments, sluice pipes, groundsills, and river channels. If abnormalities or deformations are discovered, the inspector takes photographs, makes notes in a field book, and measures any shape changes. Photographs depict deformations as distant and close-up views. Deformation details include characteristics of riverbed slopes, levees, coastal revetment shapes, and inspection years.
3.3 Interview Results
To grasp current river inspection methods and to identify problems, we interviewed two administrators in the river management division of the Kishiwada civil engineering office, Osaka Prefecture. Questions and responses were as follows:
zWhat is the most important aspect of river maintenance work?
Constantly monitoring river shape deformation of particular importance is inspecting sediment accretion and deformation of levees and coastal revetments.
zHow are inspection results recorded?
Inspection results are recorded on paper documents. Information systems for recording results exist in their office, but remain unused due to usability problems. Recorded inspection results in the system are not referenced prior to inspections.
zHow do inspectors identify onsite inspection points? Inspections are based on locations roughly identified on a map. However, identification requires significant time, because inspections are conducted using two-dimensional maps and pictures.
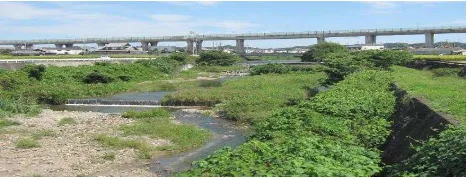
Figure 2. Measurement site
3.4 Problems in river maintenance work
Inspection results are recorded as locations, photographs, and descriptions on two-dimensional maps to grasp abnormalities and shape deformations. It is clearly important in maintenance work that inspections regard facility deformations by analyzing the inspection manual and interview results. River records of the Japanese Ministry of Land, Infrastructure, Transport and Tourism also seriously regard deformation. It is thus important to easily identify deformations. Because current river administration and management is based on two-dimensional maps, it is difficult to grasp the current form and deformation of facilities.
In addition, inspection results are not fully computerized for reference during inspections, and the river records of the Ministry of Land, Infrastructure, Transport and Tourism are not accumulated as a database.
4. CONSTRUCTION OF THREE-DIMENSIONAL DATA
USING UAV
An UAV was used to survey river administration facilities. Three-dimensional data for the Kashiigawa River were constructed using the Structure from Motion (SfM) range-imaging technique. The measuring range is about 50 meters width, and 150 meters length. Figure 2 shows the Kashiigawa River.
4.1 UAV Measurement of River Administration Facilities
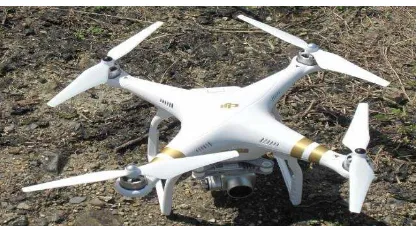
A DJI Phantom3 Professional UAV (Figure 3) was used to measure the river administration facility. This is a small, inexpensive and easy to operate UAV. Table 1 shows specifications of the Phantom3 Professional, and Table 2 shows specifications of its camera. In Japan, usage of UAVs in urban areas requires submission and approval of flight plans, so the
UAV’s flight plan for surveying the Kashiigawa River was
submitted to the Kishiwada civil engineering office and approved before flight.
Figure 3. Phantom3 Professional UAV
Weight 1,280g
Diagonal scale 590mm Rising speed 5m/s Descent speed 3m/s
Accuracy of hovering Vertical:+/-0.1m Horizontal +/-1m
Max speed 16m/s
Flite time About 23 minutes Table 1. UAV specifications
Sensor Sony Exmor 1/2.3” 12.4 pixel Max image size 4,000×3,000 pixel
Table 2. UAV camera specification
Figure 4. Flight route
Figure 5. Three-dimensional point cloud data made of Kashiigawa River
4.2 Construction of Three-Dimensional Data by SfM
SfM is a range-imaging technique that constructs three-dimensional data of an object from images taken from various
Figure 6. Point cloud data and camera position
This software can construct three-dimensional point cloud data in the .psz file format from photographs.
The three-dimensional data was created as follows:
1) An operator takes videos of river administration facilities using the UAV.
2) Images are extracted from the video using the VirtualDub video editing software.
3) SfM is performed using PhotoScan from the images obtained in step 2).
In step2), 344 images were extracted from about 4 minutes and 1.6GB file size of video. Figure 5 shows three-dimensional point cloud data of the Kishiwada River. Using a computer with an Intel Core i7-4790 4GHz CPU, 32GB memory, and 2GB video memory, it took about 10 hours to generate point cloud data with 25,248,632 points and 1.01GB file size. Highly accurate point cloud data was thus generated using only 344 images. Figure 6 shows point cloud data and camera position in blue.
5. PROPOSAL OF RIVER MAINTENANCE SYSTEM
5.1 Objective of System
There are two problems in current river maintenance work: insufficient management of inspection results and maintenance based on two-dimensional maps. We propose a river maintenance management system that uses three-dimensional point cloud data. Inspection results can be referenced at any three-dimensional point. Inspection location points can be accumulated as a database to link inspection results with three-dimensional data.
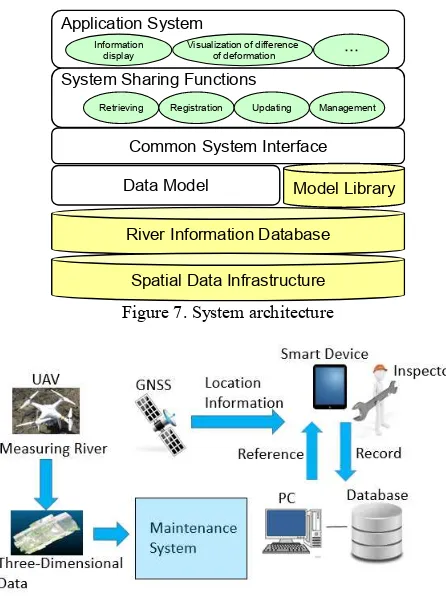
5.2 System Architecture
A river maintenance management system was constructed to allow those engaged to collect, store, share, and use three-dimensional information consisting of spatial and temporal attributes. As shown in Figure 7, the river maintenance management system consists of a spatial data infrastructure, a river information database, data models, a model library, a common system interface, system sharing functions, and application systems. The system is structured so that new information items and system functions can be added in the future using the common system interface and data models. The spatial data infrastructure includes fundamental map data consisting of spatial attributes that include geographical information, location information, and three-dimensional spatial information including elevation. It is consisted of point cloud data in three-dimension. It is necessary to develop a better way to exchange three-dimensional model data electronically between applications (Hartmann et al., 2008). The river ISPRS Annals of the Photogrammetry, Remote Sensing and Spatial Information Sciences, Volume IV-2/W1, 2016
River Information Database
Spatial Data Infrastructure
Figure 7. System architecture
Figure 8. System architecture
life cycle of a river in the form of data models. Data models enable the exchanging and sharing of river information among those involved in river maintenance. The data models were defined by specifying the functions required for carrying out river management, extracting and defining the information to satisfy those functions, and by producing diagrams of the attributes of that information, associations between the information, and the structure of the inheritance hierarchy. The common system interface provides functions for sending and receiving requests and results for the management system and model library, the river database, and the spatial data infrastructure, as well as sending, receiving, and displaying data. The system sharing functions allow the sharing of information with social infrastructure systems, and allow data searching, registration, updating, and management. The application systems provide a information display function and a visualization of difference of deformation function. In the future, the system will include various functions for river management, such as an inspection support function and a degradation diagnostic function.
System users are river administrators and inspectors. Figure 8 shows the system deployment. Inspectors record results in the system on site using a smart device, and can refer to inspection results using a computer in their office or a smart device when on site. They record inspection results and the location of damage or deformations using the Global Navigation Satellite System (GNSS). The point cloud data of this system at different measurement times are controlled and brought into registration of this database based on ground control points using GNSS. According to our other experiments, GNSS has sufficient accuracy. However, it is necessary to verify the accuracy under the environment of the lack of GNSS satellites and ambient surrounding.
Figure 9. Information accumulated in the system
Figure 10. Point cloud data in TerraDeveloper
5.3 River Maintenance Information Accumulated in System
River maintenance information of the system was analyzed and organized based on analysis of current maintenance work. Figure 9 shows the class diagram information using the Unified Modelling Language (UML). Main inspection targets are river channels, coastal revetments, levees, sluice pipes, and groundsills, based on inspection manuals. These facilities have detailed information regarding inspection location points, details of target abnormalities and deformations, distant and close-up photographs of the target, deformation scale, and characteristics. Other characteristics include riverbed slopes, levee shapes, coastal revetment shapes, and year of construction.
5.4 System Development
This system was developed using the TerraDeveloper (Skyline Software Systems) three-dimensional GIS software package which can read three-dimensional point cloud data. Figure 10 shows point cloud data in TerraDeveloper. Provided software APIs allow system developers to create their own functions. The development environment in this study was Microsoft Visual Studio2013 and the C# language.
5.5 System Functions
The system has four main functions: 1) Information display
The information display function retrieves information from the river database and the spatial data infrastructure, and displays the results. The user requests the information, downloads the retrieved results, and stores them on their computer. The information is four-dimensional information to represent three-dimensional point cloud data and temporal information of river maintenance.
2) Input of inspection results
The system allows input of river maintenance information (Figure 9) at any points in the three-dimensional data. When the user clicks any points of three-dimensional data, the input function is displayed. The user inputs inspection location points, contents of abnormality, photographs of distant and close view and scale of deformation and the data are registered in the three-dimensional data. TerraDeveloper can get the coordinates of the position. So, the user can resister data at any points. The data which registered are accumulated in the database.
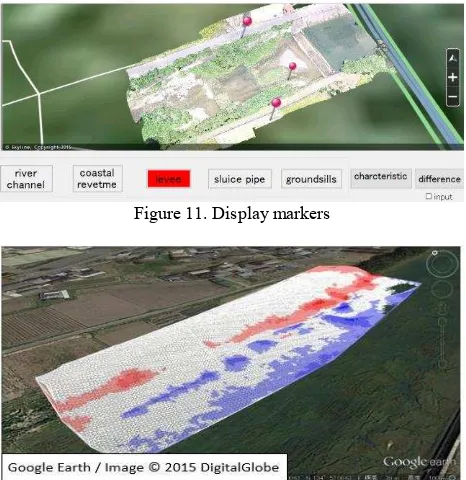
3) Reference of inspection results
When inspection results are input, the data is accumulated in the database and markers indicate the location where data was inputted (Figure 11). When the marker was clicked, inspection location points, contents of abnormality, photographs of distant and close view and scale of deformation which inputted in the location were displayed.
4) Visualization of difference of deformation
This function compares two three-dimensional datasets at different measurement times to visualize deformation. In the example shown in Figure 12, blue indicates increasing amounts of sediment and red indicates decreasing amounts of sediment. At the time of measurement using UAV, datum points are put and measured the coordinate. It is possible to give geodetic coordinates to three-dimensional data. So, it is possible to superimpose two of three-dimensional data.
By function1) and 2), Inspection location points can be accumulated as a database to link inspection results with three-dimensional data. By function3), the deformation of river can be grasped rapidly.
Figure 11. Display markers
5.6 Demonstration of the System
The authors demonstrated the feasibility and operation of the system by using actual data to validate that the system handles the actual volume of data and works as design intended in river maintenance. The demonstration data was about 1.01 GB of Kashiigawa River. The data include information on the shape of river channel, coastal revetment, levee, sluice pipe, and groundsills, as well as information on inspection plans and results, repair decisions, repair results, and attachments. The system was confirmed to handle the actual volume of data and to work as intended in the system architecture design. Therefore, the system has the capability to be applied in practice.
This system can be used to visually explain a construction project to citizens and project participants. The river administrators can share the information stored in the river database with workers carrying out maintenance operations. Therefore, difference of deformation can be used to compare three-dimensional shapes before and after modifications in disaster.
The system, because it handles historical information, is applicable to river work management. The application of three-dimensional models to the analysis of maintenance operations has been successful in supporting maintenance managers to communicate operational sequences to the various project stakeholders. Three-dimensional data and maintenance information can improve the reliability of schedules generated in the repair and rehabilitation phase, which enables a smooth progression of construction activities. Visual representation of the construction sequence is expected to help industry practitioners in better understanding the schedule. Three-dimensional construction and maintenance visualization can help project participants proactively manage a project through an improved understanding of the maintenance plan. However, there are barriers to implementing the proposed system in a municipal or state river maintenance department where ontology and vernacular are different from those in the proposed system. Accordingly, the system would need to be modified to account for such differences and differences in departmental culture.
6. CONCLUSION
A river maintenance management system that uses three-dimensional data to efficiently and accurately maintain rivers was proposed. First, problems related to maintenance work and information were analyzed through interviews with domain experts. Second, three-dimensional point cloud data of the Kashiigawa River were constructed using photographs obtained by an UAV and SfM software. Third, a system was proposed based on the three-dimensional GIS concept. In future, the system will be implemented and evaluated.
REFERENCES
Civil Engineering Division of Osaka Prefecture, 2015. River inspection manual (in Japanese).
Damien, S., Pierre, M., Laurent, P., and Youssef, D., 2006. A Spetial Decision Support System to Optimize Inspection, Maintenance and Reparation Operations of River Levees, Joint International Conference on Computing and Decision Making in Civil and Building Engineering, pp. 173-182.
information technology in construction, Center for Integrated Facility Engineering Technical Report, No. 156.
Froese, T. and Rankin, J. H., 2009. Strategic roadmaps for construction innovation: assessing the state of research, Journal Information Technology in Construction (ITCon), Vol. 14, pp. 400-411.
Fujita, Y., Hoshino, Y. Kobayashi, I., and Mizuno, J., 2015a. Consideration for River CIM Management Model Using Combination of Various Existing Data, Journal of Japan Society of Civil Engineers Division F3: Civil Engineering Informatics, Vol. 71, No. 2, pp. 1_79-1-86 (in Japanese). Fujita, Y., Hoshino, Y., Kobayashi, I., and Nagasaki, R., 2015b. Construction of Sediment Calculation System Using Point Cloud Data, Proceedings of the 40th Symposium on Civil Engineering Informatics, pp. 133-136 (in Japanese).
Hartmann, T., Gao, J., and Fischer, M., 2008, Areas of application for 3D and 4D models on construction projects,
Journal of Construction Engineering and Management, Vol. 134, No. 10, pp. 776-785.
Kubicki, S., Guerriero, A., and Johannsen, L., 2009. A service-based innovation process for improving cooperative practices in AEC, Journal Information Technology in Construction (ITCon), Vol. 14, pp. 654-673.
Machida, Y., Sakai, T., Mihira, Y., and Sato, H., 2013. Three-dimensional imaging of river structures and construction of database, Proceedings of River Information Symposium, pp. 6-1-6-6 (in Japanese).
Pierre, M., Damien, S., and Remy, T., 2004. Towards a Generic GIS for Dike Management in Flood Plain Areas: from Conceptual Design to Real Applications, 7th AGILE Conference on Geographic Information Science, pp 73-81.
Remy, T., Boris, T., and Pierre, M., 2004. A SIRS for Flood
Protection Dikes Management: from User’s Needs to
Application, Cemagref Editions.
Tanaka, S., Kubota, S., Imai, R., Nakamura, K., and Sakurai, J., 2015. Visualization Environment of River Maintenance Using Three-dimensional Point Cloud Data, Proceedings of the 40th Symposium on Civil Engineering Informatics, pp. 91-94 (in Japanese).
Yamatogawa River Office., https://www.kkr.mlit.go.jp/yamto/ about/glossary/21.html (11 Nove. 2015)