SHEET METAL FORMING
PROCESSES AND DIE DESIGN
VUKOTA BOLJANOVIC, Ph.D.
Doctor in Technical Science
Library of Congress Cataloging-in-Publication Data Boljanovic, Vukota.
Sheet metal forming processes and die design / Vukota Boljanovic. Includes bibliographical references and index.
p. cm.
ISBN 0-83 1 1-3 182-9
1 . Sheet-metal work. 2. Dies (Metal-working) I. Title. TS250.B8 15 2004
6 7 1 . 8 ’ 2 3 4 ~ 2 2
Industrial Press Inc. 200 Madison Avenue New York, New York 100 16
Copyright 0 2004. Printed in the United States of America. All rights reserved. This book or parts thereof may not be reproduced,
stored in a retrieval system or transmitted in any form without the permission of the publisher.
10 9 8 7 6 5 4 3 2
To my children Vanju and Sashu,
Preface
List of Tables
Introduction
Basic Characteristics of Sheet-Metal Forming Processes Categories of Sheet-Metal Forming Processes
Characteristics of Sheet-Metal Parts and Their Technological Properties
PART I THEORETICAL FUNDAMENTALS
Chapter 1 1.1 1.2 1.3 1.3.1 1.3.2 1.3.3 1.4
Chapter 2 2.1 2.2 2.3 2.4
The Structure of Metals Introduction
The Crystal Structure of Metals
Deformation and the Strength of Crystals Imperfections in the Crystal Structure of Metals Grain Sizes and Boundaries
Strain Hardening
Recovery and Recrystalization
Mechanical Behavior of Materials Introduction
Stress / Strain Curves Ductility
True Stress and True Strain
PART ZI MANUFACTURING PROCESSES Chapter 3
3.1 3.2 3.2.1 3.2.2 3.3.3
Chapter 4 4.1 4.2 4.3 4.3.1
Shearing Process Mechanics of Shearing Shearing Forces
Shearing with Straight Parallel Cutters Shearing with Straight Inclined Cutters Shearing with Rotary Cutters
Blanking and Punching
Blanking and Punching Mechanism Blanking and Punching Clearances Punch Force
Punch and Die with Parallel Cut Edges
viii
'I Table of Contents 4.3.2 4.4 4.4.1 4.4.2 4.4.3 4.4.4 4.5 4.5.1 4.5.2Chapter 5 5.1 5.2 5.3 5.3.1 5.3.2 5.4 5.4.1 5.4.2 5.4.3 5.4.4 5.4.5 5.5 5.5.1 5.5.2 5.6 5.7 5.8
Chapter 6 6.1 6.2 6.2.1 6.3 6.3.1 6.3.2 6.4 6.5 6.5.1 6.5.2 6.6
Punch and Die with Bevel-cut Edges Material Economy
Scrap Strip Layouts
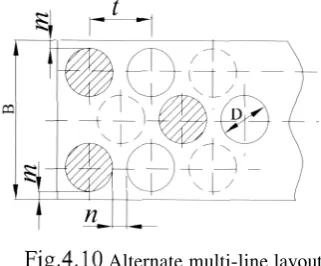
Altering the Design of the Workpiece Multi-line Layout
Utilizing Scrap from One Piece as Material for Another Piece Shaving
Shaving a Punched Workpiece Shaving a Blanked Workpiece
Bending Introduction
Mechanics of Bending Moment of Bending
Moment of Bending in Elastic-Plastic Domain
The Moment of Bending in the Purely Plastic Domain Bending Forces
Force for a U-die Forces for a Wiping Die Forces for a V-die Curling
Three-Roll Forming Bend Radius
Minimum Bend Radius Maximum Bend Radius Bend Allowance Springback Clearance
Deep Drawing Introduction
Mechanics of Deep Drawing Deep Drawability
Forces
First Drawing Operation
Subsequent Drawing Operations
Blank Calculations for Symmetrical Shells
6.6.1 6.6.2
Chapter 7 7.1 7.2 7.3 7.4 7.5 7.6 7.6.1
Defects During Deep Drawing Lubrication in Drawing
Various Forming Processes Stretch Forming
Nosing Expanding Dimpling Spinning
Flexible Die Forming Force in Die Forming
PART 111 DIE DESIGN Chapter 8
8.1 8.2
Chapter 9 9.1 9.2 9.2.1 9.2.2 9.2.3 9.2.4 9.3 9.3.1 9.3.2 9.3.3 9.4 9.4.1 9.4.2 9.5 9.5.1 9.5.2 9.5.3 9.5.4 9.6 9.7
Chapter 10
10.1
10.2
Basic Die Classifications and Components Die Classifications
Basic Die Components
Blanking and Punching Dies Introduction
Die Blocks
Die Opening Profile Fastening to the Die Shoe Sectioned Die
Calculation of Die Block Dimensions Punches
Punch Face Geometry
Methods for Assembling Punches Punch Calculations
Stripper Plates Stripper Force Stripper Design
Die Components for Guiding and Stopping Stock Guides and Guide Rails
Die Stops and French Notch Punch Positioning the Individual Blank Pilots
Center of Die Pressure
Examples of Couting Die Designs
Bending Dies Introduction
Simple Die Designs 10.2.1 U-Profile Bend Dies
x v
Table of Contents10.2.2 V-profile Bend Dies 10.2.3 Universal Bending Dies 10.3 Dies of Complex Design 10.3.1 Closing Profile Dies 10.3.2 Special Bending Dies 10.3.3 Curling and Hinge Dies 10.3.4 Tube-forming Dies 10.3.5 Multiple-bend Dies 10.3.6 Combination Dies 10.3.7 Progressive Dies
Chapter 11 Deep Drawing Dies 11.1 Introduction
11.2 Draw Rings
11.2.1 Draw Rings with Corner Radius 11.2.2 Draw Rings with Conical Profile 11.3 Clearances and Tolerances
11.3.1 Calculation of the Dimensions of the Punch and Die 11.4 Blank Holders
11.4.1 Blank Holders
11.4.2 Blank Holder Pressure 11.4.3 Blank Holder Force 11.4.4 Draw Beads
11.5 Single-operation Dies
11.6 Multi-operation Dies
11.7 Progressive Dies 11.8
11.9 Ironing Dies
Drawing Dies for Pieces of Spherical and Parabolic Shape
Chapter 12 Various Forming Dies 12.1 Nosing Dies
12.2 Expanding and Bulging Dies 12.2.1 Expanding Dies
12.2.2 Bulging Dies 12.3 Flanging Dies
Chapter 13 Tool and Die Materials 13.1 Introduction
13.2 Carbon and Alloy Steels
13.2.1 Designations for Carbon and Alloy Steels 13.2.2 Effects of Various Alloy Elements in Steels 13.2.3 Carbon Steels
13.2.4 13.2.5 13.2.6 13.2.7 13.3 13.3.1 13.3.2 13.4 13.5
Alloy Steels
Machinability of Steels
Mechanical Properties of Steels
Applications of Carbon and Alloy Steels Tool and Die Steels
Designation and Classification of Tool and Die Steels Cold Work Tool and Die Steels
Nonferrous Metals Nonmetallic Materials
Appendix 1 Appendix 2
Appendix 3 Miscellaneous Information Glossary
Bibliography Index
Blank Diameter of Drawn Shells
Metric System Tolerances on Linear Dimensions
177 177 178 179 179 179 181 182 183
PREFACE
A very large variety of sheet-metal forming processes is used in modern sheet-metal press-working shop practice. Many of these deformation processes, used in making aircraft, automobiles, and other products, use complex equipment that is derived from the latest discoveries in science and technology. With the ever- increasing knowledge of science and technology, future deformation processes promise to be even more complex to satisfy the demand for more productivity, lower cost, and greater precision. However, for all their advantages, the more sophisticated deformation processes of today have not replaced the need for basic sheet-metal forming processes and dies.
This book draws on the author’s 30-plus years of experience as an engineer and provides a com- plete guide to modern sheet-metal forming processes and die design - still the most commonly used manufacturing methodology for the mass production of complex, high-precision parts. Much more prac- tical than theoretical, the book covers the “hows” and “whys” of product analysis, and the mechanisms of blanking, punching, bending, deep drawing, stretching, material economy, strip design, movement of metal during stamping, and tooling design. Readers will find numerous illustrations, tables, and charts to aid in die design and manufacturing processes; Formulas and calculations needed for vari- ous die operations and performance evaluation are included; and designations, characteristics, and
typ-
ical applications of various carbon and alloy steels for different die components are evaluated. The book concentrates on simple, practical engineering methods rather than complex numerical tech- niques to provide the practicing engineer, student, technician, and die maker with usable approaches to sheet-metal forming processes and die design.
The first part of the book deals with the structures of metals and the fundamental aspects of the mechanical behavior of metals. Knowledge of structures is necessary to controlling and predicting the behavior and performance of metals in sheet-metal forming processes.
The second part of the book covers all aspects of forming sheet metal. It presents the fundamental sheet-metal forming operations of shearing, blanking and punching, bending, stretching, and deep draw- ing. Mechanics of various drawing processes indicate ways in which the deformation, loads, and process limits can be calculated for press forming and deep drawing operations. The book includes various draw- ing processes (nosing, expanding, dimpling, spinning and flexible die forming) mostly used in the aircraft and aerospace industry.
Dies are very important to the overall mass production picture, so they are discussed in the last sec- tion of the book, which presents a complete picture of the knowledge and skills needs for the effective design of dies for sheet-metal forming processes described. Special attention is given to:
Formulas and calculations needed for various die parts. Rules of thumb and innovative approaches to the subject.
Properties and typical applications of selected tool and die materials for various die parts.
xiv
V PrefaceAlthough the book provides many examples of calculations, illustrations, and tables to aid in sheet- metal forming processes, die design, and die manufacturing, it should be evident that it is not possible to present all the data, tables, statistics, and other information needed to design complicated dies and other tools for sheet-metal forming in one text. However, the book endeavors to provide most of the information needed by a die designer in practical situations.
The author owes much to many people. No book can be written in a vacuum. I am grateful to my wife, who understands my need for long periods of isolation. I also wish to express my deepest appreciation and thanks for the competent work of Em Turner Chitty, who labored countless hours at editing and proof- reading. Finally, I wish to thank my English language teacher from The University of Tennessee, Anwar E Accawi, who encouraged me to begin writing this book.
Vukota Boljanovic
1.1 3.1 4.1 4.2 4.3 4.4 4.5 4.6 5.1 5.2 5.3 5.4 6.1 6.2 6.3 6.4 6.5 6.6 7.1 7.2 7.3 7.4 7.5 7.6 9.1 9.2 9.3 9.4 9.5 11.1 11.2 13.1 13.2 13.3 13.4 13.5 13.6 13.7 13.8 13.9 A-2.1 A-2.3 A-1.1 A-2.2 A-2.4 A-3.1 A-3.2 A-3.3 A-3.4. A-3.5 A-3.6 A-3.7 A-3.8 A-3.9
Value of the modulus of elasticity, measured in different directions Relative amount of penetration of the upper blade into the material Values for clearances as a percentage of the thickness of the materials Absolute values for clearance for some stock materials
Absolute values for rn and n
Number of lines i in an alternate multi-line layout Value for specific pressure p (MPu)
Values for 6 depending on type and thickness o f the materials Value of Specific Pressure p (MPa)
Values of the coefficient c Values of coefficient
Values of Springback Factor Ks
Numbers of draws (n) for a cylindrical cup draw
Optimal ratio rn for drawing a cylindrical cup without flange Coefficient of friction ,u
Percent value added for trimming ( e )
Values of material added for trimming (Ac)
Lubricants commonly used in deep drawing process Median values of nosing ratio rns for different materials
Values of expanding ratio K for enlarging portions of drawing shell Values of die corner radius Rm, for dimpling
Values of the ratio of the hole diameter to the flange diameter rn Values of specific pressure p (MPu)
Maximum values for drawing ratio rn, drawing height h, and minimum drawing radius Rm
Value of Dimension h Depending on Material Thickness T Value of Constant c
Values of Cs
Values for Hand h
Values of the French notch width w Values of coefficient k for different materials Work tolerances for draw ring and punch Basic designation for SAE and AIS1 steels
Influence of alloying elements on the characteristic properties of steels Machinability rating for some types of steels
Mechanical properties of selected carbon and alloy steels
Mechanical properties of quenched and tempered carbon and alloy steels Typical applications and characteristics of various carbon and alloy steels Basic types of tool and die steels
Typical alloying elements for cold work tool and die steels Typical applications o f common tool and die steels Equations for calculating blank-diameters of drawn shells Preferred fits using the hole-basis system
Metric system tolerance for holes Metric system tolerance for shafts
ISO-symbols for geometric tolerances in engineering drawings Group of ASTM standards for sheet, and strip
Nominal thickness of sheet and strip SI base units
Examples of SI derived units
SI derived units with special names and symbol
Examples of SI derived units whose names and symbols include SI derived units with special names and symbols SI prefixes
Units outside the SI that are accepted for use with the SI Metric conversion factors ( approximate)
6 26 32 33 36 38 41 43 52 58 62 65 72 73 75 77 79 83 91 94 94 96 100 100 111
1 I3
120 125 127 151 152 176 177 178 178 179 180 180 181 181 185 192 192 194 196 200 20 1
Forming Processes
Categories
of
Sheet-Metal Forming ProcessesINTRODUCTION
Characteristicsof
Sheet-Metal Partsand Their
Technological PropertiesBASIC CHARACTERISTICS OF SHEET-METAL FORMING PROCESSES
Sheet-metal parts are usually made by forming material in a cold condition, although many sheet-metal parts are formed in a hot condition because the material when heated has a lower resistance to deformation. Strips or blanks are very often used as initial materials, and are formed on presses using appropriate tools. The shape of a part generally corresponds to the shape of the tool.
Sheet-metal forming processes are used for both serial and mass-production. Their characteristics are: high productivity, highly efficient use of material, easy servicing of machines, the ability to employ work- ers with relatively less basic skills, and other advantageous economic aspects. Parts made from sheet metal have many attractive qualities: good accuracy of dimension, adequate strength, light weight, and a broad range of possible dimensions, - from miniature parts in electronics to the large parts of airplane structures.
CATEGORIES OF SHEET-METAL FORMING PROCESSES
All sheet-metal forming processes can be divided into two groups: cutting processes
-
shearing, blanking, punching, notching, piercing, and so on; and plastic deformation processes - bending, stretch forming, deep drawing, and various other forming processes.The first group of processes involves cutting material by subjecting it to shear stresses usually between punch and die or between the blades of a shear. The punch and die may be any shape, and the cutting con- tour may be open or closed.
Shearing; involves the cutting of flat material forms from sheet, plate or strip. The process may be classified by the type of blade or cutter used, whether straight or rotary.
Blanking; involves cutting the material to a closed contour by subjecting it to shear stresses between punch and die. In this process, the slug is usually the work part and the remainder is scrap.
Punching; is the cutting operation by which various shaped holes are sheared in blanks. In punching, the sheared slug is discarded, and the material that surrounds the punch is the component produced.
xviii
V IntroductionParting; consists of cutting the sheet into two or more pieces, or removal of pieces of scrap of various shapes from deep drawn pieces. Unlike cutoff, the operation of parting results in some scrap production.
Lancing; is an operation in which a single line cut is made partway across the work material. No mate- rial is removed so there is no scrap.
Shaving; is a cutting operation that improves the quality and accuracy of blanked parts by removing a thin strip of metal along the edges. Only about 100 microns (0.004 inches) of material are removed by shaving.
The second group of processes involves partial or complete plastic deformation of the work material.
Bending; consists of uniformly straining flat sheets or strips of metal around a linear axis. Metal on the outside of the bend is stressed in tension beyond the elastic limit. Metal on the inside of the bend is compressed.
Twisting; is the process of straining flat strips of metal around a longitudinal axis.
Curling; forming a rounded, folded-back, or beaded edge on thin metal parts or strips for the purpose of stiffening and for providing a smooth, rounded edge.
Deep drawing; forming a flat sheet of metal blank into a cylindrical or box-shaped part by means of a punch that forces the blank into a die cavity. Drawing may be performed with or without a reduction in the thickness of the metal.
Spinning; is a process of forming work pieces from a circular blank or from a length of tubing. All parts produced by spinning are symmetrical about a central axis.
Stretch forming; is producing contoured parts by stretching a metal sheet, strips, or profile over a shaped block form.
Necking; is an operation by which the top of a cup may be made smaller than its body.
Bulging; a process that involves placing a tubular, conical or curvilinear part in a split female die and
Flanging; is a hole-making process that is performed on flat stock. The term “flanging” in this sense expanding it with, say, a polyurethane plug.
refers to the forming of a flange on a flat part by drawing stock out of a previously made hole.
CHARACTERISTICS OF SHEET-METAL PARTS AND
THEIR TECHNOLOGICAL PROPERTIES
The designers of products made from sheet metal have a huge responsibility and liability to invent the exact design that will result in optimum production considering the complexity of the technological fac- tors, the kind and number of operations, the production equipment (machines and tools) required, the mate- rial expenses, and the quantity and quality of material.
It is necessary to design technical components and operations so as to fulfill the product specifica- tions optimally. The design of a part is adequate if it combines the most economical production with the most satisfactory quality.
PART
I
THEORETICAL FUNDAMENTALS
I
1.1
Introduction
L
1.2
The crystal structure of metals
1.3
Deformation and the strength of
crystals
1.4
Recovery, Recrystallization, and
Grain Growth
THE STRUCTURE OF METALS
1.1 INTRODUCTION
Metals have played a major role in the development of civilization. Why have metals been useful to human- ity through the ages? Why do metals have a characteristic metallic shine? Why are some metals solid? Why are some metals malleable and ductile? Why are metals good conductors? Why are some metals soft and others hard? The answers to these and similar questions can be provided by gaining an understanding of the atomic structure and metallic bond of the metal atoms to form a crystalline structure. In general, pro- cessing is used to control the structures of metals, and the structure determines the properties of the mate- rial. One of the principal ways of controlling the structure of materials is to use processing techniques to manipulate the phases that are present in the material and how these phases are distributed. The main activ- ity of metallurgists and many other materials scientists is to manipulate the structure of materials to con- trol their properties. This manipulation can be used to control and predict the behavior and performance of metals in various manufacturing processes. That is to say, it is vitally important to understand the structure of metals in order to predict and evaluate their properties.
1.2 THE CRYSTAL STRUCTURE OF METALS
4 r The Structure of Metals
Metal
A1
Cu
Ni
bond the ions together. The existence of these free electrons and their movement, within limits, has a num- ber of consequences for the properties of metals. For example, the slight movement of the atoms under the influence of an external load is called elastic deformation. One of the most important characteristics of metals is that freely moving electrons can conduct electricity, so that metals tend to be good electrical and thermal conductors.
In a crystalline structure the atoms are arranged in a three-dimensional array called a lattice. The lat- tice has a regular repeating configuration in all directions resulting from the forces of chemical bonding. The repeated pattern controls properties such as strength, ductility, density, conductivity, and shape.
a (nm) 0.404
0.361 0.352
Most metals only exist in one of the three common basic crystalline structures: body-centered cubic (bcc);
face-centered cubic (fcc); and hexagonal close packed (hcp)
zn
These structures are shown in Fig. 1.1. Each point in this illustration represents an atom. The distance between the atoms in these crystal structures, measured along one axis, is known as the constant or param- eter of the lattice.
As shown in Fig. 1 .la, a body-centered cubic (bcc) structure has an atom at each corner of an imag- inary cube and an atom in the center of this cube (8+1). A (bcc) structure generally produces strong met- als, which are reasonably ductile. Example of (bcc) metals are chromium, alpha iron, and molybdenum.
Face-centered cubic (fcc) structures, as shown in Fig. 1.1 b, have an atom at the corners of a cube and an atom at the center of each face of the cube (8+6). Metals with (fcc) structures tend to be soft and duc- tile over a wide range of temperatures. Examples of (fcc) metals are aluminum, copper, and nickel.
0.266 0.496
M~ 0.314
1 I1 I I
Hexagonal closed-packed (hcp) structures (Fig 1 . IC) have an atom at the corners of an imaginary hexagonal prism and an atom at the center of each hexagonal face, and a triangle of atoms in between the hexagons, which rest in the shaded valleys (12+2+3). These metals, such as cobalt, magnesium, and zinc, are relatively brittle.
In the cubic structures, the parameter has the same dimensions in all three ortho-axes. However, the hexagonal close-packed structure has different dimensions.
The properties of a particular metal are very dependent on its crystal structure. Some metals can exist in more than one crystal structure at different temperatures. Iron and steel, for example, can exist in both (bcc) and (fcc) structures. Other examples of allotropic metals, as they are called, are titanium (hcp and bcc) and iron. Iron, interestingly, has a (bcc) structure below 900 and at 1400
,
while between those tem- peratures, iron changes its structure to (fcc), which requires less energy to maintain. Above 1400 iron reverts to its original structure.The appearance of more than one type of crystalline structure is known as allotropism or polymor- phism, meaning “many shapes.” Allotropism is an important aspect in the heat treatment of metals and welding operations.
The atoms in crystals cannot move far from their place in the cubic structure but they swing around their balance position. The planes in crystal structures that contain most atoms are known as netting planes.
The basic crystallographic planes in cubic lattice structures are these: the plane of a cube with index 100 (Fig. 1.2a);
the plane of a rhombus dodecahedron with index 1 10 (Fig. 1.2b); the plane of an octahedron with index 1 1 1 (Fig. 1 . 2 ~ ) .
The properties of metals (physical, chemical, and mechanical) depend on the arrangement of the crys- tal lattice structure and the magnitude of the distance between the atoms, so the characteristics in different directions will be different. This rule applies, for example, to the modulus of elasticity (the ratio of stress to strain in the elastic ranges, in tension or compression). The modulus of elasticity, measured in different directions in the same metal (across or along the direction of rolling, for example), is different. The meas- urements are performed on the three main crystallographic planes as described above. The results are given in Table 1.1
6 V The Structure of Metals
Table 1.1 Value of the modulus of elasticity, measured in different directions
11
~ 63.71
1 2 . 61
76.1I 11 I I I
Copper 130.3 191.1
125.0 210.5 272.7
1
Tungsten 384.61
384.61
384.6I
1.3 DEFORMATION AND STRENGTH OF SINGLE CRYSTALS
The electrons in the metallic bond are free to move about their positive ions in an electron cloud, which acts to glue or bond the ions together. This free movement, within limits, also allows for the movement of the atoms under the influence of external forces. This slight movement, (visible only under the most pow- e r h l microscopes) is called elastic deformation or elastic strain. After an external force, such as a bend- ing force, is removed, the internal electrical force that causes the atoms to move will decrease, allowing the atoms to return to their normal position; they leave no sign of ever having been moved. An analogy to this type of behavior is a leaf spring that bends when loaded and returns to its original shape when the load is removed.
If too much external force is applied by excessive bending of the leaf spring, the atoms might move too far from their original positions to be able to move back again when the external force is removed. This permanent deformation is known as plastic deformation.
In plastic deformation of metals there are two mechanisms: slipping, and twinning. Slipping (shown in Fig. 1.3) occurs when two groups of crystals under a shearing force move in a parallel fashion along what
Atomic planes
6
-
Shear stress _ _ j-
Shear stress
4
b)
Fig. 1.4
Plastic deformation across the plane of twinning.is called the slip plane, causing the two groups to slip so that they are dislodged one or more crystal’s length (a). This effect is called shear stress.
Twinning (shown in Fig. 1.4) occurs when horizontal planes of atoms move proportionally to their dis- tance from the twinning plane. Twinning usually occurs if a plastic deformation is made by striking, where- as slipping occurs more often when plastic deformation occurs as a result of the application of a static load. In plastic deformation, inter-atomic forces keep their elastic characteristics, which. is why plastic deformation is always accompanied by some elasticity. When the external force is removed in plastic deformation, a new arrangement of atoms is established but the pre-existing distance among them is retained. This statement is valid providing that no stress remains. In accordance with this explanation, we can conclude that in elastic deformations, only the distance between atoms changes, but in plastic defor- mations, both the distance and the positions of the atoms change.
1.3.1
Imperfections in the Crystal Structure of Metals
Attempts have been made to predict the plastic and mechanical properties of metals by theoretical calcu- lation. With the known value of the inter-atomic forces in the crystal structure of a given lattice, calcula- tions on the theoretical value of the mechanical properties of metals have been done. However, the calcu- lated values of mechanical properties of the metals were much larger than the values obtained with tensile testing in laboratory settings. The actual strength of materials is much lower than the levels obtained from theoretical calculations. This discrepancy has been explained in terms of imperfections in the crystal struc- ture. Unlike the idealized models, metal crystals contain large numbers of defects. Idealized models of crystal structures are known as perfect lattices. In Fig. 1.5 is shown an idealized model of a metal struc- ture without dislocations, in which the atoms from one row correspond with the atoms in another row.
The Structure of Metals
Fig. 1.6
Point defects : a) vacancy defect, b) substitutional defect, c) interstitial defect.Orderliness between atoms is not disturbed. Actual metal crystals contain large numbers of defects and imperfections, which can be classified in four categories: point defects, line defects, planar imperfec- tions, and volume imperfections.
a) Point (or atomic) defects (Fig. 1.6) can be divided into three main defect categories: the term can mean missing atoms (a vacancy), an interstitial atom (an extra atom) in the lattice, or a foreign atom (sub- stitutional) that has replaced the atom of the pure metal.
Vacancy defects result from a missing atom in a lattice position, and may result from imperfect pack- ing in the process of crystallization, or it may be due to increased thermal vibrations of the atoms brought about by elevated temperatures.
Substitutional defects result from an impurity that is present in a lattice position. Interstitial defects result from an impurity located at an interstitial site or from one of the lattice atoms being in an intersti- tial position instead of being in its usual lattice position.
b) Line defects, called dislocations, are defects in the orderly arrangement of a metal’s atomic struc- ture. Dislocations can be of three types: edge, screw, or mixed, depending on how they distort the lattice. It is important to note that dislocations cannot end inside a crystal. They must end at a crystal edge or other dislocation, or they must close back on themselves.
In Fig. 1.7 is shown a model of a metal structure with edge dislocation. Edge dislocations consist of an extra row or plane of atoms in the crystal structure. The imperfection may extend in a straight line all the way through the crystal or it may follow an irregular path. It may also be short, extending only a small
distance into the crystal, causing a slip of one atomic distance along the glide plane (the direction in which the edge imperfection is moving). The slip occurs when the crystal is subjected to a stress, and the dislo- cation moves through the crystal until it reaches the edge or is arrested by another dislocation.
As can be seen, one column from the upper part does not exist in the lower part of the figure. In this zone the atoms do not appear in regular order; they are moved or dislocated.
That is why one excess vertical plane must appear in this zone, which functions as an extra plane. Obviously, the atoms near the dislocation in one zone are in a pressured condition, and in another zone they are in a stretched condition. In these conditions, a lattice structure ought to bend. However, if a dis- location is locked with huge atoms, it will not bend, and a dislocation will occur in the place where there is most concentration of strain. A screw dislocation can be produced by a tearing of the crystal parallel to the slip direction. If a screw dislocation is followed all the way around a complete circuit, it will show a slip pattern similar to that of a screw thread.
c) Planar imperfections are larger than line imperfections and occur over a two- dimensional area. Planar imperfections exist at an angle between any two faces of a crystal or crystal form. These imperfec- tions are found at free surfaces, domain boundaries, grain boundaries, or interphase boundaries. Free sur- faces are interfaces between gases and solids. Domain boundaries refer to interfaces where electronic structures are different on either side, causing each side to act differently although the same atomic arrangements exist on both sides. Grain boundaries exist between crystals of similar lattice structure that possess different spacial orientations. Polycrystalline materials are made up of many grains that are sepa- rated by distances (typically) of several atomic diameters. Finally, interphase boundaries exist between the regions where materials exist in different phases @e., bcc next to fcc structures).
d) Volume imperfections are three-dimensional macroscopic defects. They generally occur on a much larger scale than the microscopic defects. These macroscopic defects generally are introduced into a mate- rial during refinement from its raw state or during fabricating processes.
The most common volume defect arises from foreign particles being included in the prime material. These second-phase particles, called inclusions, are seldom wanted because they significantly alter the structural properties. An example of an inclusion may be oxide particles in a pure metal or a bit of clay in
a glass structure.
1.3.2 Grain Size and Boundary
When molten metal begins to solidify, crystals begin to form independently of each other at the various locations within the melted mass. Fig. 1.8 is a schematic illustration of the various stages during the solid- ification of molten metal.
I"-
+ @
10
v
The Structure of MetalsEach small square represents a unit cell. The first (I) represents the nucleation of crystals at random sites in the molten metal. The second and third (I1 and 111) represent the growth of crystals as solidifica- tion continues. The last (IV) represents solidified metal, showing individual grains and grain boundaries.
The grain boundavy refers to the outside area of a grain that separates it from the other grains. The grain boundary is a region of misfit between the grains and is usually one to three atom diameters wide. The grain boundaries separate variously oriented crystal regions (polycrystalline) in which the crystal structures are identical. Fig. 1.8 (IV) represents five grains of different orientation and the grain boundaries that arise at the interfaces between the grains
A very important feature of a metal is the average size of the grain. The size of the grain determines the properties of the metal. For example, a smaller grain size increases tensile strength and tends to increase ductility. A larger grain size is preferred for improved high-temperature creep properties. Creep
is the permanent deformation that increases with time under constant load or stress. Creep becomes pro- gressively easier (greater) with increasing temperature.
Another important property of the grains is their orientation. In general, grains may be oriented in a random arrangement or in a preferred orientation. In a random orientation of the grains, no one direction within the grains is aligned with the external boundaries of the metal sample. This random orientation can occur when material is cross-rolled. If such a sample is rolled sufficiently in one direction, it will develop a grain-oriented structure in the rolling direction. This is called preferred orientation. A preferred orienta- tion is often very desirable.
1.3.3 Strain Hardening
Movement of an edge dislocation across a crystal lattice under a shear stress does not happen all at the same time; instead, only the local domain slips. Fig. 1.9a schematically illustrates a crystal lattice non- deformed metal, and Figs. 1.9b to 1.9d illustrate the movement of an edge dislocation across the crystal lattice under a shear stress. Dislocation helps explain why the actual strength of metals is much lower than that predicted by theory. A slip plane containing a dislocation requires less shear stress to cause slip than a plane in a perfect lattice.
Although the presence of a dislocation lowers the shear stress required to cause slip, dislocations can become entangled and interfere with each other and be impeded by barriers, such as grain boundaries and
a) b) c> d)
Fig.
1.9
Gradual movement dislocation through a crystal lattice during plastic deformation: a) structure before deformation; b), c), and d) movement of an edge dislocation across the crystal lattice under a shearUTS(t) -theoretical ultimate tensile strength UTS-true ultimate tensile strength
n-number of defects in the crystal latice ~~
Fig.
1.10
The relationship between the metal’s strength and number of dislocations in the metal’s crystal lattice.impurities and inclusions in the metal. Entanglement and impediments increase the shear stress required for slip. The increase in shear, and hence the increase in the overall strength of the metal, is known as work hardening or strain hardening. Work hardening is used extensively in strengthening metals in metalwork- ing processes at ambient temperatures.
The relationship between a metal’s strength and the number of dislocations in the metal’s crystal lat- tice is shown in Fig. 1.10.
The curve of function UTS = f (n) graphically illustrates an hypothesis regarding strain hardening in
metals in metalworking processes at ambient temperature. The steep part of the curve UTS = f (n) for n<n,
characterizes the beginning of the first dislocations and other defects in structure, such as vacancies, inter- stitial atoms, impurities, etc. The right part of the curve for n > n, characterizes a gradual growth of strength and represents aggregate defects.
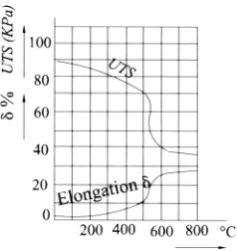
1.4 RECOVERY AND RECRYSTALLIZATION
In studies of the phenomenon of work hardening, it has been shown that plastic deformation at room tem- perature results in a change in the mechanical properties of metals: a general increase in ultimate tensile strength, yield point elongation, and hardness, while elongation and contraction decrease. However, the properties of metals can be reversed to their original level by heating them to a specific temperature for a specific time. Fig. 1.1 1 schematically illustrates changes in the mechanical properties depending on the temperature to which a previously cold deformed workpiece of a steel of medium hardness has been raised. At the beginning of the reversal process, the material is slowly heated to the lower temperatures, then to a specific temperature for each material. At this point, sudden changes occur which correspond with the beginning of changes of the structurally deformed metal. In place of the deformed grains in a crystal lat- tice with defects, new crystallization centers appear, and around them new crystals are formed. Strains and defects of crystal lattice which appeared during plastic deformation now disappear.
12
v
The Structure of MetalsFig. 1.1
1
Changes in the mechanical properties of steel of medium hardness during the process of recovery and recrystallization.(TJ. This temperature is different for different metals and alloys, and may be calculated approximately by the following formula:
T, = 0.4 T, (1.1)
where:
T, = the melting point of the metal.
Alloys usually have a higher temperature of recrystallization than pure metals. Changes during the process of heating before the temperature of recrystallization is reached are called recovery. The temper- ature for recovery (TJ ranges can be approximately calculated by the following formula:
Trc = (0.2 to 03) T,,, (1.2)
I
2.1
Introduction
I
2.2
Stress / Strain CurvesI
2.4
True Stress and True
StrainMECHANICAL BEHAVIOR
OF MATERIALS
2.1 INTRODUCTION
One of the most important groups of processes in manufacturing is plastic deformation. The group includes forging, rolling, extrusion, rod and wire drawing, and all sheet-metal forming processes. This chapter discusses the hndamental aspects of the mechanical behavior of metals during deformation.
Metal deformation is an integral part of industrial production. For example, during the process of stretching a piece of metal to make some part of an aircraft or an automobile, the material is subjected to tension. By the same token, when a solid cylindrical piece of metal is forged in the making of a gear disk, the material is subjected to compression. Sheet metal, too, undergoes shearing stress when a hole is punched in it.
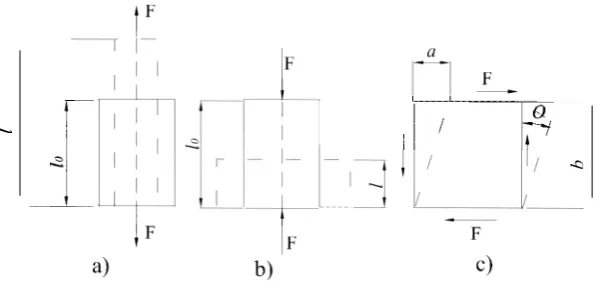
Strength, hardness, toughness, elasticity, plasticity, brittleness, ductility, and malleability are mechan- ical properties used as measurements of how metals behave under a load. These properties are described in terms of the types of force or stress that the metal must withstand and how these forces are resisted. Common types of loading are compression, tension, shear, torsion, or a combination of these stresses, such as fatigue. In Fig. 2.1 is shown the three most common types of stress
Compression stresses develop within a sample material when forces compress or crush it. For exam- ple, the material that supports an overhead beam is in compression, and the internal stresses that develop within the supporting column are compressive.
Tension (or tensile) stresses develop when a material is subject to a pulling load; for example, when a wire rope is used to lift a load or as a guy to anchor an antenna. “Tensile strength” is defined as resist- ance to longitudinal stress or pull and can be measured in pounds per square inch of cross section.
14
V Mechanical Behavior of Materials4.
[image:33.574.134.432.79.220.2]_I
Ii;o.
Fig. 2.1
Types of stress: a) tension, b) compression, c) shear.Shearing stresses occur within a material when external forces are applied along parallel lines in opposite directions. Shearing forces can separate a material by sliding part of it in one direction and the remainder in the opposite direction.
Materials scientists learn about the mechanical properties of materials by testing them. Results from the tests depend on the size and shape of the material to be tested (the specimen), how it is held, and how the test is performed. To make the results comparable, use is made of common procedures, or standards,
which are published by the ASTM.
To compare specimens of different sizes, the load is calculated per unit area. The force divided by the area is called stress. In tension and compression tests, the relevant area is that perpendicular to the force. In shear tests, the area of interest is perpendicular to the axis of rotation.
The engineering stress is defined as the ratio of the applied force F to the original cross/sectional area
A , of the specimen. That is:
F
o = -
A,
where:
F = tensile or compressive force
A , = original cross-sectional area of the specimen.
The nominal strain or engineering strain can be defined in three ways: As the relative elongation, given by:
1 - 1 0 -
AI
1e=- -
-=--I
10 10 1 where:
I, = the original gauge length
As the reduction of the cross-section area, given by:
Or as the logarithmic strain, given by:
(p=l&
A
where:
A , = the original cross-section area
A = the instantaneous cross-section area.
These definitions of stress and strain allow test results for specimens of different cross-sectional area
A , and of different length 1, to be compared. It is generally accepted that tension is positive and compres- sion is negative.
Shear stress is defined as:
F
r = -
A,
where:
F = force is applied parallel to the upper and lower faces, each of which has an area A,.
Shear strain is defined as:
a b
y = -
=tge
Shear stresses produce strains according to:
where:
G = shear modulus.
Torsion is a variation of pure shear. Shear stress then is a function of applied torque shear strains relat-
Materials subject to uniaxial tension shrink in the lateral direction. The ratio of lateral strain to axial ed to the angle of twist.
strain is called Poisson j. ratio.
where:
e, = lateral strains,
16
V Mechanical Behavior of MaterialsThe theory of isotropic elasticity defines Poisson’s ratio in the next relationship:
- l < v I 0 . 5
(2.8a)The Poissonratio for most metals is between 0.25 and 0.35. Rubbery materials have Poisson’s ratios very close to 0.5 and are therefore almost incompressible. Theoretical materials with a Poisson’s ratio of exactly
0.5 are truly incompressible, because the sum of all their strains leads to a zero volume change. Cork, on the other hand, has a Poisson’s ratio close to zero, which makes cork function well as a bottle stopper. The cork must be easily inserted and removed, yet it also must withstand the pressure from within the bottle.
The elastic modulus, shear modulus, and Poisson’s ratio are related in the following way:
E
=2G(l+
V)2.2 STRESS /STRAIN CURVES
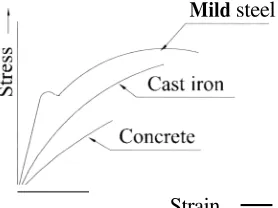
The relationship between the stress and strain that a material displays is known as a stresdstrain curve. It is unique for each material. In Fig. 2.2 are shown the characteristic stresdstrain curves for three common materials.
Mild steel
[image:35.574.208.347.344.448.2]Strain
-
Fig. 2.2
Stresslstrain curves for different materials.It can be seen that the concrete curve is almost a straight line. There is an abrupt end to the curve. This abrupt end combined with the fact that the line is very steep, indicate that the material is brittle. The curve for cast iron is slightly curved. Cast iron also is a brittle material. Notice that the curve for mild steel seems to have a long gently curving “tail,” which indicates the high ductility of the material.
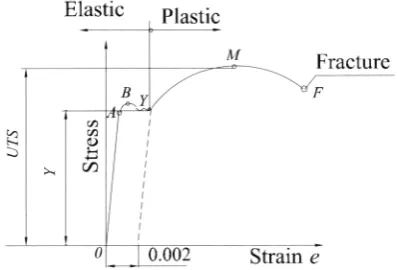
Typical results from a tension test on a mild-steel are shown in Fig. 2.3.
Several significant points on a stress/strain curve help one understand and predict the way any build- ing material will behave. Point A is known as the proportional limit. Up to this point, the relationship between stress and strain is exactly proportional. The linear relationship between stress and strain is called Hooke’s law.
Fig.
2.3
Tensile stresdstrain diagram for a mild steel.If the load is removed, the specimen returns to its original length and shape, which is known as elas- tic behavior.
Strain increases faster than stress at all points on the curve beyond point A. Point B is known as the
elastic limit; after this point, any continued stress results in permanent, or inelastic, deformation
The stress resistance of the material decreases after the peak of the curve, and this point is also known as the yield point Y of the material. For soft and ductile materials, the exact position on the stress /strain curve where yielding occurs may not be easily determined because the slope of the straight portion of the curve decreases slowly. Therefore, Y is usually determined as the point on the stress /strain curve that is offset by a strain of 0.002 or 0.2% elongation.
If the specimen continues to elongate further under an increasing load beyond point Y, a domain curve begins in which the growth of strain is faster than that of stress. Plastic forming of metal is performed in this domain. If the specimen is released from stress between point Y and point M, the curve follows a straight line downward and parallel to the original slope (Fig. 2.4).
As the load and engineering stress increase further, the curve eventually reaches a maximum point M ,
and then begins to decrease. The maximum engineering stress is called tensile strength or ultimate tensile
[image:36.573.192.391.78.213.2] [image:36.573.199.341.521.642.2]18
V Mechanical Behavior of MaterialsF
maxA,
strength (UTS), of the material.
o,,,
=UTS
= ~(2.1 1)
If the specimen is loaded beyond its ultimate tensile strength, it begins to “neck,” or “neck down.” The cross-sectional area of the specimen is no longer uniform along a gauge length but is smaller in the neck- ing region. As the test progresses, the engineering stress drops further and the specimen finally fractures at the point F. The engineering stress at fracture is known as the breaking or fracture stress.
The ratio of stress to strain in the elastic region is known as the modulus of elasticity (E) or Young’s modulus and is expressed by:
O
E = -
e (2.12)
The modulus of elasticity is essentially a measure of the stiffness of the material.
2.3 DUCTILITY
Ductility is an important mechanical property because it is a measure of the degree of plastic deformation that can be sustained before fracture. Ductility may be expressed as either percent elongation or percent reduction in area.
Elongation can be defined as:
Reduction can be defined as:
A,
X l O O4,
w =
(2.13)
(2.14)
where:
$.
= length at the fracture. This length is measured between original gauge marks after the pieces ofI ,
= the original sample gauge length;Af = cross-sectional area at the fracture;
A , = original sample gauge cross-sectional area.
the broken specimen are placed together;
centage elongation is more a measure of the strain leading to the onset of necking than a measure of the strain at final fracture in a uniaxial tensile specimen. A better measure of the strain at final fracture is the percentage reduction in area.
The relationship between the elongation and reduction of area is different for some groups of metals, as shown in Fig. 2.5.
Stainless steels
_::)ye. and Alloys
Low carbon steels
~
/
7
9
\
cold rolledAluminum alloys /
0
I
10 20 30 40 50 60 70 80 90, I I I I , ,
-Reduction of area (%)
Fig. 2.5
Relationship between elongation and reduction of areaElongation ranges approximately between 10 and 60% for most materials, and values between 20 and 90% are typical for reduction of area. Thermoplastics and super-plastic materials, of course, exhibit much higher ductility, aand brittle materials have little or no ductility.
2.4
TRUE STRESS
AND
TRUE STRAIN
In the solution of technical problems in the processes of sheet-metal forming, theoretical stress and strain do not have as crucial a significance as do true stress and true strain. True stress and true strain are much more important.
It is apparent that, since stress is defined as the ratio of force to area, true stress may be defined as:
F
k = -
(2.15)A
where:
A = the instantaneous cross-section area.
As long as there is uniform elongation, true stress (k) can be expressed using the value for engineer- ing stress
.
Assuming that volume at plastic deformation is constant: (this equation is in effect only to pointM),
the relationship between true and nominal stress may be defined as follows:= 0. E" (2.15a)
k
= - =0 x 4
= o ( l - s ) = -In Fig. 2.6 is shown a nominal (engineering) curve and the true stress and strain for medium carbon
F
0A
A
1-v
20
v
Mechanical Behavior of MaterialsI I I
Strain e
Fig. 2.6
Diagram of nominal and true stress.Because the strains at the yield point Yare very small, the difference between the true and engineer- ing yield stress is negligible for metals. This is because the difference in the cross- sectional areas A , and A at yielding is very small. However, the difference in the cross-sectional area A , and A , ( A < A,) above point Y is always greater, so the difference between the true and nominal stress is significant (k > 0).
PART
I1
MANUFACTURING PROCESSES
SHEARING PROCESS
3.1 MECHANICS OF SHEARING
The shearing process involves the cutting of flat material forms, such as sheets and plates. The cutting may be done by different types of blades or cutters in special machines driven by mechanical, hydraulic, or pneumatic power. Generally the operations consist of holding the stock rigidly, while it is severed by the force of an upper blade as it moves down past the stationary lower blade.
During the shearing process, three phases may be noted: In phase I, because of the action of the cut- ting force
E
the stress on the material is lower than the yield stress (z < ze). This phase is that of elastic deformation (Fig. 3.1). To prevent the movement of material during the cutting operation, the material is held by the material holder at force Fd. In phase 11, the stress on the material is higher than the yield stress but lower than the UTS. This phase is that of plastic deformation (ze < z < z ~ ) . In phase 111, the stress on the material is equal to the shearing stress (z = zm). The material begins to part not at the leading edge, butat the appearance of the first crack or breakage in the material. Fracture of the material occurs in this phase. The amount of penetration of the upper blade into the material is governed by the ductility and thick- ness of the work material. If the material is thicker and more brittle, the first crack will appear earlier, so there is earlier disjunction of the material. The sheared edge is relatively smooth where the blade pene- trates, with a considerably rougher texture along the torn portion.
3.2 SHEARING FORCES
Knowledge of the forces and the power involved in shearing operations is important, and they may be cal- culated according to the edge types of the cutters. There are three types of cutters:
24
V Shearing Processstraight parallel cutters, straight inclined cutters, and rotary cutters.
Holder IF Work material F Upper blade
-
- 1 7Phase I Phase I1 Phase 111
Fig. 3.1
Schematic illustration of the shearing process.3.2.1 Shearing with Straight Parallel Cutters
The shearing force F with straight parallel cutters (Fig 3.2) can be calculated approximately as:
where:
z = shear stress,
A = cutting area.
The cutting area is calculated as:
A = b . T
where:
b = width of material
T = thickness of material
This calculated shearing force needs to be increased by 20% to 40% depending on the: obtuseness of the angle of the cutter edge,
enlarged clearance between cutters,
varations in the thickness of the material, and other unpredictable factors.
The real force of the shearing machine is:
(3.la)
The crosscut force Ft at the cutters (Fig. 3.2) is:
F,
=F
' tgy.For shearing without a material holder, the turn angle of the material is:
y
=10'
+20°,
andthe crosscut force is:
F,
=( 0 . 1 8 t 0 . 3 6 ) F .
For shearing with a material holder, the turn angle is:
il=5O+1oo and,
the crosscut force is:
F,
=(0.09+0.18)F
bWork material
upper
bladeWork material
i
(3.3)
(3.3a)
(3.3b)
Fig.
3.2
Schematic illustration of shearing with straight parallel cutters.3.2.2 Shearing with Straight Inclined Cutters
Shears with straight inclined cutters are used for cutting material of relatively small thickness compared with the width of cutting. Using inclined cutters reduces the shearing force and increases the range of movement necessary to disjoin the material. The penetration of the upper blade into material is gradual, and as result, there is a lower shearing force.
The shearing force can be calculated approximately as:
T 2
=:0.6
*UTS
E,, -T 2
tg cp t s cp
26
V Sheaving ProcessMATERIAL
where:
n = 0.75 to 0.85 - For most materials
k = 0.7 to 0.8 - Ratio UTSh for material
cot = The relative amount of penetration of the upper blade into the material (Table 3.1)
q = Angle of inclination of the upper cutter.
Thickness of material T (mm)
< I
1 + 2
2 t 4
> 4Plain carbon steel Medium steel Hard steel
Aluminum and copper (annealed)
0.75 - 0.70 0.70 - 0.65 0.65 - 0.55 0.50 - 0.40 , I
0.65 - 060 0.60 - 0.55 0.55 - 0.48 0.45 - 0.35
0.50 - 0.47 0.47 - 0.45 0.44 - 0.38 0.35 - 0.25
0.80 - 0.75 0.75 - 0.70 0.70 - 0.60 0.65 - 0.50 I
For shearing without a material holder, the angle of inclination of the cutter is y = 7 O to 12O. If the angle
is y > 12O the shears must have a material holder. To make the shearing process efficient, the cutters are made (see Fig. 3 . 3 ) with:
end relief angle y = 3 O to 12O back angle a = 2O to 3 O , and lip angle
p
= 7.5' to 8.5'.The clearance between cutters is c = (0.02 i 0.05) mm.
Upper blade
___
a
-b
[
Work material
3.3.3 Shearing with Rotary Cutters
The rotary shearing process is very much like shearing with straight inclined cutters because the straight blade may be thought of as a rotary cutter with an endless radius. It is possible to make straight line cuts as well as to produce circular blanks and irregular shapes by this method. In Fig. 3.4 is illustrated the con- ventional arrangement of the cutters in a rotary shearing machine for the production of a perpendicular edge. Only the upper cutter is rotated by the power drive system. The upper cutter pinches the material and causes it to rotate between the two cutters.
Shearing force can be calculated approximately as:
The clearance between rotary cutters with parallel inclined axes is:
c
=(0.1
to0.2)T.
(3.6)Rotary shearing machines are equipped with special holding fixtures that rotate the work material to generate the desired circle. A straight edge fixture is used for straight line cutting. It should be noted that the rotary shearing operation, if not performed properly, may cause various distortions of the sheared part.
Work material
Mechanisms
4
4.2Blanking and Punching
Clearance
4.3
Punch Force
4.4
Material Economy
4.5
Shaving
BLANKING AND PUNCHING
4.1
BLANKING AND PUNCHING MECHANISM
Blanking and punching are processes used to cut metal materials into any precise form by the use of dies. The basic parts of the tool are the punch and the die. The major variables in these processes are as follows: the punch force, F; the speed of the punch; the surface condition and materials of the punch and die; the condition of the blade edges of the punch and die; the type of lubricant; and the amount of clearance between the punch and die.
In blanking, the slug is the part that is used, and the remainder is scrap. In punching, the sheared slug
is discarded as scrap, leaving the remainder to be used (Fig. 4.1).
Fig. 4.1
Blanking and punching.There are three phases in the process of blanking and punching (Fig. 4.2.):
30
V Blanking and PunchingWork material Punch
I I
phase I phase I1
I
phasevIII
Fig.
4.2 Phases in the process o f shearing.In phase I, during which the work material is compressed across and slightly deformed between the punch and die, the stress and deformation in the material do not exceed the elastic limit. This phase is known as the elastic phase.
In Phase 11, the bent work material is pushed farther into the opening die by the punch; at this point in the operation, the material has been obviously deformed at the rim, between the cutting edges of the punch and die. This concentration of outside forces causes plastic deformation at the rim of the material. At the end of this phase, the stress in the work material close to the cutting edges reaches a value corre- sponding to the material shear strength, but the material resists fracture. This phase is called the plastic phase.
During Phase 111, the strain in the work material reaches the fracture limit, and micro-cracks appear which turn into macro-cracks, followed by separation of the parts of the workpiece. The cracks in the mate- rial start at the cutting edge of the punch on the upper side of the work material, also at the die edge on the lower side of the material; the cracks propagate along the slip planes until complete separation of the part from the sheet occurs. A slight burr is generally left at the bottom of the hole and at the top of the slug. The slug is then pushed farther into the die opening. The slug burnish zone expands and is held in the die opening. The whole burnish zone contracts and clings to the punch. The overall features of the blanked or punched edges for the entire sheared surface are shown in Fig. 4.3. Note that the edges are neither smooth nor perpendicular to the plane of the sheet. The clearance c is the major factor determining the shape and quality of the blanked or punched edge. If clearance increases, the edges become rougher, and the zone of
burnish zone diameter
.-b rea -I& .t dTa m e t c r
deformation becomes larger. The material is pulled into the clearance area, and the edges of the punched or blanked zone become more and more rounded. In fact, if the clearance is too large, the sheet metal is bent and subjected to tensile stresses instead of undergoing a shearing deformation.
4.2 BLANKING AND PUNCHING CLEARANCE
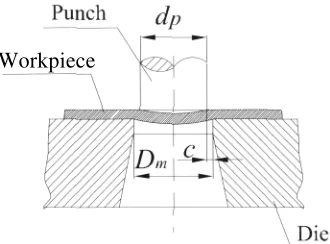
Clearance c, is the space (per side) between the punch and the die opening (Fig. 4.4), such that:
D m - d p
C =
2
(4.1)Because of the amount of clearance between the punch and the die, tool and die producers enjoy some kind of mystique related to their work as being both an art and a science.
Proper clearance between cutting edges enables the fractures to start ideally at the cutting edge of the punch and also at the die. The fractures will proceed toward each other until they meet, and the fractured portion of the sheared edge then has a clean appearance. For optimum finish of a cut edge, correct clear- ance is necessary and is a function of the kind, thickness, and temper of the material.
The upper corner of the cut edge of the strip stock and the lower corner of the blank acquire a radius where the punch and die edges respectively make contact with the work material. This edge radius is pro- duced by the plastic deformation taking place and is more pronounced when cutting soft materials. Excessive clearance will also cause a large radius at these corners, as well as a burr on opposite corners.
When clearance is not sufficient, additional layers of the material must be cut before complete sepa- ration is accomplished. With correct clearance, the angle of the fractures will permit a clean break below the burnish zone because the upper and lower fractures will extend toward one another. Excessive clear- ance will result in a tapered cut edge, because for any cutting operation, the opposite side of the material that the punch enters after cutting, will be the same size as the die opening.
The width of the burnish zone is an indication of the hardness of the material. Provided that the die clearance and material thickness are constant, the softer the material, the wider will be the burnish zone. Harder metals required larger clearance and permit less penetration by the punch than ductile materials; dull tools (punch and die) create the effect of too small a clearance as well as a burr on the die side of the
[image:50.578.201.366.512.634.2]Workpiece
Fig. 4.4
Punch and die clearance.32
V Blanking and Punchingstock. Clearance is generally expressed as a percentage of the material thickness, but some authorities rec- ommend absolute values.
Table 4.1 illustrates the value of the shear clearance in percentages depending on the type and thick- ness of the material
Table 4.1 Values for clearance as a percentage of the thickness of the materials
MATERIAL
carbon
Table 4.2 illustrates absolute values for the shear clearance depending on the type and thickness of the material.
More analytical methods for the definition of shear clearance exist; for instance, the theoretical method expresses clearance as a function of thickness of the material and the shear strength of the mate- rial. That is:
where:
T =
k =
Trn -
UTS = -
for
T I 3 m m
k .T
-k
- T .
2/0.7UTs
C = -
2
2
(4.2)(1.5.k.T -0.015).J0.7UTS
2C =
for
T
>
3mm
thickness of material (mm)
a coefficient that depends on the type of die; that is
k
= 0.005 to 0.035, most frequently usesk
= 0.01. For a die of metal ceramic,k
= 0.01 5 to 0.18shear strength of material Ultimate Tensile Strength.
3.50 4.00 4.50 4.80 5.00
0.18 0.21 0.25 0.35
0.2 0 0.24 0.28 0.40
0.23 0.27 0.32 0.45
0.24 0.29 0.34 0.48
0.25 0.30 0.36 0.50
4.3 PUNCH FORCE
Theoretically, punch force should be defined on the basis of both tangential (7) and normal (0) stresses that
exist in a shear plane. However, with this analysis, one obtains a very complicated formula that is not con- venient for use in engineering practice because an estimate of the punching force can be calculated from a value for tangential stress alone.
4.3.1 Punch and Die with Parallel Cut Edges
The force F for a punch and die with parallel cut edges is estimated from the following equation:
F
=LTT,
=0.7LT(UTS)
(4.3)where:
L = the total length sheared (perimeter of hole),
T = thickness of the material,
UTS = the ultimate tensile strength of the material.
Such variables as unequal thickness of the material, friction between the punch and the workpiece, or poorly sharpened edges, can increase the necessary force by up to 30%, so these variables must be con- sidered in selecting the power requirements of the press. That is, the force requirements of the press, Fp
are:
F,,
=1.3F
(4.4)34
v
Blanking and PunchingY \ -
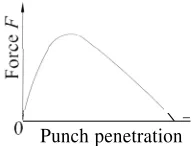
[image:53.580.247.343.76.149.2]Punch penetration
Fig. 4.5
Typical punch force / penetration curve in shearing.4.3.2 Punch and Die with Bevel-cut Edges
The punch force can be reduced if the punch or die has bevel-cut edges (Fig. 4.6). In blanking operations, shear angles, which may b