This article available in website: http://journal.umy.ac.id/index.php/ai DOI: 10.18196/jai.2016.0049.118-131
The Effect of Financial and Non-Financial Variables to Firm
Performance: Comparison Between Indonesia and Thailand
Hasni Yusrianti12
*; Tien Norma Habsari1
: Suthawan Prukumpai3
1
Program Studi Akuntansi Universitas Sriwijaya, Jl. Raya Palembang - Prabumulih Km 32, Sumsel, Indonesia 2
Program Studi Akuntansi Universitas Diponegoro, Jl. Prof. Soedarto, SH, Tembalang, Semarang, Jateng, Indonesia 3
Accounting Department of Kasetsart University, 50 Lat Yao, Bangkok 10900, Thailand
A R T I C L E I N F O A B S T R A C T
Article history: received 21 Jan 2016 revised 13 Mar 2016 accepted 1 Apr 2016
The purpose of this research is to test the effect of financial and non-financial variables to firm performances comparison between Indonesia and Thailand. The observation data used in this study is manufacturing companies from manufacturing sectors. Secondary data was used, collected from Indonesia Stock Exchange and Stock Exchange of Thailand during 2011 - 2013. By combining 3 years research, there are 55 Indonesian companies and 50 Thailand companies that meet predetermined criteria. Multiple Regression was used to analyze. This study uses Return on Equity, Earnings per Share, Market Value Added as financial variables and Earnings Quality, Institutional Ownership, Independent Commissioner, Audit Committee, Corporate Social Responsibility as non-financial variables. Test results show that both financial and non-financial variables can effect to firm performance.
© 2016 JAI. All rights reserved Keywords:
Financial; Non Financial; Corporate Social Responsibility; Firm Performance
INTRODUCTION
Capital markets have an important influence in supporting economy of a country. The capital market is a vehicle to invest their funds, especially for investors. So, the investor should know about firm performance to determine the companies pros-pect. Fundamental analysis that influenced by the financial variables is one indicator of company's financial performance. There are traditional financial performance and modern financial performance. Traditional financial performance such as return on equity and earnings per share are really important and usually center of attention of investors. Establishing company has several objectives, such as achieving maximum benefit or profit as much as possible, giving prosperity to owner and shareholder, and maximizing firm value (Martono and Harjito, 2005).
However, developments in science rapidly and the demands of the world market economy encou-raged the experts to find and develop other measure-ment tools are more accurate in measuring com-pany's performance. Therefore, in 1989, Stern Ste-ward Consultant Management Service in the United States introduced the concept of Economic Value Added (EVA) and Market Value Added (MVA) as a measurement of modern financial performance and
the market to overcome the shortcomings of traditional financial performance because according to Dodd and Chen (1996) in Siegel (2006) that EVA and MVA have performance measure in the belief that the company's EVA correlate between perfor-mance management with stock returns. Moreover compared with other performance measurements such as Return on Capital (ROC), Return on Equity (ROE), Earning per Share (EPS), cash flow growth, and Economic Value Added (EVA) have higher correlation in creating value for shareholders.
Table 1. Comparison Indonesia Index & Thailand Index
YEAR IDX INDONESIA SET THAILAND
Highest Lowest Dif Highest Lowest Dif
2013 5225,59 3994,46 1231,13 1631,27 1275,76 355,51
2012 4224,51 3832,12 392,39 1239,06 1094,15 144,91
2011 4174,12 3346,06 828,06 1043,24 995,33 47,91
Source: IDX & SET
tion for Standardization (ISO) which adopted to determine corporate social responsibility is an inter-national body as leading developer of interinter-national standards organization that was founded in 1947 with 154 states of member – has formulated a standard that is called ISO 26000: Guidance Standard on Social Responsibility that was released on Novem-ber, 1st
2010. The scope of ISO 26000 will spur companies in the world, including Indonesia, to conduct programs of social responsibility correctly. It is designed to be used by all types of organizations, whether for profit or non-profit company. Addi-tionally, the good governance of company is cur-rently in main concern.
As Southeast Asia countries, Indonesia and Thailand has a close relationship country. Although we have different country system, we also have some similarity. Looking back at the history data of SET Index in Thailand and IDX Index in Indonesia, the stock exchange index for the last 3 (three) years as showed at Table 1. Based on at that table, the differences between the highest and the lowest index either in Thailand or in Indonesia is quite significant. Since 2011 to 2013, the differences between the highest index and the lowest index has a significant number. The highest index in Indonesia is 5225,59 in 2013, however the lowest one is 3994,46. Although the SET index is not as high as IDX index, the index is getting higher and the differences is getting bigger.
Since the previous studies provide mixed evi-dence. This research has objective to test the effect of financial and non-financial variables to firm performances. It is a comparative study about the relationship between financial and non financial variables on firm performance between Indonesia and Thailand. This research focuses on manu-facturing companies with the consideration that the manufacturing sectors have different sensitivities to changes in economic conditions (Tuasikal, 2002) in Sugiyanto (2011).
The contributions of this research are as follows; (1) this paper uses not only the traditional financial variables but also includes the modern financial variables; (2) the non-financial variables such as Corporate Governance and Corporate Social Responsibility are considered in this paper, and (3) it
provides comparative evidence between Indonesian and Thailand perspective.
LITERATURE REVIEW AND HYPOTHESIS DEVELOPMENT
Agency Theory
Agency Theory explains that separation bet-ween owner as principal and management as agent in running company will create some problems. Conflict of interest between principle and agent will be difficult to be avoided. Applying corporate governance mechanism is one of ways that can be done. Agency relationship is defined as a contract in which parties called owners or shareholders appoint another parties called agents or management to do some work on behalf of the owner. It includes the delegation of authority to make decisions (Brigham and Houston, 2006). In this study, management is expected by the owner to be able to optimize the existing resources in company maximally.
Stakeholder Theory
An entity is not a company that only operates for its own interests, but also should provide benefits for other stakeholders (shareholders, creditors con-sumers, suppliers, government, society). Thus, the existence of a company is influenced and deter-mined by support given to the stakeholders (Ghozali and Chariri, 2007). Therefore, when stakeholder controls important economic resource of company, company will react in ways that satisfy the desires of stakeholder (Ullman, 1982 in Ghozali and Chariri, 2007). This research analysis both financial and financial performance that have many interest and parties, so this research is further referred to as stakeholder approach.
Legitimacy Theory
expla-ined that legitimacy theory is very useful in analyzing the behavior of the organization. The constraints imposed by norms, social values, and reaction of restrictions encourage the importance of organi-zational behavior analysis with respect to the envi-ronment. Disclosure of corporate social response-bility is to get a positive value and legitimacy from public, so this research is further referred to as legiti-macy approach.
Return on Equity (ROE)
Return on Equity (ROE) is the ratio of net income to total equity. The higher of ROE indicates more efficiently the company uses its own capital to generate profit or net profit. ROE is used to measure the rate of return on the company or the effectiveness of the company in profit using share-holders' equity owned by the company (Ardimas and Wardoyo, 2014).
Earnings per Share (EPS)
Earnings per share is computed by dividing earnings after interest, the depreciation and tax by total number of outstanding shares. Dividend may be distributed out of these earnings; whether it is distri-buted as dividend to shareholders or not, it belongs to the shareholders. Hence earning per share is a measure which the stock brokers and investors will watch carefully and consider it while deciding the market value of the equity share (Nazaruddin, 2000).
Market Value Added (MVA)
The main objective of the company is to maximize shareholder’s wealth. This goal can be realized in a way to maximize firm value (Market Value of Firm). Maximize firm value equal to the share price maximization. Prosperity shareholders can be maximized by maximizing the difference between the market value of equity to equity (own capital) are submitted to the company by the shareholders (owners of the company). The differ-rence is called the Market Value Added (MVA) (Husnan and Pudjiastuti, 2004).
Corporate Governance
Corporate governance is a set of mechanisms that direct and control enterprise in order to run company operations in accordance to the stake-holder’s expectations. Good corporate governance is the structures, systems, and processes used by the organs of company in an effort to provide sustainable
value added in long term by taking into account the interests of other stakeholders based on norms, ethics, cultures, and regulations (The Indonesian Institute for Corporate Governance).
Corporate Governance Mechanism
Corporate governance mechanism is divided into two groups, internal and external control mechanism. First, internal control mechanism is a way to control company using internal structures and processes, such as the composition of board of directors or commissioners, managerial ownership, and executive compensation. Second, external control mechanism is a way to affect company using external factors, such as market control and debt financing level (Barnhart and Rosenstein, 1998).
Corporate governance mechanism used in this study is internal control mechanism. It is proxied by earnings quality, institutional ownership, indepen-dent commissioners, and audit committee.
(1) Earnings Quality (EQ),
Earnings quality is a key characteristic of financial reporting. Dechow et al. (2010) said that higher quality earnings provide more information about the features of a firm’s financial performance that are rele -vant to a specific decision made by a specific decision-maker.
(2) Institutional Ownership (IO)
According to Adrian Sutedi (2011), insti-tutional ownership is ownership of shares that owned by institutions such as insurance companies, banks, investment companies, foundations, pension funds, and others. It has very important role in minimizing agen-cy conflict between manager and sharehol-der.
(3) Independent Commissioner
Independent commissioners are all of com-missioners who do not have any substantial business interests in the company. Indepen-dent commissioners serve as a counterweight in decision making.
(4) Audit Committee
Corporate Social Responsibility
The definition of social responsibility based on ISO 26000: Global Guidance Standard on Social Responsibility is responsibility of an organization for the impacts of its decisions and activities on society and environment, through transparent and ethical behavior that contributes to the sustainable develop-ment, health, and society welfare; takes into account the expectations of stakeholders; that is in com-pliance with applicable law and consistent with inter-national norms of behavior; and that is integrated throughout the organization and practiced in its relationships.
ISO 26000 is a voluntary guidance standard on social responsibility that is designed to used by all types of organizations, whether for profit or non-profit organizations. ISO 26000 provides guidance rather than requirements or standardization. There-fore, it cannot be certified like some other well-known ISO standards. It provides guidance on how organization can operate in a socially responsible way, act in an ethical and transparent way that contributes to the health and social welfare.
Disclosure of Corporate Social Responsibility
In recent years, the growth of public awareness about company role has increased. It can be seen from the number of companies that are considered having high contribution to economic and techno-logy progress, but they still has been criticized for creating some social problems. Pollution, resource depletion, waste, quality and product safety, and employee’s rights are issues of public concerns.
ISO 26000: Guidance Standard on Social Responsibility identifies seven core subjects where social responsibility should be addressed. In order to identify what they do in their current practices and to set priorities for improvements, implementers of ISO 26000 should evaluate their actions in each sub-ject. These are; Organizational governance; Human rights; Labor practices; Environment; Fair operating practices; Consumer issues; and Community involve-ment and developinvolve-ment.
Firm Performance
There are several objectives of establishing a company, such as achieving maximum benefit or profit as much as possible, giving prosperity to the owner and shareholders, and maximizing firm performance that is reflected in its stock price. Actually, three company goals are not substantially different. Only the emphasis that to be achieved by
each company is not same (Martono and Harjito, 2005). Firm performance is essentially measured from several aspects. According to Fama (1978) cited by Wahyudi dan Pawestri (2006), firm value is reflected in its stock price. It is because market price of com-pany stock reflects investor’s assessment for overall equity held. According to Rahayu (2010), firm value describes how well management manage the wealth. A company will try to maximize firm value. Incre-asing firm value is usually characterized by increasing stock prices in the market.
Relationship Between Return on Equity and Firm Performance
One company operates is useful to generate profits for shareholders. The size of the successful achievement of these reasons is the number ROE achieved. The bigger the ROE reflects the com-pany's ability to generate high returns for share-holders. Research by Ardimas and Wardoyo (2014) stated that ROE have a significant effect on firm value. Moreover, Febriana (2013) indicated that ROE has positively significant to firm value and CSR can not approve that the relationship between ROE to firm value and research of Amri (2011) also stated that ROE and CSR have a significant effect on firm value. Although the results has shown significant result, to prove these finding between Indonesia and Thailand, the hypothesis is as follows:
H1.A: The existence of Return on Equity affect firm
performance positively.
Relationship Between Earnings per Share and Firm Performance
Several studies have shown that the earnings quality will affect market response to corporate profits (Choi and Jeter, 1990). Implementation of good corporate governance is expected to improve the market's perception of the quality of corporate profits. Improving the earnings quality will be followed by increase market response to earnings surprises. Research by Yulistiana (2009) find that EPS has positively significant to firm performance. Although the results has shown significant result, to prove these finding between Indonesia and Thai-land, so the hypothesis is as follows:
H1.B: The existence of Earnings per Share affect firm
performance positively.
Relationship Between Market Value Added and Firm Performance
value of debt and total equity capital of the company is used to support value-added. MVA is a measure used to measure success in maximizing shareholder value by allocating resources - the appropriate source. MVA also can measure how much wealth the company that has been created for investors or MVA express how much wealth has been achieved (Husniawati, 2004). Furthermore, Aditiya (2013) indicated that MVA has positively significant to firm performance. Although the results has shown significant result, to prove these finding between Indonesia and Thailand, the hypothesis is as follows: H1.C: The existence of Market Value Added affect
firm performance positively.
Relationship Between Earnings Quality and Firm Performance
Several studies about relationship between Earning Quality and Firm Performance have shown inconsistency result. Research by Choi and Jeter (1990) indicated that the earnings quality will affect market response to corporate profits. Implemen-tation of good corporate governance is expected to improve the market's perception of the quality of corporate profits. Furthermore, Siallagan (2009) found that Earnings quality has negatively significant to firm performance. Mendra and Widanaputra (2012) indicated that corporate governance has significant positive influence to the performance of public companies. Based on these finding, the hypothesis is as follows:
H2.A: The existence of Earnings Quality affect firm
performance positively.
Relationship Between Institutional Ownership and Firm Performance
Research by some researchers about Institu-tional Ownership and Firm Performance shows inconsistency result. Institutional ownership is ownership of substantial shares in company by an institution. High levels of institutional ownership will lead to greater business security conducted by institutional investors. It is caused they can deter opportunistic behaviors of manager. The higher ownership by financial institutions, it will increase firm value. Rachmawati and Triatmoko (2007) found that institutional ownership had significant and positive effect to firm value. Research by Debby et al. (2013) indicated that GCG does not affect firm value and Company characteristics have positive effect on firm value. Based on these finding, the hypothesis is as follows:
H2.B: The existence of institutional ownership affect
firm performance positively.
Relationship Between Independent Commissioners and Firm Performance
Independent commissioners are all of commi-ssioners who do not have any substantial business interest in the company. They serve as a counter-weight in decision making. They act solely for company interest that will increase firm value. Siallagan and Machfoedz (2006) proved that inde-pendent commissioners affected firm value positively and significantly. Furthermore, Mendra and Wida-naputra (2012) indicated that corporate governance has significant positive influence to the performance of public companies. Although the results has shown significant result, to prove these finding between Indonesia and Thailand, the hypothesis is as follows: H2.C: The proportion of independent commissioner
affect firm performance positively.
Relationship Between Audit Committee and Firm Performance
One of indicators that can be used to determine the quality of audit committee is the frequency of their meeting. The more meeting frequency of audit committee, the better coordination of audit commi-ttee in conducting supervision. Therefore, it can ensure that their monitoring activities for mana-gement can run effectively. Research by Debby et al. (2013) indicated that GCG does not affect firm value and Company characteristics have positive effect on firm value. Furthermore, Mendra and Widanaputra (2012) indicated that corporate gover-nance has significant positive influence to the performance of public companies. Based on these finding, the hypothesis is as follows:
H2.D: The meeting frequency of audit committee
affect firm performance positively.
Relationship Between Disclosure of CSR and Firm Performance
Furthermore, by implementing CSR, company expected will gain social legitimacy and maximize strength finances in long term (Kiroyan,2006). It indicates that market wili respond positively com-pany that implement CSR. Ardimas and Wardoyo (2014) also stated that CSR have a significant effect on firm value. Research by Febriana (2013) indicated that CSR can not approve that the relationship between ROE to firm value. The researh result of Amri (2011) also stated CSR have a significant effect on firm value. Other result showed that Balabanis, Phillips, and Lyall (1998), shows that CSR is positively related to financial performance (gross profit to sales ratio / GPS), but negatively related to return on capital employed (ROCE). Based on these finding, the hypothesis is as follows:
H2.E: The disclosure of corporate social responsibility
affect firm performance positively.
RESEARCH METHOD
Observation
The observation data used in this study is manufacturing sectors listed on the Indonesia Stock Exchange (IDX) and Stock Exchange of Thailand (SET) in 2011 until 2013. In 2013, the Indonesia Stock Exchange had 462 listed companies with a combined market capitalization of $426.78 billion and in the Stock Exchange of Thailand (SET) had 584 listed companies with a combined market capitalization of THB 11,496 billion.
The criteria samples are: Shares of companies listed on the IDX & SET for 3 years in a row and The company publishes the annual financial state-ments of the period 31 December 2011 until 31 December 2013. There were 55 companies in Indo-nesia and 50 companies in Thailand that represent the object of observation and meet the above requirements.
Data and Sources
Data used in this study is secondary data source from www.idx.co.id and www.set.ac.th and also from data stream. The data needed in this study include data from the manufacturing sectors as industrial group that go public during 2011-2013.
Data Analysis
The model equations are used as follows: Yi = + 1 ROEi + 2 EPSi + 3 MVAi + ei…
(Equation 1)
Yi = + 4 EQi + 5 IOi + 6 ICDi + 7 ACi + 8 CSRi+
ei ... (Equation 2)
Yi= + 1 ROEi + 2 EPSi + 3 MVAi + 4 EQi + 5
IOi + 6 ICi + 7 ACi + 8 CSRi + ei… (Equation 3)
Where:
Y = Firm Performance ROE = Return on Equity EPS = Earnings per Share MVA = Market Value Added EQ = Earning Quality
IO = Institutional Ownership IC = Independent Commissioner AC = Audit Committee
CSR = Corporate Social Responsibility e = Residual Term
Analysis Technique
Descriptive Statistics Analysis
Descriptive statistics is used to analyze data in ways describing or depicting data that has been collected without any intention to make generally accepted conclusions or generalizations. It described in their minimum value, maximum value, mean, and standard deviation.
Classical Assumptions Test
Good regression model is a model that passes all of classical assumption test (Ghozali, 2009), includes Normality Test, Multi collinearity Test, Autocorrelation Test, and Heterocedastisity Test.
(1) Normality Test. It is done to determine whether research data or residual values of data have a normal distribution or not. Good regression model is model whose distribution of data is normal or close to normal.
(2) Multi collinearity Test. It aims to test whether there is a correlation among independent variables in the regression model. A good regression model should not have correlation among independent variables. In order to detect the existence multi collinearity in the regression model, it can be seen from the value of tolerance and the value of Variance Inflation Factor (VIF).
Figure 1. Research Model
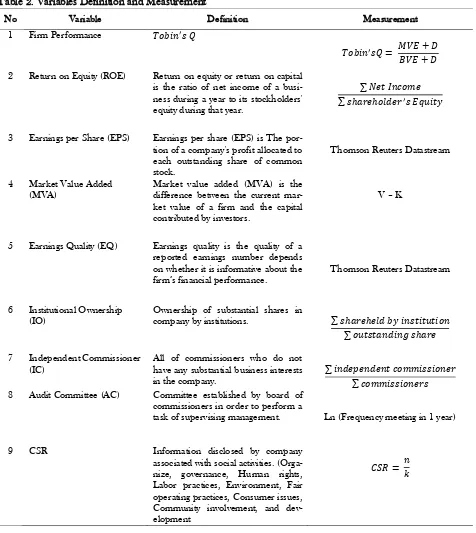
Table 2. Variables Definition and Measurement
No Variable Definition Measurement
1 Firm Performance
2 Return on Equity (ROE) Return on equity or return on capital is the ratio of net income of a busi-ness during a year to its stockholders' equity during that year.
3 Earnings per Share (EPS) Earnings per share (EPS) is The por-tion of a company's profit allocated to each outstanding share of common stock.
Thomson Reuters Datastream
4 Market Value Added (MVA)
Market value added (MVA) is the difference between the current mar-ket value of a firm and the capital contributed by investors.
V – K
5 Earnings Quality (EQ) Earnings quality is the quality of a reported earnings number depends on whether it is informative about the
firm’s financial performance.
Thomson Reuters Datastream
6 Institutional Ownership (IO)
Ownership of substantial shares in
company by institutions.
7 Independent Commissioner (IC)
All of commissioners who do not have any substantial business interests in the company.
8 Audit Committee (AC) Committee established by board of commissioners in order to perform a
task of supervising management. Ln (Frequency meeting in 1 year)
9 CSR Information disclosed by company
associated with social activities. (Orga-nize, governance, Human rights, Labor practices, Environment, Fair operating practices, Consumer issues, Community involvement, and dev-elopment
Financial Variables (ROE, EPS, and MVA)
Non-Financial Variables (EQ, IO, IC, AC, and CSR)
(4) Heterocedastisity Test. It is a situation where there is inequality of regression model resi-dual variance from one observation to other observations. It can be seen from the value of Prob* R-Squared. If Prob* R-Squared is higher than 0.05, it can be concluded that there is no heterocedasticity.
Regression Analysis
(1) Simultaneous Significant Test (F-test)
F test basically shows whether all of indepen-dent variables included in regression model have an influence collectively or simultane-ously on dependent variable.
(2) Partial Significant Test (t-test)
Basically, t-test shows how far the influence of independent variables in explaining depen-dent variable individually.
(3) R2
and the Adjusted R2
An important property of R2
is that it is a non decreasing function of the number of expla-natory variables or regressors present in the model; as the number of regressors increases, R2
almost invariably increases and never decreases. Stated differently, an additional X variable will not decrease R2
.
RESULTS AND DISCUSSION
Description of Research Object
There are 55 companies in Indonesia and 50 companies in Thailand that represent the object of observation and meet the requirements.
Data Analysis
Descriptive Statistics Analysis
Descriptive statistics is used to analyze data in ways describing or depicting data without any inten-tion to make generally accepted conclusions or generalizations (see Table 3 and 4). In this section, each variable that has been processed will be described in its minimum value, maximum value, mean value, and standard deviation.
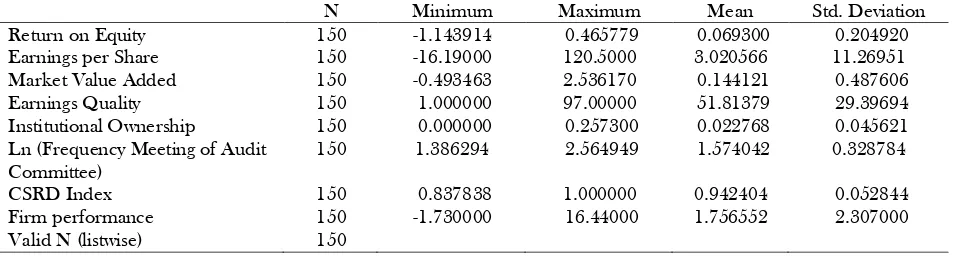
Based on the results in Indonesia, Earnings per share have the biggest maximum value 4300 than others, while its minimum value -2537.21. Mean value of this variable is 181.64 with standard devia-tion of 595.03. For Thailand, Earnings per share have the biggest maximum value 120.50 than others. While its minimum value -16.19. Mean value of this variable is 3.02 with standard deviation of 11.26.
Table 3. Descriptive Statistics Analysis - Indonesia
N Minimum Maximum Mean Std. Deviation
Return on Equity 165 -1.500000 1.520000 0.053598 0.250464
Earnings per Share 165 -2537.212 4300.000 181.6441 595.0397
Market Value Added 165 -1.038080 3.384081 0.032382 0.604296
Earnings Quality 165 1.000000 93.00000 30.20122 27.42736
Institutional Ownership 165 0.000000 0.273900 0.020341 0.050976 Independent Commissioner 165 0.250000 0.500000 0.377972 0.079754 Ln (Frequency Meeting of
Audit Committee)
165 0.000000 4.564348 1.621326 0.601703
CSRD Index 165 0.000000 1.000000 0.912986 0.187585
Firm performance 165 -5.000000 11.92000 1.487744 2.071805
Valid N (listwise) 165
Table 4. Descriptive Statistics Analysis - Thailand
N Minimum Maximum Mean Std. Deviation
Return on Equity 150 -1.143914 0.465779 0.069300 0.204920
Earnings per Share 150 -16.19000 120.5000 3.020566 11.26951
Market Value Added 150 -0.493463 2.536170 0.144121 0.487606
Earnings Quality 150 1.000000 97.00000 51.81379 29.39694
Institutional Ownership 150 0.000000 0.257300 0.022768 0.045621 Ln (Frequency Meeting of Audit
Committee)
150 1.386294 2.564949 1.574042 0.328784
CSRD Index 150 0.837838 1.000000 0.942404 0.052844
Firm performance 150 -1.730000 16.44000 1.756552 2.307000
Higher earnings per share is always better than a lower ratio because this means the company is more profitable and the company has more profits to distribute to its shareholders.
Institutional ownership in Indonesia has the lowest maximum value 0.273 than others, while its minimum value of 0. Mean value of this variable is 0.0203 or 2.03 percent with standard deviation of 0.05. It means that institutional investors have 2.03 percent of company share. For Thailand, Institu-tional ownership has the lowest maximum value 0.257 than others, while its minimum value of 0. Mean value of this variable is 0.0227 or 2.27 percent with standard deviation of 0.045. It means that institutional investors have 2.27 percent of company share. Larger institutional ownership is assumed can accelerate management to present good perfor-mance.
Classical Assumptions Test
Good regression model is a model that passes all of the classical assumption test (Ghozali, 2009), included Normality Test, Multicollinearity Test, Auto-correlation Test, and Heterocedastisity Test. From the tests that have been done, it can be concluded that there are no deviating results.
Normality Test
Normality test is done to determine whether research data or residual values of data have normal distribution or not. For Indonesia, Kurtosis is 8.87, It means that it’s non-normal distribution. The standard normal distribution has a kurtosis of three, and 2– 3 is often used so that the reference normal normal distribution. It’s skewed right because it has positive values for the skewness. Kurtosis is 10.28, it
means that it’s non-normal distribution. The
standard normal distribution has a kurtosis of three, and 2– 3 is often used so that the reference normal
distribution has a kurtosis of zero ( 2 – 3 is
some-times denoted as ϒ2), De Carlo (1997). In addition,
positive kurtosis indicates a "peaked" distribution. Multicollinearity Test
According to Ghozali (2005), a good regression model does not contain multicollinearity if its tole-rance value is higher than 0.1 (toletole-rance > 0.1) or VIF is smaller than 10 (VIF < 10). For Indonesia, there are two independent variables that have tole-rance value less than 0.1 and there are no independent variables that have VIF more than 10.
Although MVA and AC have VIF less than 10 which are 1.20 and 1.03, but they have tolerance value less than 0.1 which are 0.06 and 0.05. It can be concluded that there is correlation among indepen-dent variables so that multicollinearity did happen in this regression model. Because AC has probability 0.96, it’s more than 0.05. It’s not significant. Whereas MVA has probability 0.00, it’s less than 0.05, it’s significant. So that AC was excluded from the regression model. There is one of independent variable that has tolerance value less than 0.1 which is MVA and there are no independent variables that have VIF more than 10. It can be concluded that there is correlation among independent variables so that it has multicollinearity in this regression model.
However, for Thailand, there are two inde-pendent variables that have tolerance value less than 0.1 and there are no independent variables that have VIF more than 10. Although EPS and MVA have VIF less than 10 which are 1.08 and 1.24, but they have tolerance value less than 0.1 which are 0.00 and 0.08. It can be concluded that there is correlation among independent variables so that multicolli-nearity did happen in this regression model. Because EPS has probability 0.59, it’s more than 0.05, It is not significant. Whereas MVA has probability 0.00, it’s less than 0.05, it’s significant. So that EPS was excluded from the regression model. There is one of independent variable that has tolerance value less than 0.1 which is MVA and there are no independent variables that have VIF more than 10. It can be concluded that there is correlation among independent variables so that multicollinearity did happen in this regression model.
Heterocedasticity Test
Heterocedasticity test used white’s general heterocedasticity. The white test regresses the squa-red residuals on the cross product of the original regressors and a constant. In Indonesian company, Prob* square value is 61.41. Because of Prob* R-square is higher than 0.05, It can be concluded that there is no heteroscedasticity happened in this regression model. In Thailand company, Prob* R-square value is 97.90. Because of Prob* R-R-square is higher than 0.05, It can be concluded that there is no heterocedasticity happened in this regression model.
Multiple Regression Analysis
hetero-cedasticity happened in this regression model. These conditions fulfill the requirements to conduct multi-ple regression analysis in order to test hypo-theses.
Table 5. Regression - Indonesia
Variable Model 1 Model 2 Model 3
Notes: * significant at the 0.1 level,** significant at the 0.05 level,*** significant at 0.01 level
As can be seen from Table 5, model 1 reveals the relationship between financial variables and firm performance of Indonesian dataset. The results show that EPS and MVA have positively significant relationship to the firm performance whereas the ROE does not have significant relationship to the firm performance. So, the statement of hypothesis 1 about financial variables (EPS and MVA) have positively significant to firm performance is accepted. Model 2 reveals the relationship between non-financial variables and firm performance of Indo-nesian dataset. The results show that EQ and IO have significant relationship even though EQ has negative effect to the firm performance. IC and CSR do not have significant relationship to the firm performance. So, the statement of hypothesis 2 about non-financial variable (IO) have positively significant to firm performance is accepted.
Model 3 reveals the relationship between finan-cial and non-finanfinan-cial variables to firm performance of Indonesian dataset. The results show that EPS, MVA, and IO have positively significant relationship to the firm performance, while EQ has negatively significant relationship effect to the firm perfor-mance. ROE, IC and CSR do not have significant relationship to the firm performance. So, the state-ment of hypothesis 3 about financial (EPS and MVA) and non-financial variables (IO) have posi-tively significant to firm performances is accepted.
The coefficient of Adjusted R Square of model 1 is 0.2071. It means that 20.71 percent of firm performance can be explained by return on equity, earnings per share, market value added as indepen-dent variables, while the rest can be explained by other factors. However, the coefficient of Adjusted R Square of model 2 is 0.1039. It means that 10.38 percent of firm performance can be explained by earnings quality, institutional ownership, indepen-dent commissioner, and corporate social respon-sibility as independent variables, while the rest can be explained by other factors.
Furthermore, the coefficient of Adjusted R Square of model 3 is 0.2795. It means that 27.95 percent of firm performance can be explained by return on equity, earnings per share, market value added, earnings quality, institutional ownership, independent commissioner, and corporate social responsibility as independent variables, while the rest can be explained by other factors. Based on the three models in this study, model (3) has the most goodness of fit. The third model has the highest value of adjusted R square of 0.2795, whereas the first model of 0.2071 and a second model of 0.1038. It means that 27.95 percent of firm performance can be explained by financial and non-financial variables as independent variables, while the rest can be explained by other factors.
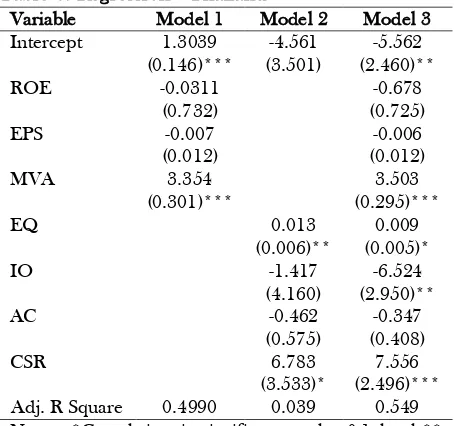
Table 6. Regression - Thailand
Variable Model 1 Model 2 Model 3 *** Correlation is significant at the 0.01 level
not have significant relationship to the firm perfor-mance. So, the statement of hypothesis 1 about financial variable (MVA) has positively signifycant to firm performance is accepted. Model 2 reveals the relationship between non-financial variables and firm performance of Thailand dataset. The results show that EQ and CSR have positively significant relationship to the firm performance. IO and AC do not have significant relationship to the firm perfor-mance. So, the statement of hypothesis 2 about non-financial variables (EQ and CSR) have positively significant to firm performance is accepted.
Model 3 reveals the relationship between financial and nonfinancial variables to firm perfor-mance of Thailand dataset. The results show that MVA, EQ, and CSR have positively significant relationship to the firm performance, while IO has negatively significant relationship effect to the firm performance. ROE, EPS, and AC do not have signi-ficant relationship to the firm performance. So, the statement of hypo-thesis 3 about financial (MVA) and non-financial variables (EQ, IQ and CSR) have positively significant to firm performance is accep-ted.
In Thailand company, the coefficient of Adjus-ted R Square of model 1 is 0.4990. It means that 49.90 percent of firm performance can be explained by return on equity, earnings per share, and market value added as independent variables, while the rest can be explained by other factors. Moreover, the coefficient of Adjusted R Square of model 2 is 0.0390. It means that 3.90 percent of firm perfor-mance can be explained by earnings quality, insti-tutional ownership, meeting of audit committee, and corporate social responsibility as independent varia-bles, while the rest can be explained by other fac-tors. Furhermore, the coefficient of Adjusted R Squ-are of model 3 obtained is 0.5490. It means that 54.90 percent of firm performance can be explained by return on equity, earnings per share, market value added, earnings quality, institutional owner-ship, meeting of audit committee, and corporate social responsibility as independent variables, while the rest can be explained by other factors.
Based on the three models in this study, model (3) has the most goodness of fit. This is because the third model has the highest value of adjusted R square of is 0.5490, whereas the first model of 0.4990 and the second model of 0.0390. It means that 54.90 percent of firm performance can be explained by financial and non-financial variables as independent variables, while the rest can be explainnned by other factors.
Based on data in Indonesia, the financial varia-bles that is not significant is ROE. It is implied that
to the company prospect. implementing CSR, company expected will gain social legitimacy and maximize strength finances in long term (Kiro-variabel that is not significant are EPS and ROE. It is implied that ROE can not predict the firm performance in Thailand so business companies especially manufacturing companies in Thailand can not use it to predict their company value. The size of the successful achievement of these reasons is the number ROE achieved. The bigger the ROE reflects the company's ability to generate high returns for shareholders. The result is not support research by Ardimas and Wardoyo (2014), Febriana (2013), and Amri (2011) that shows significant results. Moreover, Improving the earnings quality will be followed by increase market response to earnings surprises. This result is not support study by Yulistiana (2009).
The result of relationship between MVA and firm performance from Thailand Models has significant relationship. MVA is a measure used to measure success in maximizing shareholder value by allocating resources - the appropriate source. MVA also can measure how much wealth the company that has been created for investors or MVA express how much wealth has been achieved (Husniawati, 2004). It is support result by Aditiya (2013) indi-cated that MVA has positively significant to firm performance.
However, non financial variables that is not significant in Thailand are Independence Comitte, Audit Comiitee and Corporate Social Respon-sibility. It means that business companies can not be used these variables to predict or expla-ined the fluctuation the firm value performance. CSR does not have effect to firm performance in Thailand. CSR disclosure is expected to increase investor trust to the company prospect. By imple-menting CSR, company expected will gain social legitimacy and maximize strength finances in long term (Kiro-yan,2006). It indicates that market will not respond positively company that implement CSR. It is not support research by Orlitzky et al. (2003) in Karim (2013), Ardimas and Wardoyo (2014), Febriana (2013), Amri (2011), Balabanis, Phillips, and Lyall (1998).
Moreover, Earning Quality and Institutional Ownership has significant relationship to firm
per-formance. Earnings quality will affect market res-ponse to corporate profits (Choi and Jeter, 1990). Implementation of good corporate governance is expected to improve the market's perception of the quality of corporate profits. It is support study by Siallagan (2009) and Mendra and Widanaputra (2012). Furthermore, High levels of institutional ownership in companies will lead to greater business security conducted by institutional investors. The higher ownership by financial institutions, it will increase firm value. It is support study by Rach-mawati and Triatmoko (2007) and Debby et al. (2013).
CONCLUSION
In comparison between Thailand and Indo-nesia, EPS is not significant for Thailand company, but it’s positively significant for Indonesia company. MVA is positively significant to firm performance for both Thailand and Indonesian companies. ROE is not significant to firm performance for both Thailand and Indonesian company. However, EQ is positively significant for Thailand but negatively significant for Indonesia. Similarly, we found that IO is positively significant for Indonesia but negatively significant for Thailand. Both IC and AC are not significant in Thailand and Indonesia. CSR is positively significant for Thailand but not significant for Indonesia.
This research has significant impact to business community. Although not all variables does not have significant effect to firm performance, Business companies especially manufacturing companies in Indonesia can use EPS and MVA to predict their company performance. The earnings quality will affect market response to corporate profits (Choi and Jeter, 1990). Implementation of good corporate governance is expected to improve the market's perception of the quality of corporate profits. Improving the earnings quality will be followed by increase market response to earnings surprises. With higher earnings quality (lower discretionary accrual) will be responded positively by a third party, thus the value of the company will be higher.
Based on the analysis and discussion and con-clusions, the limitation for this research are: first, the data conducted from 2011 to 2013 and only manufacturing companies, so more number of sam-ples and longer observation years can be used by next researchers. Second, others financial variable besides return on equity, earnings per share, and market value added can be used by next research-ers. Third, others corporate governance mechanism besides earnings quality, institutional ownership, audit committee and proportion of independent commissioner as independent variables and use other measurement for each mechanism can be used by next researchers. Finally, other parties in determining the extent of CSR disclosure as a re-examination can be involved by next researchers.
REFERENCES
Amri, C. 2011. Analysis of The Influence Financial Performance, Good Corporate Governance and Corporate Social Respon-sibility of Companies. (Online). http://library.gunadar-ma.ac.id accessed in September 2013.
Ardimas and Wardoyo. 2014. Pengaruh Kinerja Keuangan dan Corporate Social Respon-sibility terhadap Nilai Perusahaan Bank GO Publik yang Terdaftar di BEI. BENEFIT Jur-nal Manajemen dan Bisnis, 18 (1), 57 – 66. Barnhart, S. and S. Rosenstein. 1998. Board
Composition, Managerial Ownership and Firm Performance: An Empirical Analysis. The Financial Review, 33 (4), November 1998. (Online). http://papers.ssrn.com acces-sed in December 2013.
Brigham, E. F. and J. F. Houston. 2006. Dasar-Dasar Manajemen Keuangan, alih bahasa Ali Akbar Yulianto, Buku Satu, Edisi Sepuluh. Jakarta : Salemba Empat.
Debby, J. F., Mukhtaruddin, E. Yuniarti, D. Saputra, and Abukosim. 2013. The Effect of
Good Corporate and Company’s Charac
-teristics to Firm’s Value of Listed Banking at
Indonesian Stock Exchange. Paer was Presen-ted at 3rd
Annual International Conference on Accounting and Finance. May 20 - 21, 2013 in Bangkok, Thailand.
Dechow, P., W. Ge and C. Schrand. 2010. Understanding earnings quality: A review of the proxies, their determinants and their
consequences”. Journal of Accounting and
Economics, 50 (2), 344–401.
Febriana. 2013. Pengaruh Return on Equity Terha-dap Nilai Perusahaan Dengan Pengungkapan
Corporate Social Responsibility Seba-gai Variable Pemoderasi pada Perusahaan Dalam Jakarta Islamic Index (JII) Periode 2009-2011. Skripsi, Universitas Islam Negeri Sunan Kalijaga.
Ghozali, I. and A. Chariri. 2007. Teori Akuntansi. Semarang: Penerbit Universitas Diponegoro. Ghozali, I. 2005. Analisis Multivariate dengan
Prog-ram SPSS. Semarang: Penerbit Universitas Diponegoro.
Ghozali, I. 2009. Ekonometrika Teori, Konsep dan Aplikasi dengan SPSS 17. Semarang: Pener-bit Universitas Diponegoro.
Indonesia Stock Exchange. (Online). www.idx.co.id. ISO 26000 Handbook. (Online). www.ecologia.org. Karim, N. K., Mukhtaruddin, T. Marwah,
Abukosim, and Y. Saftiana. 2013. The Quality of Voluntary Corporate Social Responsibility Disclosure Effect on The Firm Value of Service Companies Listed in The
Indonesian Stock Exchange”. Paper was
Presented at 3rd
Annual International Confe-rence on Accounting and Finance. May 20-21, 2013 in Bangkok, Thailand
Komite Nasional Kebijakan Governance. Pedoman Umum GCG Indonesia. 2006. (Online). (www.ecgi.org accessed in September 2013). Martono dan H. Agu. 2005. Manajemen Keuangan,
Edisi Pertama, Cetakan ke Empat. Jakarta: Jala Sutia.
Mendra, N. P. Y. and A. A. G. P. Widanaputra. 2012. Pengaruh Corporate Governance Pada Kinerja Perusahaan. JUARA: Jurnal Riset Akuntansi, 2 (1),
Nazaruddin, I. 2000. Pengukuran Kinerja Non Finansial: Suatu Cara meningkatkan ‘Value’ Perusahaan. Jurnal Akuntansi dan Investasi, 1 (1), 32-40.
Rachmawati, A. and H. Triatmoko. 2007. Analisis Faktor-Faktor yang Mempengaruhi Kualitas Laba dan Nilai Perusahaan. Paper was Presented at Simposium Nasional Akuntansi X. Makasar.
Sayekti, Y. and Wondabio. 2007. Pengaruh CSR Disclosure Terhadap Earning Response Coefficient. Paper was Presented at Simposium Nasional Akuntansi X. Makasar. Siegel, D. S. and C. J. M. Paul. 2006. Corporate
Social Responsibility and Economic Perform-ance. Springer Science and Business Media, 26, 207-211.
Siallagan. 2009. Pengaruh Kualitas Laba Terhadap Nilai Perusahaan. Jurnal Akuntansi Kontem-porer, 1 (1), 21-32.
Sugiyanto, E. K. 2011. Peningkatan Return Saham dan Kinerja Keuangan melalui Corporate Social Responsibility dan Good Corporate Governance. Aset, 13 (1), 47-56.
Undang–Undang No. 40 Tahun 2007 tentang Perse-roan Terbatas
Wahyudi, U. and H. Pawestri. (2006). Implikasi Struktur Kepemilikan Terhadap Nilai Peru-sahaan Dengan Keputusan Keuangan Sebagai Variabel Inetrving. Paper was Presented at Simposium Nasional Akuntansi IX, Padang. Yulistiana. 2009. Pengaruh Earnings per Share