Summary We tested the hypothesis that the leaf area/sap-wood area ratio in Scots pine (Pinus sylvestris L.) is influenced by site differences in water vapor pressure deficit of the air (D). Two stands of the same provenance were selected, one in western Scotland and one in eastern England, so that effects resulting from age, genetic variability, density and fertility were minimized. Compared with the Scots pine trees at the cooler and wetter site in Scotland, the trees at the warmer and drier site in England produced less leaf area per unit of con-ducting sapwood area both at a stem height of 1.3 m and at the base of the live crown, whereas stem permeability was similar at both sites. Also, trees at the drier site had less leaf area per unit branch cross-sectional area at the branch base than trees at the wetter site. For each site, the average values for leaf area, sapwood area and permeability were used, together with values of transpiration rates at different D, to calculate average stem water potential gradients. Changes in the leaf area/sapwood area ratio acted to maintain a similar water potential gradient in the stems of trees at both sites despite climatic differences between the sites.
Keywords: hydraulic architecture, Pinus sylvestris, stem per-meability, transpiration, xylem water potential.
Introduction
Plant responses to water deficits in the soil and humidity deficits in the atmosphere vary temporally and spatially (Ko-zlowski 1983, Kramer 1983). Over short time scales, leaves can acclimate through osmotic regulation, by changing sto-matal behavior or by increasing water use efficiency. Over longer time scales, structural modifications can be of major importance and growth patterns can change as a consequence of plant water stress. For example, leaf area and productivity are reduced, whereas the depth of the absorbing root system and the root/shoot ratio are increased.
Whole-tree responses to water deficits have received consid-erable attention in the last few years (Schulze 1986, Hinckley and Ceulemans 1989), particularly the role of plant structure on water absorption and transport processes (Jarvis 1975, Zimmermann 1983, Tyree and Ewers 1991). However, little is known about long-term acclimation as a result of which a
functional balance is maintained within the plant through changes in carbon allocation. Present models are based on either mechanistic processes of carbon partitioning or the use of empirically determined partitioning coefficients, which are generally based on the ‘‘pipe model’’ theory of plant form, i.e., on the relationship between leaf area (or leaf biomass) and stem or branch sapwood area (Valentine 1985, Makela 1986). Empirically derived coefficients are static; however, many studies have shown that the leaf area/sapwood area ratio can be influenced by variations in stand age (Albrektson 1984), density, thinning practices (Aussenac and Granier 1988, Poth-ier and Margolis 1991) and site fertility (Espinosa-Bancalari et al. 1987, Long and Smith 1988).
Thus, the leaf area/sapwood area ratio can only provide useful insights on plant--environment relationships if the vari-ables that contribute to the observed variation in the ratio are identified and this information included in models of plant growth (Grace 1992). Whitehead and Jarvis (1981) proposed an equation for the prediction of the slope of the leaf area/sap-wood area ratio (S) based on a combination of the Penman-Monteith equation (to describe the transpiration rate of a coniferous canopy) and the Darcy equation (to describe water flow through tree stems). The final theoretical expression for S is (Whitehead et al. 1984a):
S =k(∆Ψ/l)c Dgs ,
(1)
where k is the average tree permeability, ∆Ψ/l is the water potential gradient through the system, D is the time-averaged vapor pressure deficit of the air, and gs is an appropriately weighted stomatal conductance. The coefficient c is equal to:
c =ρwγλ
ηcpρa
, (2)
where ρw, γ, λ, η, cp and ρa are the density of water, the psychrometric constant, the latent heat of vaporization of water, the dynamic water viscosity, the specific heat of air at constant pressure and the density of air, respectively, all of which are, apart from water viscosity, only weakly dependent on temperature.
Climate influences the leaf area/sapwood area ratio in Scots pine
MAURIZIO MENCUCCINI
1,2and JOHN GRACE
31 University of Florence, Institute of Forest Ecology and Silviculture, Via S. Bonaventura 13, 50145 Firenze, Italy
2 Present address: Boyce Thompson Institute for Plant Research, Tower Road, Ithaca, NY 14853-1801, USA
3 University of Edinburgh, Institute of Ecology and Resource Management, Darwin Building, Mayfield Road, Edinburgh EH9 3JU, Scotland, U.K.
Received March 16, 1994
Edwards and Jarvis (1982) and Whitehead et al. (1984a, 1984b) used this equation to study Sitka spruce (Picea sitchen-sis (Bong.) Carr.) and lodgepole pine (Pinus contorta Dougl.) and found that variations in S among different species under the same climatic conditions were best accounted for by con-sidering variations in permeability. Coyea and Margolis (1992) used the same equation to compare S in 24 balsam fir (Abies balsamea (L.) Mill.) stands in Quebec and found that vari-ations in S were directly proportional to permeability and inversely proportional to tree height.
No systematic attempt has been made to evaluate the behav-ior of Equation 1 with respect to the Dgs term, i.e., to explore whether the leaf area/sapwood area ratio is influenced by variations in climate. In coniferous canopies, stomatal and surface conductances are reduced by increases in D (e.g., Tan and Black 1976, Jarvis 1981, Stewart 1988, Kelliher et al. 1993), but both field-based porometer and laboratory assimi-lation chamber studies have shown that an increase in transpi-ration rates with D still occurs (e.g., Whitehead et al. 1984b, Sandford and Jarvis 1986).
We hypothesized that a constant water potential gradient within tree stems at sites with different average vapor pressure deficits (and hence transpiration rates) is maintained through proportional changes in the leaf area/sapwood area ratio (see Equation 1). Alternatively, changes in gradients of stem water potential could occur. We tested these two hypotheses in a study of two matched stands in different climatic regions of the U.K., in which variability resulting from age and tree prove-nance was excluded.
The existence of feedback mechanisms in tree hydraulic architecture in response to drought may have considerable interest for modeling studies focused on the prediction of long-term effects in response to global warming and increases in atmospheric CO2.
Materials and methods
Site description
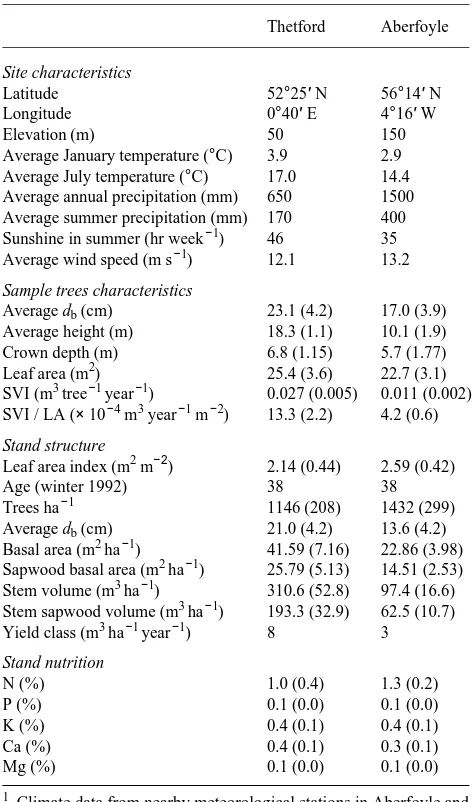
Two sites of Scots pine (Pinus sylvestris L.) in different cli-matic regions were selected: Thetford Forest in East Anglia, southeastern England, and Aberfoyle Forest in southwestern Scotland (Table 1a). Thetford Forest consists of over 200 km2 of mixed Scots and Corsican pine (Pinus nigra var. maritima (Ait.) Melv.). Average summer precipitation is 170 mm and average July temperature is 17.0 °C. During summer, D varies from 0.5 to 3 kPa, but seldom exceeds 1.5 kPa (Beadle et al. 1985b). The soil is sandy, easily drained, and with a deep chalky bedrock; details of soil characteristics are given by Corbett (1973). Aberfoyle Forest is located in a large forest district in southwestern Scotland. Most plantations comprise Sitka spruce and lodgepole pine. Average July temperature is 14.4 °C and summer precipitation is 400 mm. Typically, D is less than 1.0 kPa (G.E. Jackson, J. Irvine and J. Grace, per-sonal communication). Moreover, for much of the summer, the canopies are wet and transpiration from dry canopies is prob-ably limited to about 50% of the daylight period (e.g., Jarvis and Stewart 1979). Soils are gley-podsol and waterlogging is
locally frequent depending on the microtopography. Wind-throws are frequent and the stand does not have complete cover. Average wind speed is similar for the two sites.
In this study, Scots pine was the only species present. For-estry Commission archives were used to select the stands on the basis of age and origin. They were planted in 1954 and derive from the same seed lot of German origin. Because a seed lot is made up of the seed crop of a single year from a single seed collection area, genetic variability was uniform across sites.
Table 1. Geographic, climatic, structural and nutritional characteristics of the Thetford and Aberfoyle stands.1
Thetford Aberfoyle
Site characteristics
Latitude 52°25′ N 56°14′ N
Longitude 0°40′ E 4°16′ W
Elevation (m) 50 150
Average January temperature (°C) 3.9 2.9 Average July temperature (°C) 17.0 14.4 Average annual precipitation (mm) 650 1500 Average summer precipitation (mm) 170 400 Sunshine in summer (hr week−1) 46 35 Average wind speed (m s−1) 12.1 13.2
Sample trees characteristics
Average db (cm) 23.1 (4.2) 17.0 (3.9) Average height (m) 18.3 (1.1) 10.1 (1.9) Crown depth (m) 6.8 (1.15) 5.7 (1.77) Leaf area (m2) 25.4 (3.6) 22.7 (3.1) SVI (m3 tree−1 year−1) 0.027 (0.005) 0.011 (0.002) SVI / LA (× 10−4 m3 year−1 m−2) 13.3 (2.2) 4.2 (0.6)
Stand structure
Leaf area index (m2 m−2) 2.14 (0.44) 2.59 (0.42)
Age (winter 1992) 38 38
Trees ha−1 1146 (208) 1432 (299)
Sampling protocol
At each site, a study area of about 0.2 ha was defined and, within it, 10 trees were selected to represent all the diameter size classes. The largest size class was represented by a larger fraction compared to its real frequency (see later and Table 1b), to increase the accuracy of the estimation of large leaf area values. On each tree, total height, crown depth and diameter at breast height (db) were measured. The 10 trees on each site were cut down at the end of August 1992, i.e., during the period of maximum needle area and before the beginning of autumn needle fall (Beadle et al. 1982). All the needles were collected with the attached twigs, brought to the laboratory in black plastic bags and stored in a cold, constant temperature (2--4 °C) room until they were processed. The twigs were col-lected separately from each tree and whorl so that calculations of individual leaf biomass and area, and vertical leaf area distribution could be made. The heights of the whorls on the stem were measured to the nearest cm and the number of branches per whorl was recorded. The diameter at the base of each branch was also recorded (branch swelling excluded) and the sum of branch basal areas calculated. For each tree, two 0.5--0.6 m long stem sections were cut at heights of 1.3 m (BH) and at the base of live crown (BLC) and used for perme-ability measurements and estimation of sapwood and heart-wood cross-sectional areas.
To scale up from single trees to stand values, we selected four plots of approximately 300 m2 within each study area. Within each plot, db of all the trees was measured (Table 1c). Basal area was calculated by summing over the diameter distribution within each plot, and standing volume estimates were made from forest mensuration handbooks (Hamilton 1975). Estimates of stem and stem sapwood volumes for each plot were obtained from the intensively sampled trees and the values were adjusted for the difference between the sample basal area and the plot mean basal area (Cochran 1977).
Leaf area
In the laboratory, the twigs were sampled for each whorl by removing and drying a fraction of the total fresh mass (48 h at 80 °C). Total needle dry mass for each whorl was the product of total fresh mass and the ratio of needle dry mass to fresh mass of the sample. The proportion of needle mass for each needle age class was estimated based on a sample of six complete whorls per site, taken randomly from the 10 trees and representing three layers of the canopy (upper, middle and lower levels). The division of the canopy was based on the ecophysiological responses of needles to different light re-gimes (Beadle et al. 1985a). Specific leaf area was determined on 100 randomly selected needles for each age class (current, 1- and 2-year-old needles) and each canopy layer. Projected needle areas were measured with a Li-Cor area meter. For each canopy layer, values of projected needle area were obtained from needle dry mass based on the percentages of needle mass for each age class and the appropriate values of specific leaf area.
Leaf area for each tree in the four plots was calculated from its basal area using the relationships between sapwood basal
area and total basal area and between leaf area and sapwood area. The relationship between stem over-bark and sapwood diameter was determined for each study area, following the procedure of Whitehead (1978). Twenty cores from 10 trees were sampled and the corresponding stem over-bark diameter measured. Each core was immersed in a solution of o-toluid-ine, hydrochloric acid, distilled water and sodium nitrite (Shain 1967). This solution is known to react with free phenols which are more frequent in the heartwood. Values of leaf area index (LAI) were computed by summing the individual leaf areas of all trees within the four plots.
Vertical leaf area distribution was calculated assuming that leaf area for each whorl was evenly distributed in 10-cm intervals over a height of 1 m above the whorl and averaging leaf area for each interval over all the sample trees. Leaf area was then normalized with respect to the average sample needle area and then to the plot leaf area index. The mean height of the leaf area and the standard deviation of the leaf area with respect to height were calculated following Stephens (1969), and tests for significant skewness and kurtosis were made by means of standard statistical procedures (Snedecor and Co-chran 1967).
Permeability and conducting sapwood area
Stem water permeability was determined by the method de-scribed by Edwards and Jarvis (1982). Wood disks were stored in humid plastic bags at 2 °C. Before measurement, they were prepared by recutting about 15--20 cm from each end with a band saw, to give a sample of about 20 cm in length. The two surfaces were then chiseled to eliminate sawdust residues. The water used was freshly distilled, filtered through 0.3 and 0.1 µm filters, and then degassed using an ultrasonic pump under vacuum. The water was stored in 10 dm3 flasks and used within 2 days. The stem section was sandwiched between two Plexiglas plates, and the water was forced through the section under a constant head of water. The outflow of water was collected in a flask and weighed (± 0.01 g) every 3 min and, concurrently, the hydrostatic pressure difference and tempera-ture were recorded.
Water temperature was measured to 0.5 °C at the outflow port and values of dynamic water viscosity were obtained from tables. The sample length was measured to 1 mm on four sides and the average taken. The values of water flow (q, m3 s−1), length (l, m), sapwood area (As, m2), water viscosity (η, Pa s) and pressure drop (∆P, Pa) were used to calculate permeability following Darcy’s law (Siau 1984):
ki=
q η l As∆P
, (3)
where ki (m2) is the permeability of the ith sample.
Generally a rapid increase in permeability was observed until a plateau was reached. The samples were considered saturated when, after three consecutive measurements, perme-ability values did not increase further.
measurement session. The sample was then recut and the area measured on a new inner section close to the inflow port. An estimate of stem sapwood volume was obtained from measure-ments of stem volume assuming a constant proportion of sapwood area in relation to total basal area, as it was measured at BH and BLC. After recutting, two wood samples (about 30 cm3 each) were taken from the outer and the inner sapwood and from the heartwood for determination of relative water content (RWC). These were used as an independent check of wood saturation after the session. The same samples were also used to determine sapwood basic density (WD, dry mass/fresh volume, kg m−3). Fresh volume was determined by volume displacement.
Needle nutrient analysis
In February 1993, random samples of needles were taken from each age class and canopy layer to test for differences in fertility between study areas. The needles were dried, ground and analyzed for nitrogen, magnesium, calcium, phosphorus and potassium concentrations (Allen 1974). Altogether, about 25 samples representing different canopy positions and age-classes were taken for each study area.
Basal area increments
Increments over the last 3 years were calculated from the average of four measurements (± 0.1 mm) made with a binocu-lar microscope along two diameters on the BH sample sections of all 10 trees harvested at the two study areas. The calculated 1989 diameters together with those of 1992 were used to estimate annual individual tree volume growth rates (SVI). Volume growth was then compared with leaf area and an index of needle efficiency in stem volume growth was obtained (SVI/LA).
Physiological measurements
In a parallel investigation from May 1992 to June 1993, monthly measurements were taken of shoot stomatal conduc-tance, needle water potential and stem sapwood relative water content (G.E. Jackson, J. Irvine and J. Grace, personal commu-nication). Needle water potential (MPa) was measured at mid-day (Ψl). During summer 1992, it was also measured before dawn (Ψpd). On the same days, wind speed, incoming radiation and vapor pressure were measured above the canopy. Average weekly vapor pressure deficits were also obtained from the British Meteorological Office (British Meteorological Office, Bracknell) from two nearby stations (Aberfoyle and Hon-ington).
For summer days when field measurements were available, we calculated the resistance of the entire pathway from soil to leaves, Rp (MPa s m−1), as (Jarvis 1975):
Rp=Ψ
pd−Ψl− hρw g
Et ,
(4)
where Et (m s−1) is transpiration from the canopy and hρwg is the gravitational potential of a column of water of height h and density ρw under the acceleration due to gravity g (0.01 MPa
m−1). Canopy transpiration was calculated using the Penman-Monteith equation (Penman-Monteith and Unsworth 1990), as in Whitehead et al. (1984b).
Also, assuming that transpiration rate from an average indi-vidual in a stand where there are n stems per hectare is equal to Et/(ρwn), we calculated the resistance to water flow for an individual tree, Ri (MPa s m−3), as (Whitehead et al. 1984b):
Ri= nRp. (5)
Statistical analysis
Linear regression was used to relate leaf mass and area to sapwood area, permeability and sapwood area × permeability. Leaf area was also related to the sum of branch cross-sectional areas. We used analysis of covariance to determine if the regression coefficients between leaf area and sapwood area (or sapwood area × permeability) differed between the two sites.
Results
Vertical leaf area distribution
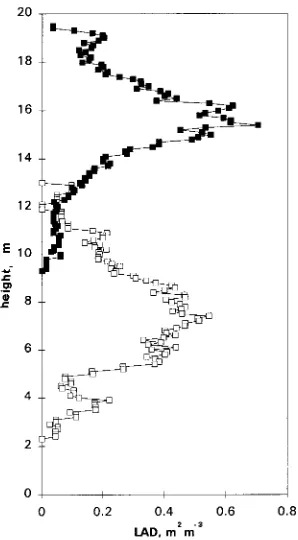
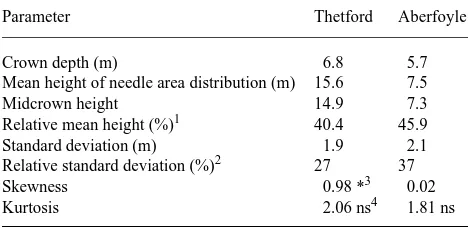
There were large differences in average tree height between sites, but crown depth and leaf area index were similar (Ta-ble 1). At both sites, the vertical distribution of leaf area resem-bled a normal curve, with the center of the needle area distributions above midcrown canopy height (Figure 1). The parameters used to describe the foliage distributions are given
in Table 2. The mean height was 40 and 46% of crown depth and the standard deviation of leaf area with respect to height was 27 and 37% of crown depth at the Thetford and Aberfoyle sites, respectively. No asymmetry was found in the trees at Aberfoyle, but the distribution was significantly skewed in the trees at Thetford, where a larger proportion of leaf area was above the mean canopy height than below it.
Comparison of tree properties between sites
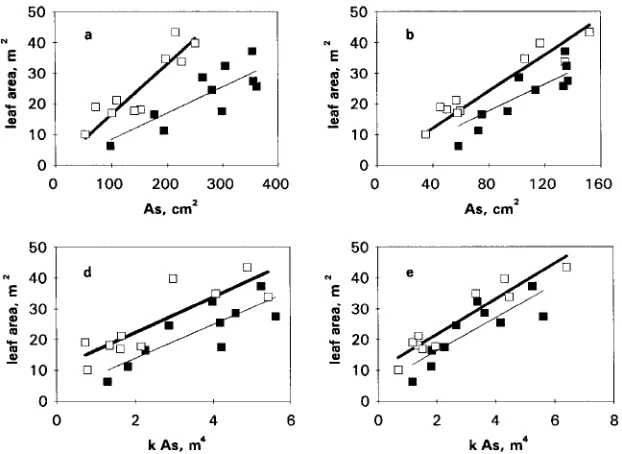
The parameters for the regression equations between leaf mass (kg) or leaf area (m2) and sapwood cross-sectional area at BH and BLC, sum of branch cross-sectional area (CSA), perme-ability and sapwood area × permeperme-ability are given in Table 3.
The relationships between leaf area and sapwood area at BH and BLC were always linear. For trees at the Aberfoyle site, the regressions of leaf area on branch CSA and BH and BLC sapwood area × permeability gave significant positive inter-cepts.
Covariance analysis showed a significant difference be-tween sites in the slope of the relationship bebe-tween leaf area and sapwood area both at BH (P < 0.01, Figure 2a) and at BLC (P < 0.01, Figure 2b). Also, a significant difference (P < 0.01) was found when branch CSA was regressed against leaf area (Figure 2c). When the straight lines were forced through the origin, the slopes for BH and branch base for trees at Aberfoyle were almost twice as large as those for trees at Thetford (Figure 3). Covariance analysis did not show a significant difference in the slopes between leaf area and sapwood area × permeability at BH and BLC (P > 0.05), whereas the intercepts were significantly different in both cases (P < 0.01, Figures 2d and 2e). Leaf-specific conductance values (LSC, sapwood area × permeability/leaf area) were significantly higher in trees at Thetford than in trees at Aberfoyle (P < 0.01), both at BH and BLC (Table 4).
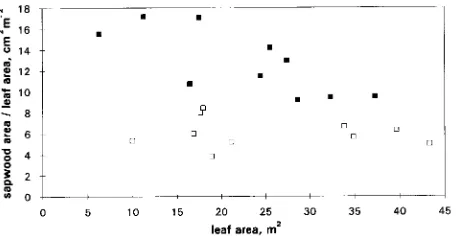
At Thetford, individual Huber values (sapwood area/leaf area ratios, i.e., 1/S) decreased with tree size, both at BH (Figure 4) and at BLC. At Aberfoyle, no differences among trees were apparent.
Permeability
Permeability at BLC was always greater than at BH. Variations in permeability were associated with sapwood basic density (Figure 5, P < 0.01, r2 = 0.46). Average BH and BLC perme-ability and sapwood basic density of the sample trees at Thet-ford did not differ significantly from those at Aberfoyle. Comparison of stand properties
We used Equation 4 to calculate Rp for the two stands during 2 days in summer; the average values were 0.700 × 10⁷ and 1.090 × 10⁷ MPa s m−1 for Thetford and Aberfoyle, respec-tively.
Table 5 summarizes the main hydraulic properties for the average tree and for the stand in terms of a ratio between Thetford and Aberfoyle values. For the tree of average leaf area, leaf area and permeability were unchanged, whereas sapwood basal area (and probably branch conducting tissue) doubled; this corresponded to a 50% reduction in average individual resistance, as calculated from Equation 5. Average stand resistance at Thetford was reduced to 64% of the value at Aberfoyle, a slightly higher ratio than for individual resis-tance.
Discussion
Tree properties
The trees at Thetford were much larger than those at Aberfoyle (Tables 1b and 1c), with a larger increment of stem volume per unit of leaf area. This faster growth rate was most likely a result of the higher temperatures (mean July temperature was 2.6 °C higher) and higher irradiances (number of sunshine hours per week was about 30% higher) at Thetford compared with Aber-foyle.
The close relationships between leaf mass or area and sap-wood area for Scots pine were similar to those found for many other coniferous and broad-leaved species (Grier and Waring 1974, Waring et al. 1977, Whitehead 1978, Robichaud and Methven 1992). Regressions of sapwood areas from below the leaf canopy gave a better fit than those based on breast height; for trees at Thetford, the regression was further improved when CSA was used. This might be the result of a slower response of stem growth to changes in needle and branch dynamics as has been found when controlled pruning is performed (Mar-golis et al. 1988, Långström and Hellqvist 1991).
Significant differences in S were found between sites. The slopes for trees at Thetford and Aberfoyle (Table 3) compared well with those reported elsewhere for Scots pine. For BH, the slope at Thetford (0.09) was similar to values (0.10 and 0.11) reported previously for similar stands in the same forest (Whitehead 1978). At Aberfoyle, the slope was 0.15, which is intermediate between that at Roseisle, northeastern Scotland (0.14) and that at Devilla, central Scotland (0.24, Whitehead 1978). When leaf area was plotted against the product of sapwood area and permeability, separate regression lines were necessary, because trees at Aberfoyle had larger leaf areas per unit of conductive capacity than trees at Thetford.
Table 2. Parameters of the normal distribution of leaf area with height for the two stands.
Parameter Thetford Aberfoyle
Crown depth (m) 6.8 5.7
Mean height of needle area distribution (m) 15.6 7.5
Midcrown height 14.9 7.3
Relative mean height (%)1 40.4 45.9
Standard deviation (m) 1.9 2.1
Relative standard deviation (%)2 27 37
Skewness 0.98 *3 0.02
Kurtosis 2.06 ns4 1.81 ns
1 Distance from top of canopy to mean canopy height/canopy depth × 100.
Table 3. Linear regression equations for the prediction of leaf dry mass (kg) and projected leaf area (m2) on the basis of BH and BLC sapwood area, sum of branch cross-sectional area (CSA), permeability and sapwood area × permeability (standard errors are given in parenthesis).1
Y X Position a b r2 SEE
Thetford
Leaf mass Sapwood area BH −0.38 (1.44) 0.02 (0.01) 0.69 1.35
BLC −0.19 (1.30) 0.07 (0.01) 0.81 1.06
CSA Branch −0.07 (0.68) 0.02 (0.00) 0.90 0.74
Permeability BH 0.08 (3.96) 4.04 × 10¹² (2.94) 0.19 ns 2.17 BLC −0.99 (2.29) 2.22 × 10¹² (0.76) 0.51* 1.69 Sapwood area × permeability BH 0.72 (1.15) 1.30 × 10¹⁴ (0.30) 0.71 1.31 BLC 1.32 (0.99) 1.29 × 10¹⁴ (0.28) 0.72 1.28
Leaf area Sapwood area BH −1.86 (6.11) 0.09 (0.02) 0.69 5.7
BLC −8.35 (5.41) 0.29 (0.05) 0.82 4.4
CSA Branch −0.31 (2.85) 0.09 (0.01) 0.90 3.1
Permeability BH 0.52 (16.85) 16.78 × 10¹² (12) 0.18 ns 9.3
BLC −3.91 (9.87) 9.20 × 10¹² (3.32) 0.49* 7.3 Sapwood area × permeability BH 2.92 (4.92) 5.48 × 10¹⁴ (1.28) 0.70 5.6 BLC 5.47 (4.28) 5.42 × 10¹⁴ (1.21) 0.71 5.5 Aberfoyle
Leaf mass Sapwood area BH 0.95 (1.04) 0.03 (0.01) 0.72 1.28
BLC 1.29 (0.78) 0.05 (0.01) 0.80 1.08
CSA Branch 1.62 (0.68)* 0.02 (0.00) 0.83 1.02
Permeability BH 2.02 (2.34) 2.06 × 10¹² (1.40) 0.21 ns 2.17 BLC −3.78 (1.84) 3.02 × 10¹² (0.60) 0.76 1.19 Sapwood area × permeability BH 2.67 (0.95)* 1.03 × 1014 (0.32) 0.58 1.59 BLC 2.35 (0.58)** 1.10 × 10¹⁴ (1.82) 0.82 1.03
Leaf area Sapwood area BH 2.43 (4.15) 0.15 (0.03) 0.82 5.1
BLC 4.14 (2.52) 0.26 (0.03) 0.92 3.5
CSA Branch 6.23 (2.46)** 0.12 (0.01) 0.91 3.7
Permeability BH 5.65 (10.84) 12.42 × 10¹² (6.5) 0.31 ns 10.0 BLC −19.96 (8.91) 15.05 × 10¹² (2.9) 0.77 5.8 Sapwood area × permeability BH 10.66 (3.70)* 5.76 × 1014 (1.22) 0.74 6.2 BLC 10.10 (2.20)** 5.75 × 10¹⁴ (0.68) 0.90 3.9
1 Equations are of the form Y = a + b X. Sapwood area measured in cm2. CSA = sum of branch cross-sectional areas measured in cm2; permeability
in m2; sapwood area × permeability in m4; BH = breast height (1.3 m); BLC = base of live crown; R2 = coefficient of determination; SEE = standard error of the estimate. Intercepts not significantly different from zero (P > 0.05), unless indicated. Slopes always significant (P < 0.01), unless indicated; ns = not significant; * = P < 0.05; ** = P < 0.01.
We hypothesized that a constant water potential gradient within tree stems at sites with different average D (and hence transpiration rates) can be maintained through proportional changes in the leaf area/sapwood area ratio. Alternatively,
changes in gradients of stem water potential could occur. To test our hypothesis, we used Equation 1, substituting for the appropriate values of leaf area, sapwood area and permeability of the two sites and solving for ∆Ψ/l, the gradient in the stem water potential; stomatal conductance at different D was esti-mated using the relationship between the canopy-averaged stomatal conductance and D given by Whitehead et al. (1984b) for the Roseisle forest, which has an intermediate climate between Aberfoyle and Thetford. Checks made with data available for our stands showed that such a relationship ade-quately described average canopy behavior at both sites.
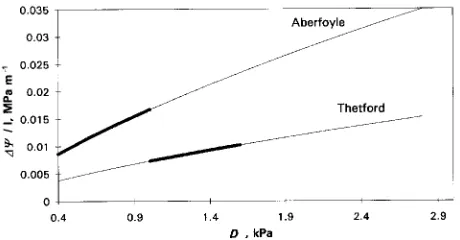
Trees at Thetford had a hydraulic advantage over trees at Aberfoyle under the same climatic conditions, especially at high D, i.e., at high transpiration rates (Figure 6). During summer 1992, D ranged between 1.0--1.5 kPa and 0.5--1.0 kPa at Thetford and Aberfoyle, respectively (G.E. Jackson, J. Irvine and J. Grace, personal communication, British Meteorological Office). As a consequence, trees at Thetford could develop a theoretical gradient between 0.007 and 0.010 MPa m−1 com-pared with a range between 0.009 and 0.017 MPa m−1 (thicker part of the straight lines) for trees at Aberfoyle. Values of water viscosity were calculated assuming an average water tempera-ture of 15 and 20 °C for Aberfoyle and Thetford, respectively. Different combinations of temperatures did not change the results.
Figure 3. Slope S of the leaf area/sapwood area ratio at BH, BLC and branch base for the two sites. Slopes refer to straight lines forced through the origin. At branch base, total cross-sectional area (CSA) was measured (heartwood within 10% of total CSA). Numbers in the figure refer to the ratio of Aberfoyle/Thetford slopes. Asterisks refer to the significance level of the differences between slopes (covariance analysis).
Table 4. Summary of the hydraulic parameters for the 10 sample trees (standard errors are given in parenthesis).1
Parameter Thetford Aberfoyle
Leaf area (m2) 22.7 (3.1) 25.4 (3.6)
BH
Sapwood area (cm2) 268.9 (27.7) 151.9 (21.5) Permeability (× 10−12 m2) 1.3 (0.2) 1.6 (0.1) S (m2 cm−2) 0.08 (0.01) 0.17 (0.01) LSC (× 10−3 kgs−1 m−1 MPa−1) 1.6 (0.1) 0.9 (0.1)
BLC
Sapwood area (cm2) 105.6 (9.4) 81.5 (13.2) Permeability (× 10−12 m2) 2.9 (0.2) 3.0 (0.2) S (m2 cm−2) 0.21 (0.02) 0.32 (0.02) LSC (× 10−3 kgs−1 m−1 MPa−1) 1.4 (0.1) 0.9 (0.1)
1 S = Leaf area/sapwood area ratio; LSC = leaf specific conductance
(sapwood area × permeability/leaf area).
Figure 4. Individual Huber values (sapwood area/leaf area ratio, cm2 m−2) at BH for the two sites, Thetford (j) and Aberfoyle (h).
Figure 5. Relation between natural logarithm of k (permeability, m2) and logarithm of WD (sapwood basic density, kg m−3) in Scots pine; ln ( k × 1013) = 19.69 − 2.77 ln (WD), P < 0.01, R2 = 0.46.
Table 5. Ratio between Thetford and Aberfoyle values for the main hydraulic properties.
Properties Thetford/Aberfoyle
ratio
Average tree
Leaf area (m2) 1.04
BH sapwood area (cm2) 2.18 BH permeability (× 10−12 m2 ) 0.93 Individual resistance (MPa s m−3) 0.52 Theoretical stem ∆Ψ/l (MPa m−1) 0.69
Stand
Thus, changes in the leaf area/sapwood area ratio effectively acted to reduce the gradient in stem water potential of trees at Thetford. Although the trees were the same age at the two sites, there were large differences in tree size between sites which might explain why the range in ∆Ψ/l at Thetford was, on average, slightly lower than at Aberfoyle.
Measured values of stem water potential gradients for Scots pine at Thetford based on a tree-cutting technique and water potential measurements, i.e., including the gravitational com-ponent, are in the range 0.02 to 0.06 MPa m−1 (Roberts 1977). These values were about 1--3 times higher than those found in our study. This difference may be attributed to the use of saturated sapwood permeability and median, rather than maxi-mum, transpiration rates for our estimates of water potential gradients. Stem sapwood permeability is probably reduced in summer as a result of embolism, as shown by measurements of seasonal variations in sapwood relative water content at our sites (G.E. Jackson, J. Irvine and J. Grace, personal communi-cation). Also, our values of stem permeability correspond to the below-crown portion of the stems; if the conductive capac-ity of stem internodes within the crown had been considered, lower permeability values would have been found (Pothier et al. 1989).
Scaling up to the stand
The main resistance to water transport in Scots pine is in the soil--root compartment (Roberts 1977), but both the stem and the branches can contribute a significant resistance. Predawn water potential (Ψpd) averaged −0.5 and −0.6 MPa at Aberfoyle and Thetford, respectively, with midday values typically around −1.4 to −1.6 MPa (G.E. Jackson, J. Irvine and J. Grace, personal communication). Therefore, mean ∆Ψ between the root surface and the leaves was about 0.9--1.1 MPa at both sites. In the stems and branches, S was much smaller in trees at Thetford than in trees at Aberfoyle (Figure 3), and this may have contributed to the maintenance of the similar ∆Ψ and prevented the need for lower water potentials in needles at Thetford.
Also, the consistent reduction in the overall stand resistance to water flow from the soil to the atmosphere during two days in summer (Table 5) was probably determined by the develop-ment of a larger sapwood area in the stems and branches of trees at Thetford compared with trees at Aberfoyle.
It is not known how the leaf area/sapwood area ratio is maintained, i.e., whether xylem development controls leaf area development or vice versa. Growth regulators (e.g., auxins) in the leaves may control rates of cell division and maturation of xylem (Larson 1976, Aloni 1991), and for Scots pine, there is evidence that exogenous IAA promotes tracheid production in the stem (Little and Sundberg 1990, Little et al. 1990). How-ever, cambium activity, rather than IAA concentration, may determine patterns of tracheid production (Sundberg et al. 1993).
Both variations in stand density and fertility are known to influence S (Brix and Mitchell 1983, Long and Smith 1988). High stand density and low fertility may indirectly affect the amount of leaf area sustained by a unit of sapwood area by increasing sapwood basic density (Keane and Weetman 1987, Espinosa-Bancalari et al. 1987) and, consequently, by reducing permeability (see Figure 5). It is unlikely that our results were influenced by these variables. Although, at Thetford, vertical leaf area distribution was significantly skewed (Figure 1) and suppressed trees had higher Huber values (Figure 4), neither sapwood basic density nor permeability differed between sites. Moreover, needle elemental analysis showed no difference or only small differences in nutrient concentration between the two study areas (Table 1d), percent nitrogen concentration being slightly higher in needles at Aberfoyle than at Thetford, perhaps because of a difference in needle weight per unit leaf area (Smith et al. 1981). Overall, our values of elemental concentrations were within the normal range reported for Scots pine needles (Ovington 1959, Malkonen 1974, Lim and Cousens 1986, Helmisaari 1990).
The present investigation is the first field test of Whitehead and Jarvis’s hypothesis with respect to the influence of climate on the leaf area/sapwood area ratio. Our results suggest that trees respond to increased transpiration rates determined by increases in D through a reduction in the leaf area/sapwood area ratio. The presence of a structural change in response to increased evaporative demand has important consequences for our understanding of the effects of water deficit on tree and stand water relations.
Acknowledgments
We thank Gail Jackson and James Irvine for their help in collecting the field data and for access to unpublished data. We also acknowledge Paul Jarvis for useful comments on earlier versions of the manuscript and Frank Berninger (University of Helsinki) for stimulating discus-sions. The first author was partly supported by a joint British Council--MURST agreement (Project: Ecological significance of cavitation). Part of the project was funded by a grant from the Natural Environ-ment Research Council.
References
Albrektson, A. 1984. Sapwood basal area and needle mass of Scots pine (Pinus sylvestris L.) trees in Central Sweden. Forestry 57:35--43.
Allen, S.E. 1974. Chemical analysis of ecological material. Blackwell Scientific Publ., Oxford, 565 p.
Aloni, R. 1991. Wood formation in deciduous hardwood trees. In Physiology of Trees. Ed. AS. Raghavendra. John Wiley and Sons, New York, pp 175--197.
Aussenac, G. and A. Granier. 1988. Effects of thinning on water stress and growth in Douglas-fir. Can. J. For. Res. 18:100--105. Beadle, C.L., H. Talbot and P.G. Jarvis. 1982. Canopy structure and
leaf area index in a mature Scots pine forest. Forestry 55:2--19. Beadle, C.L., R.E. Neilson, H. Talbot and P.G. Jarvis. 1985a. Stomatal
conductance and photosynthesis in a mature Scots pine forest. I. Diurnal, seasonal and spatial variation in shoots. J. Appl. Ecol. 22:557--571.
Beadle, C.L., R.E. Neilson, H. Talbot and P.G. Jarvis. 1985b. Stomatal conductance and photosynthesis in a mature Scots pine forest. II. Dependence on environmental variables of single shoots. J. Appl. Ecol. 22:573--586.
Brix, H. and A.K. Mitchell. 1983. Thinning and nitrogen fertilization effects on sapwood development and relationships of foliage quan-tity to sapwood area and basal area in Douglas-fir. Can. J. For. Res. 13:384--389.
Cochran, W.G. 1977. Sampling techniques. 3rd Edn. John Wiley and Sons, New York, NY, 381 p.
Corbett, W.M. 1973. Breckland forest soils. The Soil Survey, Rotham-sted Experimental Station, Harpenden, Herts, pp 6--13.
Coyea, M.R. and H.A. Margolis. 1992. Factors affecting the relation-ship between sapwood area and leaf area of balsam fir. Can. J. For. Res. 22:1684--1693.
Edwards, W.R.N. and P.G. Jarvis. 1982. Relations between water content, potential and permeability in stems of conifers. Plant Cell Environ. 5:271--277.
Espinosa-Bancalari, M.A., D.A. Perry and J.D. Marshall. 1987. Leaf area--sapwood area relationships in adjacent young Douglas-fir stands with different growth rates. Can. J. For. Res. 17:174--180. Grace, J. 1992. Incorporating species attributes and environmental
heterogeneity into forest models. In Responses of Forest Ecosys-tems to Environmental Changes. Eds. A. Teller, P. Mathy and J.N.R. Jeffers. Elsevier Science Publ. Ltd., London, New York, pp 115--125.
Grier, C.C. and R.H. Waring. 1974. Conifer foliage mass related to sapwood area. For. Sci. 20:205--206.
Hamilton, G.J. 1975. Forest mensuration handbook. For. Comm. Lond. Booklet 39, 276 p.
Helmisaari, H.-S. 1990. Temporal variation in nutrient concentrations in Pinus sylvestris needles. Scand. J. For. Res. 5:177--193. Hinckley, T.M. and R. Ceulemans. 1989. Current focuses in woody
plant water relations and drought resistance. Ann. Sci. For. 46s:317--324.
Jarvis, P.G. 1975. Water transfer in plants. In Heat and Mass Transfer in the Plant Environment. Part 1. Eds. D.A. de Vries and N.G. Afgan. Scripta Book Co., Washington D.C., pp 369--394. Jarvis, P.G. 1981. Stomatal conductance, gaseous exchange and
tran-spiration. In Plants and Their Atmospheric Environment. Eds. J. Grace, E.D. Ford and P.G. Jarvis. Blackwell, Oxford, pp 175--204. Jarvis, P.G. and J.B. Stewart. 1979. Evaporation of water from planta-tion forest. In: The Ecology of Even-aged Plantaplanta-tions. Eds. E.D. Ford, D.C. Malcolm and J. Atteson. Inst. Terr. Ecol., Cambridge, pp 327--350.
Keane, M.G. and G.F. Weetman. 1987. Leaf area--sapwood cross-sec-tional area relationships in repressed stands of lodgepole pine. Can. J. For. Res. 17:205--209.
Kelliher, F.M., R. Leuning and E.-D. Schulze. 1993. Evaporation and canopy characteristics of coniferous forests and grasslands. Oe-cologia 95:153--163.
Kozlowski, T.T. 1983. Water deficits and plant growth. Vol. VII. Academic Press, New York, 251 p.
Kramer, P.J. 1983. Plant and soil water relationships. Academic Press, New York, 483 p.
Långström, B. and C. Hellqvist. 1991. Effects of different pruning regimes on growth and sapwood area of Scots pine. For. Ecol. Manage. 44:239--254.
Larson, P.R. 1976. The leaf--cambium relation and some prospects for genetic improvement. In Tree Physiology and Yield Improvement. Eds. M.G.R. Cannell and F.T. Last. Academic Press, London, pp 261--282.
Lim, M.T. and J.E. Cousens. 1986. The internal transfer of nutrients in a Scots pine stand. I. Biomass components, current growth and their nutrient content. Forestry 59:1--16.
Little, C.H.A. and B. Sundberg. 1990. Tracheid production in response to indole-3-acetic acid varies with internode age in Pinus sylvestris stems. Trees 5:101--106.
Little, C.H.A., B. Sundberg and A. Ericsson. 1990. Induction of acropetal 14C-photosynthate transport and radial growth by indole-3-acetic acid in Pinus sylvestris shoots. Tree Physiol. 6:177--189. Long, J.N. and F.W. Smith. 1988. Leaf area--sapwood area relations of
lodgepole pine as influenced by stand density and site index. Can. J. For. Res. 18:247--250.
Makela, A. 1986. Implications of the pipe model theory on dry matter partitioning and height growth in trees. J. Theor. Biol. 123:103--120.
Malkonen, E. 1974. Annual primary production and nutrient cycle in some Scots pine stands. Comm. Inst. For. Fenn. 84:1--87. Margolis, H.A., R.R. Gagnon, D. Pothier and M. Pineau. 1988. The
adjustment of growth, sapwood area, heartwood area and saturated sapwood permeability of balsam fir after different intensities of pruning. Can. J. For. Res. 18:723--727.
Monteith, J.L. and M.H. Unsworth. 1990. Principles of environmental physics. Edward Arnold, London, 291 p.
Ovington, J.D. 1959. Mineral content of plantations of Pinus sylvestris L.. Ann. Bot. 23:75--88.
Pothier, D. and H.A. Margolis. 1991. Analysis of growth and light interception of balsam fir and white birch saplings following pre-commercial thinning. Ann. Sci. For. 48:123--132.
Pothier, D., H.A. Margolis, J. Poliquin and R.H. Waring. 1989. Pat-terns of change of saturated sapwood permeability and sapwood conductance with stand development. Can. J. For. Res. 19:432--439. Roberts, J. 1977. The use of tree-cutting technique in the study of the water relations of mature Pinus sylvestris L. J. Exp. Bot. 28:751--767.
Robichaud, E. and I.R. Methven. 1992. The applicability of the pipe model theory for the prediction of foliage biomass in trees from natural, untreated black spruce stands. Can. J. For. Res. 22:1118--1123.
Sandford, A.P. and P.G. Jarvis. 1986. Stomatal responses to humidity in selected conifers. Tree Physiol. 2:89--103.
Schulze, E.-D. 1986. Whole-plant responses to drought. Aust. J. Plant Physiol. 13:127--141.
Shain, L. 1967. Resistance of sapwood in stems of loblolly pine to infection by Fomes annosus. Phytopathology 57:1034--1045. Siau, J.F. 1984. Transport processes in wood. Springer-Verlag, Berlin,
Smith, R.B., R.H. Waring and D.A. Perry. 1981. Interpreting foliar analysis from Douglas-fir as weight per unit leaf area. Can. J. For. Res. 11:593--598.
Snedecor, G.W. and W.G. Cochran. 1967. Statistical methods. The Iowa State University Press, Ames, Iowa, 593 p.
Stephens, G.R. 1969. Productivity of red pine. I. Foliage distribution in tree crowns and stand canopy. Agric. Meteorol. 6:275--282. Stewart, J.B. 1988. Modelling surface conductance of pine forest.
Agric. For. Meteorol. 43:19--35.
Sundberg, B., A. Ericsson, C.H.A. Little, T. Nasholm and R. Gref. 1993. The relationship between crown size and ring width in Pinus sylvestris L. stems: dependence on indole-3-acetic acid, carbohy-drates and nitrogen in the cambial region. Tree Physiol. 12:347--362.
Tan, C.S. and T.A. Black. 1976. Factors affecting the canopy resis-tance of a Douglas-fir forest. Boundary-layer Meteorol. 10:475--488.
Tyree, M.T. and F.W. Ewers. 1991. The hydraulic architecture of trees and other woody plants. New Phytol. 119:345--360.
Valentine, H.T. 1985. Tree growth models: derivation employing the pipe-model theory. J. Theor. Biol. 117:579--585.
Waring, R.H., H.L. Gholz, C.C. Grier and M.L. Plummer. 1977. Evaluating stem conducting tissue as an estimator of leaf area in four woody angiosperms. Can. J. Bot. 55:1474--1477.
Whitehead, D. 1978. The estimation of foliage area from sapwood basal area in Scots pine. Forestry 51:35--47.
Whitehead, D. and P.G. Jarvis. 1981. Coniferous forests and planta-tions. In Water Deficits and Plant Growth. Vol. VI. Ed. T.T. Ko-zlowski. Academic Press, New York, pp 49--152.
Whitehead, D., W.R.N. Edwards and P.G. Jarvis. 1984a. Conducting sapwood area, foliage area, and permeability in mature trees of Picea sitchensis and Pinus contorta. Can. J. For. Res. 14:940--947. Whitehead, D., P.G. Jarvis and R.H. Waring. 1984b. Stomatal conduc-tance, transpiration and resistance to water uptake in a Pinus sylvestris spacing experiment. Can. J. For. Res. 14:692--700. Zimmermann, M.H. 1983. Xylem structure and the ascent of sap.