e-Journal of English Language Teaching Society (ELTS) Vol. 3 No. 2 2015 – ISSN 2331-1841 Page 1
THE CORRELATION BETWEEN STUDENTS’ MASTERY
OF GRAMMAR AND WRITING ABILITY
OF THE TENTH GRADE
Adhiyatma B1, Jamiluddin2, Nadrun3
Abstract
The objective of this research was to find out the correlation between students’ mastery of grammar and writing ability of the tenth grade of SMA Negeri 1 Pasangkayu. This research used correlation research design. The research sample was X IPA 1 which consisted of 40 students which selected by using cluster sampling technique. Technique of data collection was questionnaires and tests. In analyzing the data, the researcher applied Pearson’s Product Moment Correlation Coefficient and Significance of Coefficient Correlation formula. The researcher used 0.05 significant level with 38 (40 – 2) degree of freedom (df), the researcher found that t-counted (6.748) was higher than t-table (2.712). The result of this research was categorized substantial. It means that there is a significant correlation between students’ mastery of grammar and writing ability of the tenth grade of SMA Negeri 1 Pasangkayu.
Keywords:Correlation; Mastery of Grammar; Writing Ability
INTRODUCTION
Language is one of the important things in our life. One of the languages which is
very important to be mastered is English. Mastering English helps us to communicate with
people from different cultures or countries. English has already been taught in our country
as foreign language. English is taught to the students in formal school from kindergarten up
to university. By using English, students can develop their competence in many fields.
The students have to learn three components (grammar, vocabulary and
pronunciation) and four skills (writing, speaking, listening and reading) of English. The
components and skills have a correlation to one another such as grammar and writing. There is assumption ―a good writing has to contain a good grammar‖. Based on the assumption for the people who want to write sentences, paragraphs, essays and stories, they have to master
grammar as requirement of good writing. Swan (1998:19) states, ―Grammar is the rule that
says how words changed to show different meaning, and they combine into sentences‖. It
1
Prodi Pendidikan Bahasa Inggris FKIP Universitas Tadulako - email: [email protected] 2
email: [email protected] 3
e-Journal of English Language Teaching Society (ELTS) Vol. 3 No. 2 2015 – ISSN 2331-1841 Page 2
means that grammar is the regulation of forming a different meaning of words which use to
construct a sentence in writing. Concerning to the previous statement Haussamen
(2003:xiii) states:
The term grammar refers to two kinds of knowledge about language. One is subconscious knowledge, the language ability that children develop at an early age without being taught. The other kind of knowledge is the conscious understanding of sentences and texts that can help students improve their reading and writing abilities by building on that subconscious knowledge.
The statement above clearly explains that the native learners can speak or write
automatically by using correct grammar without learning and the non native learners, they
have to learn how to construct correct grammar firstly before they speak or write.
Langan (1984:96) states, ―Writing is a skill like driving, typing, or even preparing a good meal. Like any skill can be learned‖. The statement shows that everybody can write a good writing, but she or he has to learn how to write correctly before starting to write. In
English writing, most students think that to write well is not easy because it is more
complex skill. When students want to write, sometimes they think what first should be
written and what kind of tenses should be used. Lyons and Heasley (1987:2) states:
It is very difficult to write like Shakespeare or D. H. Laurence in a language which
is not your own. But you are not aiming at getting literature: you simply need to able to
write clear, accurate English which has central idea and other related information and gets
the meaning across to your reading.
The statement above clearly explains that it is very difficult to write sentence,
paragraph, essay, and others because we are not the expert of the language. We need to
know how to write English clearly and accurately. The idea or message of our writing has to
able to be understood by readers.
Every student should realize that many ways can be used by them to train them
selves how to get a good writing such as using kind of text which related to their school
curriculum. Recount text is one kind of text which is taught at senior high school. Anderson (1997:48) defines, ―Recount is a piece of text retells past events which are usually told in order in which they happened‖. The statement explains that recount is one of ways which can be used by any person to re-explain in detail what she or he had already done in the past
time. Recount is used to relate experiences or retell events for the purpose of informing,
entertaining, or reflecting. In general the tense that is often used in recount is past tense
e-Journal of English Language Teaching Society (ELTS) Vol. 3 No. 2 2015 – ISSN 2331-1841 Page 3 ended at a particular time in the past‖. It is clear that we use simple past when we want to express action or activity which happens in the past.
Simple past tense as one of the materials of English lesson has been taught in the
tenth grade students of SMA Negeri 1 Pasangkayu, and then the school teachers have given
many books and applied appropriate approach, technique, or method to the students to
improve their ability in understanding a text. However, based on the preliminary study,
most students of SMA Negeri 1 Pasangkayu still have many difficulties in writing a text. It
can be seen by the mistakes in using tenses and organization which they made when they
write a text. The teacher showed test results in writing a text. For the students who could not
write well, their test results showed there were many mistakes and errors which have been
done by them but for the students who could write well, their test results showed that they
wrote the text in correct way and good arrangement.
Based on the explanation above the researcher conducted the research about the correlation between students’ mastery of grammar and writing ability of the tenth grade of SMA Negeri 1 Pasangkayu. The research question was formulated as follows ―Is there any
significant correlation between students’ mastery of grammar and writing ability of the tenth grade of SMA Negeri 1 Pasangkayu?‖. The objective of this research was to find out the correlation between students’ mastery of grammar and writing ability of the tenth grade of SMA Negeri 1 Pasangkayu.
METHODOLOGY
The researcher employed correlation research design. Best and Khan (2006:378) state, ―Correlation is the relationship between two or more paired variables or two or more sets of data‖. The research was analyzed by using product moment correlation. It is usually used to correlate two variables based on its correlation coefficient value. It is useful to
describe and to find out the significance of the correlation between those two variables,
variable X and variable Y.
mastery of grammar writing ability
X Y
e-Journal of English Language Teaching Society (ELTS) Vol. 3 No. 2 2015 – ISSN 2331-1841 Page 4
research, the researcher took the science classes as the population because the problem of
the research was found there. It could be seen in the following table:
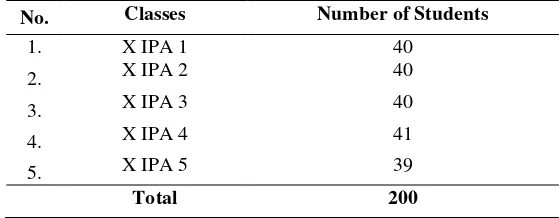
Table 1: Science Class Distribution
No. Classes Number of Students
1. X IPA 1 40 2. X IPA 2 40 3. X IPA 3 40 4. X IPA 4 41 5. X IPA 5 39
Total 200
Best (1981:8) states, ―A sample is a small of the Population that is selected for observation and analysis‖. Based on this statement, the researcher took science vocation which consisted of five parallel classes. Considering the large number of the students, the
researcher needed to select a sample. This could make easy to conduct the research. In
selecting the sample, the researcher used cluster sampling technique. There were some steps
in selecting the sample. First of all, the researcher prepared five pieces of paper and wrote
the name of each class. Then, they were fold and put into the glass, and then the researcher
shook the glass thoroughly. After that, the researcher dropped out one of them from the
glass. The first paper which fallen from the glass was the sample of this research. It was
class X IPA 1.
Best and Khan (2006:167) state, ―Variables are the conditions or characteristics that the experimenter manipulates, controls, or observes‖. In this research, there are two variables: students’ mastery of simple past tense as variable (X), and students’ ability in writing recount text as variable (Y).
In conducting his research at SMA Negeri 1 Pasangkayu, the researcher used two
instruments, they were questionnaire and test. The questionnaire consisted of 10 questions
given in the class room and collected it after 15 minutes. The tests were in subjective and
objective test which consisted of 20 questions. The subjective text was designed based on
their own words and ability in writing text. The students wrote a paragraph which tells
about recount text. It was given at the second meeting and collected it at the end of the
meeting. The objective test was in completion and multiple choice tests where the students
changed and chose the form of verb into simple past tense. It was given on the first meeting
after the students collected the result of their questionnaire and collected it at the end of the
e-Journal of English Language Teaching Society (ELTS) Vol. 3 No. 2 2015 – ISSN 2331-1841 Page 5
The result of questionnaire was analyzed by using the percentage formula by Hatch
and Farhady (1982:92) as follows:
The researcher computed the scores of the tests. The researcher used the formula by
Purwanto (1987:102) as follows:
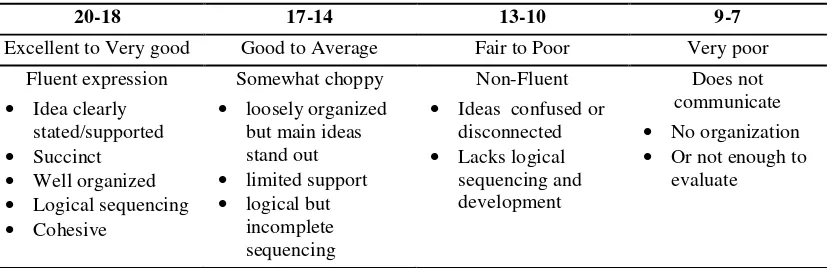
The researcher used analytical scoring system considered best evaluation of learning
some major elements in writing. In scoring subjective test, the researcher used the scoring
system which was suggested by Weigle (2002:116) as follows:
Table 2: The Scoring System of Organization in Writing
20-18 17-14 13-10 9-7
Excellent to Very good Good to Average Fair to Poor Very poor Fluent expression
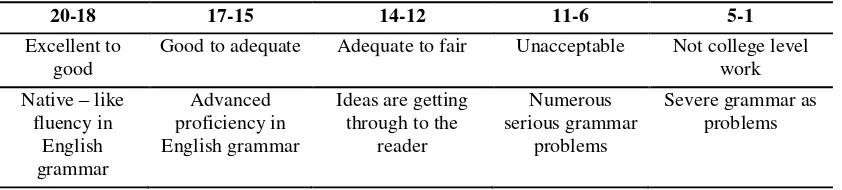
In scoring objective test, the researcher used the scoring in line with grammar level
e-Journal of English Language Teaching Society (ELTS) Vol. 3 No. 2 2015 – ISSN 2331-1841 Page 6 Table 3: The Scoring System of Grammar
20-18 17-15 14-12 11-6 5-1
Excellent to good
Good to adequate Adequate to fair Unacceptable Not college level work
Statistical analyses of two variables were set up in the table as follows:
Table 4: The Calculation of the Pearson r
No. Subject
The researcher measured the relationship between two variables. To find out that the
two variables had a correlation, the researcher used Pearson’s Product Moments coefficient
of correlation in Bungin (2005:207). The formula is:
r xy = ∑ −(∑ )(∑ )
∑X = the sum of scores in X distribution ∑Y = the sum of scores in Y distribution
∑XY = the sum of the product of paired X and Y scores ∑X2
= the sum of the squared scores in X distribution ∑Y2
= the sum of the squared scores in Y distribution N = the number of paired X and Y scores
To interpret the result of the coefficient value of the correlation of two paired
variables, the researcher used the crude criterion for evaluating the magnitude of a
correlation coefficient by Best and Khan (2006:388), as follows:
e-Journal of English Language Teaching Society (ELTS) Vol. 3 No. 2 2015 – ISSN 2331-1841 Page 7
In testing the significance, the researcher used significance of coefficient correlation
formula which was determined by Best and Khan (2006:421) as follows:
tr = � �−2
1−�2
Where:
r = the coefficient correlation N = the number of sample
Remark : tr becomes t-counted
The criterion of hypothesis is in the following. If the t-counted is higher than t-table,
it means that the hypothesis of the research is accepted. It means that there is a positive
correlation between the two variables, but if the t-counted is lower than t-table, it means that
hypothesis of the research is rejected. Definitely, there is a negative correlation.
FINDINGS
The researcher had given questionnaires which consisted of 10 (ten) items to the students. It was used by the researcher to get students’ opinions or comments about teaching and learning process which they had done in the class. The results of the questionnaire were
used by the researcher as supporting data to support the result of the test.
After the researcher gave the questionnaire, the researcher gave objective test to find out the students’ competence in using simple past tense. The objective test consisted of 10 completion tests and 10 multiple choice tests. All of the students could answer those
questions although several students answered incorrect.
Furthermore, the researcher gave subjective test to find out the students’ competence in writing recount text. In subjective test, the students chose one of five topics which were
provided or the students used their own topic to be written down.
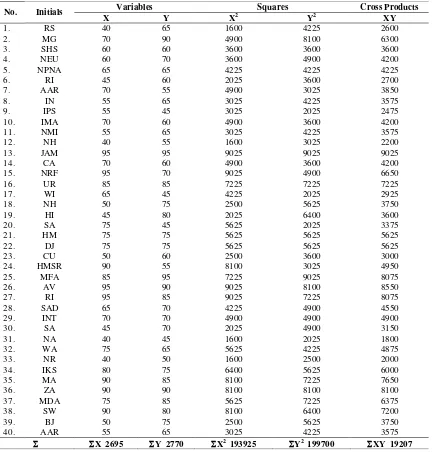
In order to find out the significant correlation between students’ mastery of simple past tense and the students’ ability in writing recount text, the researcher presented both of the results in the table5.
After gathering all of the data of objective and subjective test, the researcher applied Pearson’s Product Moment Correlation Coefficient formula to find out positive or negative correlation between students’ mastery of simple past tense as (X) and the students’ ability in writing recount text as (Y). The formula is as follow:
rxy = N∑xy− ∑x ∑y
e-Journal of English Language Teaching Society (ELTS) Vol. 3 No. 2 2015 – ISSN 2331-1841 Page 8
Table 5: The Score of Objective Test and Subjective Test
No. Initials Variables Squares Cross Products
e-Journal of English Language Teaching Society (ELTS) Vol. 3 No. 2 2015 – ISSN 2331-1841 Page 9
The result of the computation above shows that correlation coefficient between students’ mastery of simple past tense as (X) and the students’ ability in writing recount text as (Y) is 0.739. It means that there is positive correlation between students’ mastery of simple past tense and the students’ ability in writing recount text because Alternative Hypothesis (Ha):r = 0. When this result is consulted with the crude criterion for evaluating
the magnitude of a correlation coefficient (r), this result is categorized substantial.
Furthermore, the researcher determined the degree of freedom (df) as follows:
df = N – 2 = 40 – 2 df = 38
After obtaining 38 the degree of freedom (df) value, the researcher would find out
the significance of coefficient correlation by using the formula as follows:
�� = � n−2
1−r 2
= 40−2
0.739
1− 0.739 2
= 0.739 (6.164 )
0.675
= 4.555
0.675
�� = 6.748
Remark:tr become t-counted = 6.748
The value of the t-tableat significant level of 5% (0.05) and the degree of freedom
(df) = 38 is 2.712 while the value of the t-countedis 6.748. It means that the t-counted is
higher than the t-table. The researcher concludes that there is a significant correlation
between students’ mastery of simple past tense and the students’ ability in writing recount
text.
DISCUSSION
In this section, the researcher is going to explain the result of research finding which
has been analyzed by using statistical data analysis to answer the research problem and to
test the hypotheses. The researcher used questionnaire and test in gathering the data of the
research.
e-Journal of English Language Teaching Society (ELTS) Vol. 3 No. 2 2015 – ISSN 2331-1841 Page 10
found that there were 10 % of the students who got excellent, 15% of the students who got
very good, 15% of the students who got good, 20% of the students who got fair, 15% of the
students who got poor, and then 25% of the students who got very poor. Therefore, the
result of the objective test is classified very poor while in the subjective test, the researcher
found that there were 5 % of the students who got excellent, 17.5% of the students who got
very good, 17.5% of the students who got good, 5% of the students who got fair, 20% of the
students who got poor, and then 12.5% of the students who got very poor. Therefore, the
result of the subjective test is classified fair. Thomson and Ward (2009:19) state, ―Don’t annoy me with your moans of exasperation or your cries that you don’t understand grammar, you never did understand grammar, you flunked the whole semester in
Sophomore English, Writing is fun but grammar sucks the big one‖. The statement shows
that we cannot write anything without understanding the grammar because grammar is the
first requirement in writing.
Furthermore, the result of the questionnaire is used as supporting data to support the
result of the tests. The researcher concludes that the result of the questionnaire is very
useful to support the data of the test because most of the students said that learning simple
past tense would help them to write down a recount text.
After the researcher gathered both of objective test and subjective test results, the
researcher carried on to find out the significant of coefficient correlation between the
variable X and variable Y. By using the formula of significant of coefficient correlation,
the researcher found that the t-counted was 6.748 which would become t-counted. The researcher used 5% (0.05) significant level in critical value of Student’s Distribution (t) with 38 degree of freedom to obtain t-table.Then the value of the t-table is 2.712 while the
value of t-counted is 6.748. It means that the t-counted is higher than the t-table. The researcher concludes that there is a significant correlation between students’ mastery of simple past tense and the students’ ability in writing recount text. It is supported by Williams (2003:173) who states, ―Teachers, parents, administrators, politicians—all are convinced that students must know grammar to improve their writing, yet few have
examined the underlying assumption or have reflected on their own experiences.‖ The
statement explains that the students who want to improve their writing ability they have to
master grammar as the absolute requirement of writing.
e-Journal of English Language Teaching Society (ELTS) Vol. 3 No. 2 2015 – ISSN 2331-1841 Page 11 between student’s mastery of simple past tense and the students’ ability in writing recount text was 0.739. It means there is a positive correlation between variable X and variable Y.
When the result of correlation coefficient is consulted with the crude criterion for evaluating
the magnitude of a correlation coefficient (r), this result is categorized substantial. Best and Khan (2006:379) state, ―A perfect positive correlation is +1.00. A perfect negative correlation is -1.00. A complete lack of relationship is zero (0)‖. It means that the result of a
correlation research can be positive or negative depending on the result of correlation
coefficient.
CONCLUSION AND SUGGESTIONS
Concerning on the result of the research, the researcher concludes that there is a
correlation between students’ mastery of grammar and writing ability of the tenth grade of SMA Negeri 1 Pasangkayu. Then the correlation between students’ mastery of grammar and writing ability of the tenth grade of SMA Negeri 1 Pasangkayu is positive. It is proved
that the result of correlation coefficient between variable (X) and variable (Y) is 0.739 and
Alternative Hypothesis (Ha):r = 0. After consulting the result of correlation coefficient with
the crude criterion for evaluating the magnitude of a correlation coefficient (r), this result is
categorized substantial. Furthermore, the correlation between students’ mastery of grammar
and writing ability of the tenth grade of SMA Negeri 1 Pasangkayu is significant. It is
proved that the result of t-countedis 6.748 while the value of r-table at significant level of
5% (0.05) with 38 degree of freedom (df) is 2.712. It means that t-counted is higher than t
-table.
Concerning on the research finding, the researcher suggests the students, they must
study harder how to use grammar in order to be able to improve their writing ability. Even
though, most of them have gotten good score in their test result. For the teachers, they
should apply various strategies and techniques in teaching grammar and writing. They also
should motivate, stimulate, and give more chances to the students in teaching learning
process in order to make the students get significant improvement in mastering grammar
and writing.
REFERENCES
Anderson, M. (1997). Text Type in English2. South Yarra: Macmillan Education.
e-Journal of English Language Teaching Society (ELTS) Vol. 3 No. 2 2015 – ISSN 2331-1841 Page 12
Best, J. W. (1981). Research in Education: Fourth Edition. New Jersey: Prentice Hall, Inc.
Best, J. W & Khan, J. V. (2006). Research in Education: Tenth Edition. New York: Pearson Education Inc.
Bungin, B. (2005). Metodology Penelitian Kuantittatif. Jakarta: Kencana.
Brown, H. D. (2004). Language Assessment, San Fransisco: Longman.
Hatch & Farhady. (1982). Research Design and Statistic for Applied Linguistics. Massachhusetts: Newbury House Publisher.
Haussamen, B. (2003). Grammar Alive!: A Guide for Teachers. New York: The National Council of Teachers of English.
Langan, J. (1984). College Writing Skills. New York: Mc-Graw Hill Book Company.
Lyons, L. H. & Heasley, B. (1987). Study Writing a Course in Writing English for
Academic and Profesional Purpose. New York: Cambridge University Press.
Purwanto, M. N. (1987). Prinsip-Prinsip dan Teknik Evaluasi Pengajaran. Bandung: Remaja Rosdakarya.
Swan, M. (1998). Practical English Usage. London:Oxford University Press.
Thomson. T. & Ward. G. (2009). Tools Not Rules: Teaching Grammar in Writing
Classroom. New York: Eloquent Books.
Weigle, S. C. (2002). Assessing Writing. New York: Cambridge University Press.