Proceedings of The Bali 2010 International Geosciences Conference and Exposition, Bali, Indonesia, 19-22 July 2010
Variations of b-values in the Indian Ocean – Australian Plate Subduction in
South Java Sea
*Ruben Damanik (1), Andriansyah (2), Hengki Eko Putra (3), M.T Zen (4)
(1,2,3)
Staff of Research and Development, PT. Asuransi Maipark Indonesia ,(4)(Em) Proffessor of the Geophysical Engineering School, ITB; Head of Research and Development Department, PT. Asuransi Maipark Indonesia.
ABSTRACT
The variations of b-values in the Gutenberg – Richter relation were examined for tectonic earthquakes in the Indian Ocean, South of Java. Earthquake data for the Indian Ocean – Eurasia plate subduction from the NEIC, Harvard and Engdahl catalogs for a period from 1964 to 2009 were used for analysis. Spatial variations of b-values were calculated from circular areas containing 50 events, with 0.20 x 0.20 grids.
Based on “large earthquake occurrences in high stress” hypothesis, i.e. low b-values areas, we defined a zone along the subduction trench from 109.50 E to 112.00 E as a potential area for large earthquake to happen as represented by very low b-value area. This has become a “seismic gap”. This “seismic gap” is a potential threat for the surrounding regions, such as south coast Central and East Java Provinces. Research and government institutions should pay special attention to this region. Disaster management institution should take necessary steps, towards a real effective mitigation program.
KEY WORDS: b-value, Indian Ocean – Eurasia Plate Subduction, earthquake.
INTRODUCTION
Earthquake and tsunami in Aceh on December 2004 has widely opened up discourse on the study of natural disasters in Indonesia, earthquakes in particular. Lots of seismological papers tell us about the probability and prediction of an earthquake that will happen, but the phenomenon still remains a problem and is more often wrong than right.
Research on the b-value as a likely sign of a major earthquake has been done by several researchers before us; one of them is "The Potential of b-value Variations as Earthquake precursors for Small and Large Events" (Nuannin, 2006), which simulates the b-value before the occurrence of two large earthquakes in Aceh and Nias in 2004 to 2005.
In this paper, our study focused on the b-value in the south coast of Java region where there is a history of large earthquakes occurred. The historical earthquakes catalogue from the Newcomb & McCan (1987) also showed that the tsunami waves followed these large events. In a range of last two decades, there have been three events of earthquake and tsunami in the region of the South Coast of Java; Banyuwangi (1994), Pangandaran (2007) and Tasikmalaya (2009). As a step to look for other potential spots, we calculated the b-value to delineate the possible areas for large earthquakes in the future.
TECTONIC SETTING AND HISTORICAL SEISMICITY
The Tectonics of Java were dominated by northward subduction by the Indian Ocean-Australian Oceanic plate beneath the relatively quiet Eurasian continental plate. Movement of the Indian Ocean-Australian Oceanic plate is around 9 cm / year with a direction close to perpendicular towards the southern part of the Java Trench. Beneath Java Island, Indian-Australian Plate laid with a depth ranging from 100-200 km below the southern part and about 600 km on the northern part of Java. The consequences of this phenomenon manifest itself in the high number of seismicity and the existence of more than 20 active volcanoes in Java Island.
Our study on the convergent plate border beneath Java showed that this region has an average subduction angle between 30o-80o. The Age of the seafloor beneath the Java would be older than the Cretaceous (> 65 million years ago / Ma) (Hamilton, 1979). An old age plate, or in other word high density plate, causing the subduction angle more steep. This type of subduction represents a classic type of frontal plate subduction (Katili, 1975; Hamilton, 1979, Karig et al., 1980).
Proceedings of The Bali 2010 International Geosciences Conference and Exposition, Bali, Indonesia, 19-22 July 2010 occurrences in the area is very rare even though in
other regions (high b-value) have been hit by large earthquakes recently: Banyuwangi Earthquakes (1994), Pangandaran Earthquake (2007) and Tasikmalaya Earthquake (2009).
Historical earthquake record on the paper of Newcomb and McCan (1987) listed that the central part of south coast of Java have been hit by earthquake and tsunami on 1840, 1859, 1867, 1875 and 1921.
Figure 1. Historical earthquake record in Java Island occurred between 1800’s to early 1900’s. The fact that our interest area, marked with low b-values, did experience significant earthquake and tsunami wave. (courtesy of Newcomb & McCan, 1987).
b-VALUE VARIATION
The Frequency and magnitude equation (Richter and Gutenberg, 1944) are very commonly used in the modeling of earthquake hazard, mostly related to the earthquake precursors and probabilistic seismic hazard Assessments. This equation is defined as the number of earthquakes which occurred in an area as a function of magnitude M earthquake in that area:
bM a
N = −
log (1)
where N is the cumulative number of earthquakes with magnitudes equal to or greater than M. Variables a and b are constants with value varies in space and time. The a-parameter indicates the nature of seismicity of the study area, the greater value of a parameter the higher seismicity parameter. b parameter indicates the tectonic character of the region and assumed to depend on the accumulated stress on tectonic area (Nuannin, 2006). Low value of this parameter is likely
interpreted that the stress accumulated in the region. A recent study revealed that b-value was also associated with depth (Weimar and Benoit, 1996, Mori and Abercrombie, 1997; Wyss et all., 1997.2001). b-value can be calculated by the equations "least squares linear regression” or with the equation of maximum likelihood (Aki, 1965; Utsu, 1965; Bender, 1983; Nuannin, 2006).
e M
M
b 1 log
min − =
(2)
Where M indicates that the average magnitude and
min
M
is the minimum magnitude of the localcatalog data that being investigated. We use the catalog of earthquakes from the year 1964 - 2009 to be applied in the equation along south of Java island, from 1060 to 115.50 longitude and -70 to -11.50 latitude. An earthquake catalogue has been
declustered and resulting 1988 independent
earthquake events with magnitude above 3. B value calculations accomplished using the device ZMAP (Weimer, 2001).
Figure 2. Cumulative number of earthquake and Frequency-Magnitude Distribution (FMD) from 1964 - 2009 earthquake catalogue. The red thin line represented Gutenberg-Ritcher equation, log N = a-bM. From that graphic solution we’ve got Mc=4.8, b-value = 1.06 + 0.03, a-value = 8.
Proceedings of The Bali 2010 International Geosciences Conference and Exposition, Bali, Indonesia, 19-22 July 2010 To delineate the spatial variations of b-value, we
divided the study area into grids, and b-value was calculated for each grid for constant radius and number of events. In this study, the b-value is determined from the area with a radius of 220 km or
a minimum of 80 earthquakes with 0.20x0.20
processing grid.
Figure 3. Spatial variation of b-values on south coast of Java island region, we classified this region to two main sub-regions; high and low b-value sub region which are clearly showed by different contour color.
From the b-value distribution map resulted, we find the clustering of high b-value in the western area (106oE - 108oE) and eastern (111oE - 114oE). Both areas have variations of b-value ranges from 1.2 to 1.7. Both these areas have a high level of seismicity, and have experienced large earthquake and tsunami: Pangandaran (2006) and Banyuwangi (1994).
Sandwiched between those two high b-value clusters, we clearly identified a seismicity gap zone (seismic gaps) from 109oE - 110oE. Indication of a seismic gap zone showed by anomalies which is seen from the declining values of the b-value compared with the surrounding areas.
Then the authors overlaid the map with the earthquake epicenters. It told us that the frequency of earthquake occurrences in this anomalous area was very low. This fact is contradictory since this region is a subduction area, seismic-active area, with very big chance for occurrence of earthquakes. From the last two paragraphs, we are very confident
to conclude that a seismic gap has been identified
between 109oE - 110oE. The fact that this area have been hit by earthquake and tsunami on 1867,
remind us to be cautious due to the high probability of earthquake occurrences in the near future.
TEMPORAL VARIATION OF b-VALUE
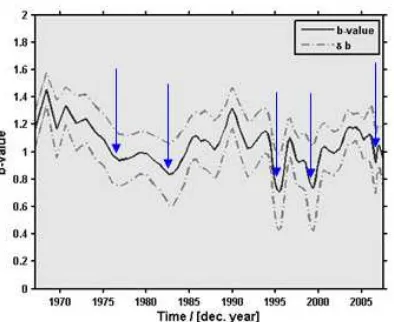
We analyze temporal variation of b-value in the short, medium, or long term for earthquake data on south coast of Java. Figure 4 shows the b-value in the black thick line, while the dashed line is the standard deviation. Blue arrows indicates large earthquakes with magnitude above 6,5. The most “eye catching” fact is that large earthquakes appear preceded by decreasing of b-value.
Our study was in line with the study by Molchan et al. (1999) on variations of b-value versus time. Using regional and global catalogue as the main data, Molchan et al. (1999) found that the b-value for foreshock will decrease to 50%.
Figure 4. b-value temporal variation in south coast of Java region from 1964 to 2008 as thick black line. Blue arrows indicates large earthquakes (magnitude > 6,5). While dashed line is the standard deviation.
CONCLUSION
The concept of value-b variation has been applied properly to simulate the b-value in the south coast of Java. The b-value variation in this region is calculated based on Maipark’s catalogue from 1964 until 2009 with a range of magnitudes from 1.3 to 7.7. Delineated zone from b-value distribution map showed us a seismic gap region (109oE - 110oE) with a potential for the occurrence of earthquakes in the near future. According to this theory, an area which does not show the activity of seismicity in a particular period will have a very large stress formation, which should be released as earthquakes.
Proceedings of The Bali 2010 International Geosciences Conference and Exposition, Bali, Indonesia, 19-22 July 2010
and East Java. Research and government
institutions should pay special attention to this region. The government’s disaster management institution should take necessary steps, towards a real effective mitigation program.
REFERENCES
Aki, K. (1965), Maximum lilkelihood estimate of b in the formula logN=a-bM and its confidence limits, Bull. Earthq. Res. Inst., 43, 237-239.
Bender, B. (1983), Maximum likelihood estimation of b values for magnitude grouped data, Bull. Seismol. Soc. Am., 73(3), 831-851.
Gutenberg, B., and C. Richter (1944), Frequency of earthquakes in California, Bull. Seismol. Soc. Am., 34, 185-188.
Hamilton, W., Tectonics of the Indonesia region, U.S Geological Survey, Prof. Pap. 1078,345 pp., 1979.
Kanamori, H. (1981), The nature of seismic patterns before large earthquakes. In Earthquake Prediction: An International Review (eds. Simpson, D.W., and Richards, P.G.) (Maurice Ewing Series, vol.4, AGU, Washington D.C., 1-19.
Karig. D E,. M. B. Lawrence, G. F. Moore, and J. R. Curray, Structural framework of the fore-arc basin, NW Sumatra, J. Geol. Soc. Lodon, 137, 1-15, 1980.
Katili, J. A., Sumatra, in Mesozoic-Cenozoic Orogenic Belts, Data for Orogenic Studies, Specs, Publ, 4, edited A. M. Spencer, pp 317-331
Molchan, G.M., T.L. Kronrod, and A.K Nekrasova (1999), Immediate foreshocks: time variation of the b-value, Phys. Earth Planet. Inter., 111, 229-240.
Mori, J., and R.E. Abercrombie (1997), Depth dependence of earthquake frequencymagnitude distributions in California: Implication for the rupture initiation, J. Geophys. Res., 102, 15,081-15,090.
Newcomb & McCan (1987), Seismic History and Seismotectonics of the Sunda Arc. In Special Edition of “Jurnal Geofisika”. Himpunan Ahli Geofisika Indonesia.
Nuannin, P. (2006), The Potential of b-value
Variations as Earthquake Precursors for Small and Large Events. Digital Comprehensive Summaries of Uppsala Dissertations from the Faculty of Science and Technology.
Ustu, T. (1965), A method in determining the value of b in a formula logn =a-bM showing the magnitude frequency for earthquakes. Geophys. Bull. Hokkaido Univ., 13, 99-103.
Wiemer, S., and J. Benoit (1996), Mapping the b-value anomaly at 100 km depth in the Alaska and New Zealand subduction zones, Geophys. Res. Lett., 23, 1557- 1560.
Wiemer, S. (2001), A software package to analyze seismicity: ZMAP, Seismol. Res. Lett., 72, 373-382.
Wyss, M., (1973), Towards a physical
understanding of earthquake frequency distribution. Geophys. J. R. astron. Soc., 31, 341– 359.
Wyss, M., K. Shimazaki, and S. Wiemer (1997), Mapping active magma chambers by b-value beneath the off-Ito volcano, Japan, J. Geophys. Res., 102, 20413- 20422.
Wyss, M., (1973), Towards a physical