D
I
S
C
U
S
S
I
O
N
P
A
P
E
R
S
E
R
I
E
S
Forschungsinstitut zur Zukunft der Arbeit Institute for the Study of Labor
Assimilation in Multilingual Cities
IZA DP No. 6243
Assimilation in Multilingual Cities
Javier Ortega
City University London, CEP (LSE), CReAM, FEDEA and IZA
Gregory Verdugo
Banque de Franceand IZA
Discussion Paper No. 6243
December 2011
IZA
P.O. Box 7240 53072 Bonn
Germany
Phone: +49-228-3894-0 Fax: +49-228-3894-180
E-mail: [email protected]
Anyopinions expressed here are those of the author(s) and not those of IZA. Research published in this series may include views on policy, but the institute itself takes no institutional policy positions.
The Institute for the Study of Labor (IZA) in Bonn is a local and virtual international research center and a place of communication between science, politics and business. IZA is an independent nonprofit organization supported by Deutsche Post Foundation. The center is associated with the University of Bonn and offers a stimulating research environment through its international network, workshops and conferences, data service, project support, research visits and doctoral program. IZA engages in (i) original and internationally competitive research in all fields of labor economics, (ii) development of policy concepts, and (iii) dissemination of research results and concepts to the interested public.
IZA Discussion Paper No. 6243 December 2011
ABSTRACT
Assimilation in Multilingual Cities
*Using the Public Use Microdata Files of the 2001 and 2006 Canadian Censuses, we study the determinants of the assimilation of language minorities into the city majority language. We show that official minority members (i.e. francophones in English-speaking cities and anglophones in French-speaking cities) assimilate less than the “allophones” (the individuals with a mother tongue other than English or French), and that immigrants generally assimilate less than natives. In addition, the language composition of cities is shown to be an important determinant of assimilation both for allophones and for official minorities. Finally, we show that assimilation into French in French-majority cities is lower than assimilation into English in English-majority cities even when controlling for the language composition of the cities and including a rich set of language dummies.
JEL Classification: F22, J15
Keywords: immigration, assimilation, language policies, minorities
Corresponding author:
Javier Ortega
Department of Economics City University London Northampton Square London EC1V 0HB United Kingdom
E-mail: [email protected]
*
1
Introduction
Officially bilingual countries are often characterised by the existence of heated debates on the
role of the existing languages. This may be, as stressed by sociolinguists, because
bilingual-ism is seldom purely symmetric (see e.g. Fishman, 1967) or because it is generally unstable
in the sense that, over generations, populations shift from the weak to the dominant language
(Paulston, 2003).1
In addition, in many cases, the populations speaking the minority language are
geograph-ically concentrated, and actually constitute a majority in certain locations. Then, a sensitive
issue for minority language speakers in those locations is whether majority members and
indi-viduals with other mother tongues end up speaking the minority language. This is for instance
one of the reasons for which officially multilingual countries such as Belgium or Switzerland
have chosen to determine the language of instruction in schools according to a "territoriality
principle" by which each region has only schools in the majority language of that region (see
McRae, 1983, and McRae, 1986).
While there exists a theoretical literature studying the incentives for the members of each
language group to learn the other language (see in particular John and Yi, 2001, and Church
and King, 1993), the existing empirical literature on assimilation in officially bilingual
coun-tries concentrates only on the assimilation of a specific group (the immigrants)2and treats
sym-metrically the assimilation into the official languages in the majority-inhabited and
minority-inhabited regions. This is the case in particular in Chiswick and Miller (1994) and Chiswick
and Miller (2001), which study the determinants for the knowledge of English and/or French
by immigrants living either in English Canada or in Quebec.
This paper contributes to the literature by explicitly studying the determinants of the
assim-ilation of all language minority members into the city-majority language, and by comparing
this assimilation process depending on whether the city-majority language is the majority or
minority language at the national level.
1“The major point about bilingualism (...) is that maintained group bilingualism is unusual. The norm for
groups in prolonged contact with a nation-state is for subordinate group to shift to the language of the dominant group.” (Paulston, 2003, p. 401)
2One exception in a different context is Lang and Siniver (2009) which studies the incentives for immigrants
For this type of analysis, the case of Canada is particularly interesting for several reasons.
First, the majority language and the size of the language majority greatly vary across Canadian
provinces and cities, and, in contrast with other multilingual countries as Belgium and Spain,
the Canadian Census includes questions on the mother tongue of individuals and their
knowl-edge of the two official languages (English and French). Second, English-French bilingualism
is likely to be asymmetric, as anglophones account for a much larger share (59%) of the
pop-ulation than francophones (22.5%)3 and English is currently the international lingua franca.
At the same time, the extent of this asymmetry is unclear, as French remains an international
language, both languages have been given co-official status since the 1969 Official Language
Act, and the province of Quebec has implemented a very active policy of promotion of French.4
Finally, immigration is a central phenomenon as non native anglophone or francophone
immi-grants accounted for nearly 20% of the population in 2001.
Using the Public Use Microdata Files (PUMF) of the 2001 and 2006 Canadian Censuses, we
regress the knowledge of the city-majority language by minority members in the city against
the characteristics of individuals and the language composition of the city. An individual is
defined as being a city language-minority member if he/she does not have the city majority
language as his/her mother tongue. Our sample of individuals thus includes the "official
(lan-guage) minorities" i.e. the francophones in English-majority cities and the anglophones in
French-majority cities, and the "allophones", i.e. the individuals with a mother tongue other
than English or French. It is important to note that mother tongue and immigrant status are
not perfectly correlated: in our sample, 6.8% of the mother tongue francophones and 17.6% of
the mother tongue anglophones are actually immigrants. Similarly, 17% of the allophones and
16.8% of the allophones with a non native American mother tongue are not immigrants.
3These data are from the 2006 Census 100% tabulations, www12.statcan.ca
4The legal history of Canada contains examples of legislation aimed at favouring assimilation of immigrants
As far as the individual characteristics are concerned, assimilation into the city-majority
language is shown to be higher for individuals with a diploma, for male, and for employed
in-dividuals. Among allophone immigrants, as in Chiswick and Miller (1994) and Chiswick and
Miller (2001), assimilation is increasing in the number of years in Canada, and decreasing in
the age at migration. In addition, while age at immigration remains a negative determinant of
assimilation for official minority immigrants, the number of years in Canada is not correlated
with knowledge of the city-majority language for this group of individuals.
A robust result in our regressions is that official minority members assimilate less into
the city-majority language than allophones. This result holds both for English- and
French-majority cities, and even when the size of the different language groups is taken into account.
Intuitively, the lower assimilation of official minorities could be related to institutions
stem-ming from Canada’s official bilingualism, such as for instance the right for Canadian citizens
whose mother tongue is English or French to get education in that same language everywhere
in Canada (when the number of children so warrants).
We also show that allophone immigrants assimilate less than allophone natives, and that
anglophone immigrants assimilate less into French than allophone natives. In contrast, and
this constitutes the first asymmetry between the anglophone and francophone minorities, the
English-language assimilation of francophone immigrants is actually higher than that of
fran-cophone natives.5
The language composition of cities is shown to be an important determinant of assimilation
for allophones in both types of cities. Specifically, knowledge of the city-majority language is
negatively related to the proportion of own mother tongue speakers in the city,6and positively
related to the size of the majority. This results still holds when the proportion of own mother
tongue speakers is instrumented à la Card (2001) to account for the fact that allophones may
choose their city as a function of their unobserved previous knowledge of the language of the
city. The assimilation of official minorities is also shown to be negatively related to the size of
the minority and less so to the size of the majority.
5
This holds only when Ottawa is not included in the sample. When Ottawa is included, native and immigrant francophones have similar levels of assimilation into English.
Finally, this paper shows that assimilation into French in French-majority cities and
assim-ilation into English in English-majority cities are asymmetric in several respects. First, after
controlling for city composition, francophones are shown to assimilate into English more than
anglophones into French. Second, allophone assimilation is also lower in French-majority cities
than in English-majority cities, even when allowing the language dummies and the individual
characteristics of allophones to have a different effect for the two groups of cities. Finally, the
role played by several individual characteristics on assimilation varies across the two groups of
cities. In particular, the likelihood for anglophones to speak French in French-majority cities is
more sensitive to employment status than the likelihood for francophones to speak English in
English-majority cities.
The paper is organised as follows. Section 2 presents the data, section 3 studies the
assim-ilation of official minorities, section 4 follows with the assimassim-ilation of allophones, and finally
section 5 jointly studies the assimilation of all minorities.
2
Data
We use the Public Use Microdata Files (PUMF) of the 2001 and 2006 Canadian Censuses7 to
study the determinants of the assimilation of language minorities into the city majority
lan-guage. We define an individual as being a city language minority member if he/she does not
have the city majority language as his/her mother tongue. Our sample of individuals thus
in-cludes (i) the "official minority" members -i.e. the nearly 30,000 mother tongue francophones
living in one of the 20 English-majority Census Metropolitan Areas (CMAs)8 and the 19,000
mother tongue anglophones living in one of the 3 French-majority CMAs9- and (ii) the 230,000
individuals with a mother tongue other than French or English living in a CMA, referred to as
"allophones".10
7Corresponding to2
.7%samples of the Census populations.
8Calgary, Edmonton, Halifax, Hamilton, Kitchener, Greater-Sudbury-Thunder Bay, London, Oshawa,
Ottawa-Hull-Gatineau, Regina-Saskatoon, St-Catherines-Niagara, Toronto, Vancouver, Victoria, Windsor, and Win-nipeg for both 2001 and 2006, and Moncton-Saint John, Brantford-Guelph-Barrie, Kingston-Peterborough, and Kelowna-Abbotsford only for 2006. We restrict our attention to individuals living in CMAs because the city of residence for individuals living in smaller cities is not available in the PUMFs.
9
Montréal, Québec, and Sherbrooke-Trois Rivières.
10
Table 1: Number of observations by mother tongue and immigration status: Invidividuals aged 15 or more living in a CMA, PUMF 2001 and 2006
Mother tongue Total Natives Immigrants
English 19,023 15,671 3,352
French 30,549 28,477 2,072
Allophones 228,671 39,047 189,624
Interestingly, mother tongue and immigrant status are not perfectly correlated: in our
sam-ple (see Table 1), 6.8% of the mother tongue francophones and 17.6% of the mother tongue
anglophones are actually immigrants. Similarly, 17% of the allophones and 16.8% of the
allo-phones with a non native American mother tongue are not immigrants. In order to determine
the minority status of each individual, we exploit the question on the mother tongue of the
re-spondent available in the Census (“What is the language that this person first learned at home
in childhood and still understands? If the person no longer understands the language learned,
indicate the second language learned”).
Canadian cities substantially differ in terms of the majority language, the size of this
major-ity, and the proportion of allophones. This important cross-city heterogeneity is already
appar-ent when considering the most populated seven cities in the country (see Table 2). Quebec City
is overwhelmingly native French-speaking, while Toronto, Vancouver, Calgary or Edmonton
have less than 2% native francophones and a large proportion of allophones (ranging between
16% and 36%), and finally cities as Montreal or Ottawa have significant shares of both official
languages.
Cities also differ in terms of the size and the identity of the largest allophone group in 2006.
Indeed, Table 3 shows that the size of the largest allophone group as a share of the total
popu-lation ranges from 0.22% in Moncton-Saint John to almost 7.7% in Kelowna-Abbotsford. As
a fraction of the allophone population, the share of the largest group is always quite big, but
ranges from 7.26% in Moncton-Saint John to almost 38% in Kelowna-Abbotsford. In addition,
the identity itself of the largest group importantly varies across the CMAs in the sample, with
8 different languages for 23 CMAs.11
11
Table 2: Mother tongue composition (2006)
Canada Toronto Montreal Vancouver Ottawa Calgary Edmonton Quebec city
E 58.79 57.91 11.97 59.69 50.40 76.60 78.66 1.29
F 21.65 1.07 65.13 1.01 31.29 1.36 1.95 95.32
A 16.47 35.75 17.77 35.00 14.04 19.13 16.45 2.08
EF .76 .32 1.70 .29 2.08 .38 .44 .86
EA 1.87 4.71 .89 3.84 1.41 2.40 2.37 .02
FA .26 .08 1.53 .05 .39 .01 .05 .32
EFA .20 .16 1.00 .12 .39 .09 .08 ..10
Notes: E: English; F: French; A: allophone; EF: English and French; EA: English and allophone; FA: French and allophone; EFO: English, French, and allophone.Source:100% Census tabulations, http://census2006.ca
Table 3: Share of the largest allophone mother tongue in the city population of CMAs, 2006, 100% Census Tabulations
CMA Larger allophone language Population share Share among allophones
Kelowna-Abbotsford (Bc) Punjabi 7.73 37.86
Greater Sudbury/Thunder Bay (Ont) Italian 2.77 29.98
Ottawa-Gatineau (Ont/Qc, F) Arabic 2.77 17.68
Sherbrooke-Trois Rivières (Qc, F) Spanish 2.78 17.19
Québec (Qc, F) Spanish 0.67 27.49
Moncton-Saint John (Nb) Chinese 0.22 7.26
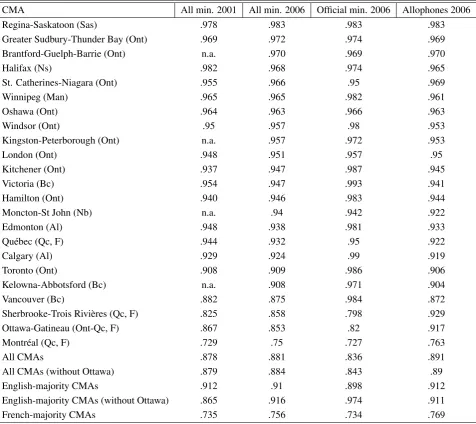
Our measure of assimilation into the city majority language is based on Question 13 in the
Census: “Can this person speak English or French well enough to conduct a conversation?”.
Table 4 reports the proportion of minority members declaring to speak well enough the city
ma-jority language. One can first note that there is variation in this proportion across cities, as the
2006 assimilation rates range from .983 in Regina-Saskatoon to .75 in Montreal. Second,
as-similation in French-majority cities is clearly lower than in English-majority cities, and comes
both from lower assimilation rates of allophones and official minorities (anglophones). Next,
when one excludes Ottawa, it appears that the relative assimilation pattern of official
minori-ties versus allophones is different in and English-majority ciminori-ties. Indeed, in
French-majority cities, the anglophones assimilate less than the allophones (.734 versus .769 in 2006)
while in English-majority cities, the francophones assimilate more than the allophones (.974
versus .911). Finally, assimilation increased between 2001 to 2006 for both types of cities,
al-though to a larger extent for English-majority cities. In addition, within English-majority cities,
assimilation generally goes up in Ontario and instead falls in Alberta and British Columbia.
The assimilation outcomes of the individual may also depend on the distance between its
mother tongue and the city majority language. In some regressions, this distance is accounted
for by a dummy for the individuals’ mother tongues. In addition, we use two alternative
mea-sures of language distance. The first measure was proposed in Dyen, Kruskal, and Black (1992)
and is based on the similarity of words across Indoeuropean languages. As a result, this
mea-sure enables us to assign a distance between English, French, and the Indoeuropean language
groups identified in the PUMFs (Dutch, German, Greek, Italian, Portuguese, Punjabi, Russian,
Spanish, and Ukrainian). Alternatively, we use the measure of distance with respect to
En-glish proposed by Chiswick and Miller (2005) which is based on the difficulties a sample of
Americans have in learning other languages. In our context, this provides us with a measure
of the distance to English of Arabic, Dutch, Chinese, French, German, Greek, Italian, Polish,
Portuguese, Russian, and Spanish.
The mothertongue language composition of cities is measured using the 100% Census
tabulations, available at http://www12.statcan.ca/english/census01 and http://census2006.ca.
propor-Table 4: Proportion of city minority members 15 or over declaring to know the city-majority language
CMA All min. 2001 All min. 2006 Official min. 2006 Allophones 2006
Regina-Saskatoon (Sas) .978 .983 .983 .983
Greater Sudbury-Thunder Bay (Ont) .969 .972 .974 .969
Brantford-Guelph-Barrie (Ont) n.a. .970 .969 .970
Halifax (Ns) .982 .968 .974 .965
St. Catherines-Niagara (Ont) .955 .966 .95 .969
Winnipeg (Man) .965 .965 .982 .961
Oshawa (Ont) .964 .963 .966 .963
Windsor (Ont) .95 .957 .98 .953
Kingston-Peterborough (Ont) n.a. .957 .972 .953
London (Ont) .948 .951 .957 .95
Kitchener (Ont) .937 .947 .987 .945
Victoria (Bc) .954 .947 .993 .941
Hamilton (Ont) .940 .946 .983 .944
Moncton-St John (Nb) n.a. .94 .942 .922
Edmonton (Al) .948 .938 .981 .933
Québec (Qc, F) .944 .932 .95 .922
Calgary (Al) .929 .924 .99 .919
Toronto (Ont) .908 .909 .986 .906
Kelowna-Abbotsford (Bc) n.a. .908 .971 .904
Vancouver (Bc) .882 .875 .984 .872
Sherbrooke-Trois Rivières (Qc, F) .825 .858 .798 .929
Ottawa-Gatineau (Ont-Qc, F) .867 .853 .82 .917
Montréal (Qc, F) .729 .75 .727 .763
All CMAs .878 .881 .836 .891
All CMAs (without Ottawa) .879 .884 .843 .89
English-majority CMAs .912 .91 .898 .912
English-majority CMAs (without Ottawa) .865 .916 .974 .911
French-majority CMAs .735 .756 .734 .769
tion of majority members, the proportion of allophones, and the proportion of mother tongue
speakers of a series of languages.12
In addition, we include variables that describe the other individual characteristics of
in-dividuals. Specifically, we include the age and sex of the respondent, its employment and
immigration status, the age at migration, and dummies establishing whether the individual has
ever been married or has a diploma.13
3
Assimilation of official minorities
Table 5 presents regressions on the determinants of knowledge of English by francophone
mi-norities in English-majority cities. Column 1 includes only individual characteristics as
regres-sors, while columns 2 to 7 add to these the characteristics of the city of residence, with the
last two columns excluding Ottawa. Concerning individual characteristics, throughout
spec-ifications, knowledge of English among francophones is higher for the individuals that are
employed, educated, married, and among immigrants, for those who were younger when they
moved to Canada. More surprisingly, francophone immigrants tend to know English more
of-ten than native francophones. However, this coefficient seems to be driven by the inclusion of
Ottawa in the sample. Indeed, when Ottawa is excluded from the sample (regressions 6 and 7),
the coefficient becomes insignificant.
Cities’ language composition in turn seems to be an important determinant of assimilation
into English mostly when Ottawa is included in the sample. Indeed, while the proportion of
francophones is always negatively correlated to the knowledge of English, the contribution of
city variables to the Pseudo R2 when Ottawa is excluded is very limited. This seems to indicate
that assimilation of francophone minorities into English in anglophone cities other than the
capital is quite homogeneous across cities and mainly depends on individual characteristics.
This would also explain why adding a dummy for Ottawa starting from a specification that
12The idea is here to have a measure of the relative size of different mother tongue language networks, i.e. the
relative number of individuals that can be reached with one’s mother tongue. Individuals who declare to have several mother tongues belong to several mother tongue networks, and for this reason the measure of the total population of the city used to construct these proportions counts bilingual individuals twice.
13
Table 5: Assimilation of francophones in anglophone cities
Dependent variable: Knowledge of English
(1) (2) (3) (4) (5) (6) (7)
Age -.003 -.004*** -.004*** -.004*** -.004*** -.0001 -.0001
(.003) (.001) (.001) (.001) (.001) (.002) (.002)
Years in Canada*Immigrant -.005 -.005 -.005 -.005 -.005 -.002 -.002
(.003) (.004) (.004) (.004) (.004) (.002) (.002)
Age at Immigration*Immigrant -.025*** -.027*** -.026*** -.028*** -.028*** -.007*** -.007***
(.007) (.003) (.002) (.002) (.002) (.002) (.002)
Male .027** .022*** .023*** .022*** .022*** .004*** .004***
(.012) (.003) (.002) (.002) (.002) (.001) (.001)
Employed .025*** .020*** .021*** .021*** .021*** .008** .008**
(.008) (.003) (.002) (.002) (.002) (.004) (.004)
Unemployed .002 -.003 -.004 -.003 -.003 -.001 -.001
(.005) (.004) (.005) (.004) (.004) (.006) (.007)
No diploma -.077** -.067*** -.069*** -.067*** -.068*** -.011** -.012***
(.033) (.011) (.008) (.009) (.009) (.005) (.004)
Ever married .043*** .026*** .027*** .026*** .026*** .010* .010*
(.010) (.003) (.004) (.003) (.003) (.005) (.005)
Immigrant .090*** .055*** .057*** .055*** .055*** -.0003 .00002
(.030) (.013) (.011) (.012) (.012) (.010) (.009)
2001 -.01 .001 .005 .005 .0002 .010*** .010***
(.007) (.004) (.005) (.004) (.006) (.003) (.003)
Proportion of francophones -.394*** -.188** -.244*** -.105*** -.114***
(.051) (.085) (.089) (.021) (.022)
Proportion of anglophones .106* -.077* 1.161** -.047*** .164
(.061) (.046) (.579) (.014) (.195)
Ottawa -.134*** -.099*** -.049
(.005) (.027) (.036)
Proportion of anglophones2 -.835** -.142
(.388) (.130)
Ottawa included Yes Yes Yes Yes Yes No No
Observations 30,067 30,067 30,067 30,067 30,067 14,695 14,695
Pseudo R2 .06 .159 .161 .162 .162 .057 .058
only includes individual characteristics (i.e. going from regression 1 to regression 3) improves
the explanatory power of the initial specification to an extent similar to that of adding the
proportion of francophones and the proportion of anglophones (i.e., going from regression 1 to
regression 2).
Table 6 extends the analysis to all official minorities, i.e. includes now also the assimilation
of anglophones in French-majority CMAs. The first column includes only individual
character-istics as regressors and shows the same signs as in the preceding table. In column 2, we allow
for potentially different patterns of assimilation in English-majority and French-majority cities
by introducing a dummy variable for francophone cities and interaction terms. This results
in an important increase in the explanatory power with respect to the initial regression and to
changes in the importance of the relevance of different individual characteristics. Specifically,
the likelihood for anglophones to speak French in French-majority cities is more sensitive to
employment status than the likelihood for francophones to speak English in English-majority
cities. Also, knowledge of French is more strongly (and positively) related to the number of
years in Canada than knowledge of English, which seems could be linked to the dominant
role played by English both at the international and at the Canadian level. Another difference
that appears from the regressions is that immigrant anglophones are actually worse than
na-tive anglophones at speaking French, while the reverse was true when comparing nana-tive and
immigrant francophones in the previous table. Finally, column 3 also includes the language
composition of cities as regressors, and shows that assimilation into the majority language is
decreasing in the size of the official minority. As this was not the case when only anglophone
cities were considered, this clearly indicates that city language composition matters more in
francophone cities as a determinant of assimilation of official minorities.
4
Assimilation of allophones
4.1
Probit estimates
We next turn to the assimilation of allophones. Table 7 presents the determinants of knowledge
char-Table 6: Assimilation of official minorities
Dependent variable: Knowledge of the city-majority language
(1) (2) (3)
acteristics and knowledge of English are quite stable across the five specifications, and present
the expected signs. Indeed, for immigrants, knowledge of English is negatively related to the
age at arrival and positively related to years in Canada. As for the remaining individual
char-acteristics, they present the same signs as in the preceding table with three exceptions. First,
marriage is negatively correlated with English proficiency, which could potentially come from
a higher prevalence of within-group marriage than for the francophones. Second, allophone
im-migrants end up with a lower English proficiency than native allophones. Finally, assimilation
seems to be lower in 2006 than in 2001. In contrast to our previous results for francophones in
Table 5, the assimilation of allophones seems to be quite sensitive to city language
composi-tion. Indeed, city-level variables are always strongly significant, and contribute in an important
way to explaining the variation of the endogenous variable. Specifically, knowledge of English
is negatively correlated to the proportion of own mother tongue speakers in the city, and
pos-itively related to the proportion of anglophones, even when language dummies and a measure
of distance to English are included in the regression as in columns 4 and 5.
Table 8 extends the analysis to all cities, i.e. includes now also the assimilation of
allo-phones in French-majority CMAs. Regressions 1 and 2 show that in the absence of interaction
terms for French-majority cities, the signs associated to the individual characteristics remain
the same as in the preceding Table. When interaction terms for individual characteristics and
language dummies are included (see regression 3) a much larger share of the variation can
be accounted for, which indicates that the patterns of assimilation in francophone cities are
different at least to some extent. In addition, while individual characteristics have the same
qualitative impact in anglophone and francophone cities (see regressions 3-5), their
quantita-tive impact differs in some cases. Specifically, age at immigration and the absence of diploma
have a much smaller negative role on assimilation in francophone cities, and the difference in
the assimilation rates of men and women are also smaller. As for city-specific variables,
assim-ilation of allophones into French in francophone cities is shown to be significantly lower than
assimilation into English in anglophone cities, and assimilation decreases with the size of one’s
Table 7: Assimilation of allophones in English-majority cities Dependent variable: Knowledge of English
(1) (2) (3) (4) (5)
Age .001 -.005*** -.006*** -.002*** -.009***
(.002) (.001) (.001) (.001) (.002) Years in Canada*Immigrant .009*** .007** .009*** .004*** .011***
(.002) (.001) (.001) (.001) (.002) Age at immigration -.024*** -.016*** -.017*** -.011*** -.017***
(.002) (.001) (.002) (.001) (.002)
No diploma -.106*** -.083*** -.087*** -.037*** -.097***
(.007) (.003) (.003) (.001) (.002)
Ever married -.014*** -.010*** -.011*** -.0002 -.013***
(.003) (.002) (.003) (.001) (.003)
Proportion of own mother tongue -.039** -.33*** -.048**
(.018) (.046) (.02)
Language Dummies No Yes Yes Yes Yes
Observations 182,902 182,902 118,130 71,750 98,151
Pseudo R2
.364 .404 .428 .428 .412
Table 8: Assimilation of allophones
Dependent variable: Knowledge of the city-majority language
(1) (2) (3) (4) (5)
Age -.005 -.01** -.007*** -.008*** -.004***
(.004) (.004) (.002) (.002) (.001)
Years in Canada*Immigrant .012*** .014*** .010*** .012*** .006***
(.003) (.005) (.002) (.002) (.001)
Age at immigration*Immigrant -.035*** -.027*** -.022*** -.022*** -.016***
(.009) (.007) (.002) (.002) (.002)
No diploma -.117*** -.104*** -.106*** -.107*** -.052***
(.008) (.009) (.004) (.003) (.001)
Ever married -.018*** -.014*** -.013*** -.014*** .0002
(.005) (.005) (.003) (.003) (.001)
Proportion of own mother tongue -.028 -.485***
(.026) (.063)
Language Dummies No Yes Yes Yes Yes
Language Dummies*F No No Yes Yes Yes
N 214,395 214,395 214,395 138,681 86,507
Pseudo R2 .26 .285 .383 .42 .419
Notes: The table displays the marginal effects estimates from a Probit model for the probability of knowledge of the city-majority language.
Regressions (1) to (3) include the individuals living in English-majority or French-majority CMAs who do not have neither English nor French
as their mother tongue. From this sample, regression (4) includes only the individuals for which the information on their mother tongue is
available in the data and therefore the variable "Proportion of own mother tongue" can be computed (i.e. individuals having Arabic, Chinese,
Dutch, German, Greek, Italian, Polish, Portuguese, Punjabi, Spanish, Russian, or Ukrainian as their mother tongue). Regression (5) further
restricts the sample to the individuals with a Indoeuropean mother tongue (i.e. all the above mentioned groups except Arabic or Chinese
4.2
IV estimates
Our results show so far that the knowledge of the city majority language is positively correlated
with the size of the majority and negatively correlated with the size of the allophone’s own
mother tongue group. One concern with such results, however, is whether they can be correctly
interpreted as reflecting the effect of the size of the ethnic group in the city or whether they
instead reflect unobserved individual heterogeneity that is correlated with the size of the group
in the city. It might be reasonable to assume that the location choice of an individual depends
on her previous knowledge or her ability to learn the language of the city. Individuals who
know the language or those who have a lower learning cost are more likely to be less sensitive
to the size of the community in the city when they choose their location. However, we do not
observe whether individuals already know the language before immigrating and we are not able
to control for differences in the ability of learning a language. These two unobserved factors
might be correlated with the size of the group in the city and as a result our estimates of the
impact of the size of the group in the city may partially reflect the fact that individuals with a
lower learning cost or who already know the language might be less likely to live in a city with
a high share of their group in the population.
To check the robustness of the estimates presented above, we use an instrumental variable
strategy to purge the size of the group in the city from its potential correlation with unobserved
factors influencing language acquisition and correlated with the size of the group in the city.
Our instrument is based on the idea that part of the variations in the size of the group across
cities depends on the respective importance of national immigrant inflows across cities (Card
2001, Bartel 1989). Past settlement patters and national inflows can thus be used to predict a
counterfactual share of the group in the city uncorrelated by construction with the distribution
of the unobserved determinants of language acquisition of previous immigrants already settled
in the city. Specifically, we use the national growth rate of a group between 2001 and 2006 to
construct an instrument for the size of the group in 2006 across cities. More precisely, denote
by gk the growth rate of group k between 2001 and 2006 in the entire population and Nlk,01
the number of individuals from the groupk in cityl in 2001. We predict a counterfactual size
ˆ
groups across cities such that Nˆlk,06 = gkNlk,01. Our endogenous variable being the share of
the group in the population of the city, we divide the counterfactual number by the population
of the city in 2006 such that our final instrument isplk,06 = ˆNlk,06/P opl,06.
This instrument is valid if the distribution of unobserved factors influencing language
acqui-sition is not correlated with differences in national growth rates across groups. Note however
that it might be possible that the location decision of immigrants already living in Canada is
influenced by the size of the immigrant flow between 2001 and 2006. For example, it might
be the case that a large increase in the number of Chinese in Canada might influence the
dis-tribution of Chinese immigrants across cities. If internal migrations generated by the size of
the migration flow are important, our instrument is potentially biased by the fact that changes
in the distribution of the unobserved factor will be correlated with the difference between the
instrument and the endogenous variable.
We find our instrument to be a strong predictor of the size of the allophone’s own mother
tongue group. A first stage regression of our instrument on the endogenous variable indicates a
t-stat superior to 10, suggesting that problems of weak instruments are not an issue.
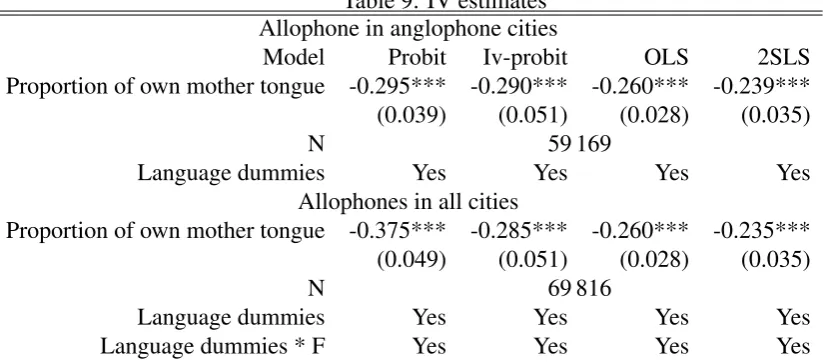
Marginal effects estimates of the impact of the size of the allophone’s own mother tongue
group on the knowledge of the city majority language are reported in table 9. Since we use data
from 2001 to create the instrument, the sample only includes individuals observed in the 2006
Census for whom we were able to compute the instrument. Panel A reports results estimated
using only anglophone cities while panel B reports results of models estimated including
fran-cophone cities. The models for both types of cities reported in table 9 include the same set
of interactions between language dummies and individual covariates with francophone cities
as in column 4 of Table 8. To ease the presentation, we only report here the coefficient of
the endogenous variable, the size of the allophone’s own mother tongue group. However, the
estimates for the other variables are similar to those in Table 8.
The probit estimates (column 1) indicate that an increase of one standard deviation in the
size of the group decreases the probability to know the city majority language by respectively
30% for English-majority cities and 38% for both types of cities. The results do not differ too
Censuses. Column 2 reports the estimates from an instrumental variable probit estimated with
conditional maximum likelihood. We find Panel A’s results to be similar to those of the
sim-ple probit model, while the predicted marginal effect declines by 10% with when francophone
cities are included in the sample (see Panel B). In both cases, however, the estimated marginal
effects remain large and are statistically significant.
However, as the estimation of a probit model with endogenous explanatory variable
de-mands fairly strong assumption (see e.g. Wooldridge, 2002, p. 585 for a discussion), we check
the robustness of the results by estimating several linear probability models with 2SLS. To ease
the comparison with the probit estimates, we rescale the parameters of interest in the regression
by standardising the variable of interest to have an average of zero and a standard deviation of
one across each sample. As a result, the estimates reported in columns 3 and 4 can be directly
interpreted as the effect on the probability to know the city-majority language of an increase by
one standard deviation in the size of the allophone’s own mother tongue group . The OLS and
2SLS estimates reported respectively in columns 3 and 4 are similar to those obtained using a
probit model. Specifically, the OLS estimates show that an increase in one standard deviation
of the size of the allophone’s group results in a 26% decline in the probability to know the
city-majority language. In addition, when the potential endogeneity is accounted for (see column
4), the estimated effect declines only to 24%.14
5
Assimilation of all minorities
We jointly analyse now the assimilation of all language minorities, i.e. both official minorities
and allophones. Table 10 presents the determinants of assimilation into English in
English-majority cities, with columns 1 to 5 including all English-English-majority CMAs, and columns 6 and
7 excluding Ottawa. The signs of the individual characteristics are coherent with the estimates
of tables 5 and 7, and the level of assimilation conditional on individual and city
characteris-tics is shown again to have declined between 2001 and 2006. In addition, the assimilation of
francophones is lower than the assimilation of allophones, even in the more complete set of
14
Table 9: IV estimates Allophone in anglophone cities
Model Probit Iv-probit OLS 2SLS
Proportion of own mother tongue -0.295*** -0.290*** -0.260*** -0.239*** (0.039) (0.051) (0.028) (0.035)
N 59 169
Language dummies Yes Yes Yes Yes
Allophones in all cities
Proportion of own mother tongue -0.375*** -0.285*** -0.260*** -0.235*** (0.049) (0.051) (0.028) (0.035)
N 69 816
Language dummies Yes Yes Yes Yes
Language dummies * F Yes Yes Yes Yes
Notes: Each estimate comes from a different model. In all regressions, the dependent variable is the probability to know the city-majority language. Panel A presents regressions for English-majority CMAs, while Panel B also includes French-majority CMAs. Column 1 and 2 report marginal effects from respectively a probit and IV-probit model of increasing the proportion of own (allophone) mother tongue speakers in the CMA by one standard deviation. Columns 3 and 4 report respectively the corre-sponding OLS and 2SLS estimates, where the dependent variable has been standardised to have a zero average and a standard deviation equal to one.
regressions that include language dummies and interactions between individual characteristics
and French as a mother tongue (3 to 7) and when Ottawa is excluded from the sample (6 and 7).
Finally, the language composition of cities does matter. Indeed, on the one hand, assimilation
is systematically increasing in the size of the anglophone majority. In addition, allophones’
assimilation is decreasing in the size of the allophone’s own mother tongue group, while this
factor is less important in some specifications for the francophones.
When extending the analysis to include all cities (see Table 11, the impact of individual
characteristics is unchanged, and again a lower assimilation is observed for 2006. In addition,
a lower assimilation level of official minorities relative to allophones’ assimilation is observed,
both for francophones in English-majority cities and anglophones in French-majority cities.
Also, the level of assimilation in francophone cities is systematically lower than in anglophone
cities, even when allowing the language dummies and the individual characteristics of the
of-ficial minority members to be different for anglophone and francophone cities (equations 3 to
5). Finally, city composition has the same qualitative impact as in the analysis for anglophone
Table 10: Assimilation of all minorities in anglophone cities
Dependent variable: Knowledge of English
(1) (2) (3) (4) (5) (6) (7)
Age .0001 .001* -.006*** -.008*** -.004*** -.004*** -.006***
(.003) (.001) (.001) (.001) (.001) (.001) (.001)
Years in Canada*Immigrant .005* .0004 .008*** .011*** .007*** .007*** .009***
(.003) (.001) (.001) (.002) (.001) (.001) (.001)
Age at immigration*Immigrant -.038*** -.030*** -.018*** -.021*** -.018*** -.015*** -.017***
(.008) (.005) (.002) (.002) (.002) (.002) (.002)
Male .017*** .015*** .012*** .013*** .011*** .01*** .011***
(.005) (.003) (.0004) (.001) (.001) (.0003) (.001)
Employed .022*** .019*** .021*** .020*** .019*** .018*** .016***
(.002) (.002) (.001) (.001) (.001) (.001) (.001)
Unemployed .009*** .008*** .008*** .007*** .011*** .007*** .005***
(.002) (.002) (.001) (.001) (.001) (.001) (.001)
No diploma -.114*** -.088*** -.093*** -.102*** -.059*** -.083*** -.087***
(.011) (.007) (.002) (.003) (.002) (.001) (.002)
Ever married -.005 -.003 -.011*** -.013*** -.0002 -.010*** -.011***
(.010) (.007) (.002) (.003) (.002) (.002) (.003)
Immigrant .143 .052** -.012** -.024*** -.014** -.011*** -.019***
(.088) (.020) (.005) (.007) (.007) (.004) (.005)
2001 .010*** .008*** .007*** .008*** .003** .007*** .009***
(.002) (.002) (.001) (.002) (.001) (.001) (.001)
French mother tongue (Fmt) -.177*** -.204*** -.214*** -.12*** -.266*** -.250***
(.057) (.034) (.037) (.022) (.057) (.048)
Proportion of anglophones .040*** .045*** .015 .029*** .032***
(.006) (.008) (.009) (.004) (.007)
Ottawa .007 -.002 -.022***
(.012) (.002) (.003)
Ottawa*francophone -.099*** -.127*** -.057***
(.008) (.040) (.022)
Prop. own mother tongue -.036*** -.561*** -.036***
(.014) (.073) (.012)
Prop. own mother tongue*Fmt .052 .576*** .023
(.040) (.071) (.036)
Similarity to English (DHB) .021***
(.004)
Language Dummies No Yes Yes Yes Yes Yes Yes
Indiv. Characteristics*Fmt No No Yes Yes Yes Yes Yes
Ottawa included Yes Yes Yes Yes Yes No No
Observations 212,969 212,969 212,969 148,197 101,817 190,923 128,777
Pseudo R2 .279 .341 .369 .377 .34 .403 .424
Table 11: Assimilation of all minorities
Dependent variable: Knowledge of the city-majority language
(1) (2) (3) (4) (5)
Age -.013 -.009 -.008*** -.011*** -.007***
(.011) (.008) (.002) (.002) (.002)
Years in Canada*Immigrant .010* .009 .012*** .016*** .012***
(.006) (.008) (.002) (.003) (.002)
Age at immigration*Immigrant -.038*** -.036*** -.026*** -.030*** -.029***
(.007) (.007) (.003) (.003) (.003)
No diploma -.109*** -.104*** -.129*** -.141*** -.098***
(.014) (.008) (.002) (.003) (.003)
Ever married .005 -.003 -.017*** -.019*** -.001
(.012) (.008) (.004) (.005) (.003)
Immigrant .079 -.015 -.019** -.035*** -.024*
(.060) (.056) (.008) (.011) (.013)
2001 .005 .008*** .007** .007*** .004**
(.005) (.002) (.003) (.003) (.002)
French mother tongue -.189*** -.262*** -.275*** -.114***
(.071) (.043) (.048) (.020)
English mother tongue -.442*** -.125*** -.273*** .042***
(.028) (.006) (.022) (.004)
F -.116*** -.044* -.404***
(.034) (.027) (.069)
Proportion of majority .079*** .098*** .085***
(.013) (.018) (.020)
Proportion of official minority -.157** -.168* -.114
(.076) (.094) (.083)
Ottawa .029** .038*** .021
(.012) (.013) (.017)
Proportion of own mother tongue .012 -.023
(.036) (.070)
Similarity to majority language (DHB) .028***
(.001)
Language Dummies No Yes Yes Yes Yes
Language Dummies *F No No Yes Yes Yes
Individual Characteristics*Official Minority Member No No Yes Yes Yes
Individual Characteristics*francophone No No Yes Yes Yes
Observations 263,151 263,151 263,151 187,437 135,263
Pseudo R2 .169 .249 .348 .359 .333
6
Conclusion
The existing empirical literature on language assimilation in officially bilingual countries has
focused on the assimilation of immigrants. While this is a very important issue in the debates or
conflicts accompanying official multilingualism, the assimilation of official language minorities
is also a particularly sensitive issue. This is because official language minorities at the national
level are frequently majorities in some geographical locations, and one important dimension
along which official bilingualism is frequently judged is its ability to provide incentives for
majority members to learn the national-minority but local-majority language. For this reason,
this paper studies the assimilation into the city-majority language of all language minority
members, no matter their immigrant or official-language status. The country chosen for the
analysis is Canada, given the availability of data and also the importance of the language debate,
which was one of the key elements put forward by the proponents of Quebec’s secession in the
1980 and 1995 referenda. Our results confirm the asymmetric nature of Canadian biligualism:
assimilation into French in French-majority cities is lower than assimilation into English in
English-majority cities even when account is taken of the language composition of cities and
a rich set of dummies. In addition, the role played by several individual characteristics varies
across the two groups of cities. We also show that the official language minorities assimilate
less than the allophones, and immigrants tend to assimilate less than natives. Finally, we show
that assimilation increases in the size of the majority and decreases in the size the individual’s
own language group, and that this applies both to allophones and to the official minorities.
References
Barbaud, Philippe, “French in Quebec,” in John Edwards, ed., Language in Canada,
Cam-bridge University Press 1998.
Card, David, “Immigrant Inflows, Native Outflows, and the Local Market Impacts of Higher
Chiswick, Barry R. and Paul W. Miller, “Language Choice among Immigrants in a
Multi-lingual Destination.,”Journal of Population Economics, 1994,7(2), 119 – 131.
and , “A Model of Destination-Language Acquisition: Application to Male Immigrants
in Canada.,”Demography, 2001,38(3), 391 – 409.
Church, Jeffrey and Ian King, “Bilingualism and Network Externalities.,”Canadian Journal
of Economics, 1993,26(2), 337 – 345.
Fishman, Joshua, “Bilingualism with and without diglossia; diglossia with and without
bilin-gualism,” in Christina Bratt Paulston and Richard Tucker, eds.,Sociolinguistics, 2003,
Black-well Publishing, reprinted from Journal of Social Issues 32, 1967.
John, Andrew and Kei-Mu Yi, “Language and Location,” Mimeo 2001.
Lang, Kevin and Erez Siniver, “The Return to English in a Non-English Speaking Country:
Russian Immigrants and Native Israelis in Israel,” The B.E. Journal of Economic Analysis
and Policy, Topics, 2009,9(1), Article 50.
Lazear, Edward P., “Culture and Language.,” Journal of Political Economy, 1999, 107 (6),
S95 – 126.
McRae, Kenneth D.,Conflict and Compromise in Multilingual Societies. Vol. 1: Switzerland.,
Wilfried Laurier University Press, 1983.
,Conflict and Compromise in Multilingual Societies. Vol. 2: Belgium., Wilfried Laurier
Uni-versity Press, 1986.
Mougeon, Raymond, “French outside New Brunswick and Quebec,” in John Edwards, ed.,
Language in Canada, Cambridge University Press 1998.
Paulston, Christina Bratt, “Linguistic Minorities and Language Policies,” in Christina Bratt
Paulston and Richard Tucker, eds.,Sociolinguistics, Blackwell Publishing 2003.